Mixed-Use Apartment
For Sale
$4,850,000
1414-24 W Devon, Chicago, IL 60660
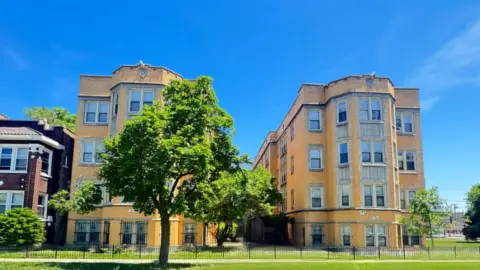
24-unit mixed-use property with modernized kitchens and strong proximity to Loyola University and transit.
Property Size23,406 SF
Days on Market128
Property Features for 1414-24 W Devon
General Information
Standard status
Active
Size
23,406 SF
Property subtype
Multifamily
Additional Details
Multifamily Units
24
Building Details
Building Size
23,406 SF
Year Built
1921
Tenancy
Multi
Listing Agency:
Kiser Group
Listed By:
Jacob Price · License #IL #475.201874
(773) 293-5045
Source:
Kisergroup
Added: Jun 2
Changed: Sep 12
Last Checked: Oct 5 at 3:29PM
Displayed information is deemed reliable but is not guaranteed and should be independently verified. All listing content including descriptions, pricing, images are the copyrighted material of Kiser Group
Investment Insights
Based on property information with market context.
This 1920s-constructed mixed-use apartment building offers 24 units with two- and three-bedroom layouts. Apartments feature modernized kitchens with stainless steel appliances, granite countertops, and hardwood flooring. The property also presents approximately 11% upside in current rents, providing a clear path for operators focused on value creation.
The building is well-situated in Chicago’s Rogers Park neighborhood, with convenient access to major destinations. It is approximately 0.4 miles to the Loyola University campus, about 0.5 miles to the Loyola Red Line CTA station, and roughly 0.6 miles to Lake Michigan.
With its unit mix, interior updates, and commuter-friendly location near Loyola, this property is well-suited for investors seeking a stable residential income asset with room to improve through rent optimization. The mixed-use nature can also appeal to ownership groups looking for flexibility in their operating strategy while maintaining a strong tenant demand base tied to the university and transit access.
The building is well-situated in Chicago’s Rogers Park neighborhood, with convenient access to major destinations. It is approximately 0.4 miles to the Loyola University campus, about 0.5 miles to the Loyola Red Line CTA station, and roughly 0.6 miles to Lake Michigan.
With its unit mix, interior updates, and commuter-friendly location near Loyola, this property is well-suited for investors seeking a stable residential income asset with room to improve through rent optimization. The mixed-use nature can also appeal to ownership groups looking for flexibility in their operating strategy while maintaining a strong tenant demand base tied to the university and transit access.
Key Highlights
- 24‑unit mixed‑use property built in 1921 in Chicago’s Rogers Park neighborhood
- Within 0.4 miles of Loyola University campus
- 0.5 miles to the Loyola Red Line CTA station
Financial Insights
Estimated NOI and Cap Rate
NOI / Yr
$358,794
Cap Rate
7.40%
Suggested Prices Based on Cap Rates
Cap Rate 5%
$7,175,880
$7.2M
Cap Rate 7%
$5,125,629
$5.1M
Cap Rate 9%
$3,986,600
$4.0M
Market Conditions
NOI Build-Up for 23,406 SF
Gross rent
$688.1K $29.40/SF
− Vacancy
−$35.8K −$1.53/SF
EGI
$652.4K $27.87/SF
− OpEx
−$293.6K −$12.54/SF
NOI
$358.8K $15.33/SF
Area
Chicago, IL
Vacancy
5.20%
Lease Rate
$29.40 /SF/Yr
Expense Ratio
45.00%
Simulate Cap Rate and NOI
Suggested Prices Based on Cap Rates
Cap Rate 5%
$7,175,880
Cap Rate 7%
$5,125,629
Cap Rate 9%
$3,986,600
Alternative Uses
Best Use
Apartment 5plus
$5.13M
$4.48M – $5.98M
NOI $358,794 @ 7.0% cap · market cap 7.40%
Second Best
—
—
no second resolved use
Theoretical Best
Office A
$11.04M
$9.66M – $12.88M
NOI $772,510 @ 7.0% cap · market cap 15.93%
Zoning and permitted uses should be independently verified with authorities.
Property Analytics
Unlock full access to Insights
Subscribe to Realmo Intelligence
Open Analytics
Current Use
Lease Details
24
Residential units
Multi-tenant
Tenancy
Location Intelligence
Trade Area within ½ mile
2,794
Businesses Nearby
Explore this area
Business Placement
Demographics for 60660, IL
42,534
Population
23,508
Households
1.8
Avg Household Size
38
Median Age
57%
College-Educated
93%
High-School Grad
1.3 sq mi
ZIP Area
32,718
Density / Sq Mi
$66,206
Median Household Income
$46,871
Median Earnings
$1,286
Median Rent
$287,500
Median Home Value
Check the figures for this property
Cap Rate, Value Estimation, Potential NOI and more
View Realmo Analytics
Market
Vacancy Rate% for Multifamily in Midwest region

Questions? Ask Rey
Realmo’s AI knows this listing — price, zoning, demand, history. Ask anything.



Frequently Asked Questions
What type of property is this?
Apartment building - 24-unit mixed-use property with modernized kitchens and strong proximity to Loyola University and transit.
Where is this apartment building located?
The property is located at 1414-24 W Devon Chicago, IL.
What is the asking price?
The asking price for this property is $4,850,000.
What are key features of this property?
This property features: 24‑unit mixed‑use property built in 1921 in Chicago’s Rogers Park neighborhood; Within 0.4 miles of Loyola University campus; 0.5 miles to the Loyola Red Line CTA station



