Downtown Mixed-Use Redevelopment
For Sale
Contact for pricing
140 N 100 E, American Fork, UT 84003
Combined office building plus adjacent vacant land under CC-1 Central Commercial zoning in American Fork’s downtown core.
Property Size4,293 SF
Lot Size0.62 Acres
Price / SF$349.41
Days on Market130
Property Features for 140 N 100 E
General Information
Standard status
Active
Size
4,293 SF
Class
B
Total Parking Spaces
25
Lot size
0.62 Acres
Property subtype
Office
Zoning
CC-1
Investment Type
Value Add
Site & Location
Traffic Count
21,000 vehicles/day
Highway Access
Yes
Building Details
Year Built
1975
Buildings
1
Stories
2
Units
1
Listing Agency:
40 North Real Estate - Bryant Bishop - Intelligence
Listed By:
Bryant Bishop · License #5507982-PB00
Source:
Crexi
Added: Jun 17
Changed: Oct 6
Last Checked: Oct 23 at 4:55AM
Displayed information is deemed reliable but is not guaranteed and should be independently verified. All listing content including descriptions, pricing, images are the copyrighted material of 40 North Real Estate - Bryant Bishop - Intelligence

Ask AI about this property
Review the available facts, identify missing information and prepare questions for the agent.
Investment Insights
Based on property information with market context.
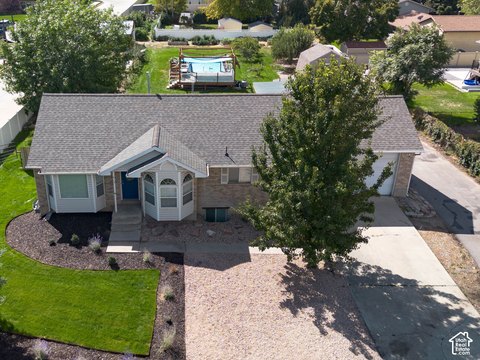
The offering includes two adjacent parcels conveyed together, anchored by a 4,293 SF office building constructed in 1975 with 2,557 SF on the main level and 1,736 SF of finished basement space. The existing site also includes 25 surface parking stalls. The second parcel is vacant land, providing flexibility for phased development or full-site redevelopment while the existing structure remains available for owner-user occupancy or interim lease income.
Both parcels are located on the east side of 100 East between 100 North and 200 North in American Fork’s downtown core, and are zoned CC-1 Central Commercial. This zoning classification permits a broad range of uses including retail, office, restaurant, hotel, theater, and higher-density residential above ground-floor commercial. The property is approximately 1.5 blocks north of State Street and about 1.2 miles from I-15 access. The FrontRunner commuter rail station is approximately 1.8 miles away, and nearby traffic counts are reported to exceed 21,000 VPD.
Interested buyers should review and verify zoning, permitted uses, development standards, and material facts with American Fork City Planning.
Both parcels are located on the east side of 100 East between 100 North and 200 North in American Fork’s downtown core, and are zoned CC-1 Central Commercial. This zoning classification permits a broad range of uses including retail, office, restaurant, hotel, theater, and higher-density residential above ground-floor commercial. The property is approximately 1.5 blocks north of State Street and about 1.2 miles from I-15 access. The FrontRunner commuter rail station is approximately 1.8 miles away, and nearby traffic counts are reported to exceed 21,000 VPD.
Interested buyers should review and verify zoning, permitted uses, development standards, and material facts with American Fork City Planning.
Key Highlights
- CC‑1 Central Commercial downtown zoning permits retail, office, restaurant, hotel, theater, and higher‑density residential above ground‑floor commercial.
- Offered together: 140 N 100 E plus adjacent 126 N 100 E totaling approx. 0.62 acres (27,007 SF) on the east side of 100 East between 100 N and 200 N.
- Primary parcel includes a 4,293 SF office building built in 1975 (2,557 SF main level + 1,736 SF finished basement).
Financial Insights
Estimated NOI and Cap Rate
NOI / Yr
$60,274
Cap Rate
4.02%
Suggested Prices Based on Cap Rates
Cap Rate 5%
$1,205,480
$1.2M
Cap Rate 7%
$861,057
$861.1K
Cap Rate 9%
$669,711
$669.7K
Market Conditions
NOI Build-Up for 4,293 SF
Gross rent
$103.0K $24.00/SF
− Vacancy
−$22.7K −$5.28/SF
EGI
$80.4K $18.72/SF
− OpEx
−$20.1K −$4.68/SF
NOI
$60.3K $14.04/SF
Area
Utah County, UT
Vacancy
22.00%
Lease Rate
$24.00 /SF/Yr
Expense Ratio
25.00%
Simulate Cap Rate and NOI
Suggested Prices Based on Cap Rates
Cap Rate 5%
$1,205,480
Cap Rate 7%
$861,057
Cap Rate 9%
$669,711
Alternative Uses
Best Use
Office B
$861.1K
$753.4K – $1.00M
NOI $60,274 @ 7.0% cap · market cap 4.02%
Second Best
—
—
no second resolved use
Theoretical Best
Office A
$1.18M
$1.04M – $1.38M
NOI $82,838 @ 7.0% cap · market cap 5.52%
Zoning and permitted uses should be independently verified with authorities.
How Realmo checks its estimates
Property Analytics
Contact the owner directly
Get the owner's phone numbers and email
Open Analytics
Current Use
Lease Details
21,000 VPD
Traffic count
Yes
Highway access
Location Intelligence
Trade Area within ½ mile
1,141
Businesses Nearby
Explore this area
Business Placement
Demographics for 84003, UT
52,970
Population
16,441
Households
3.2
Avg Household Size
29
Median Age
50%
College-Educated
96%
High-School Grad
73.6 sq mi
ZIP Area
720
Density / Sq Mi
$120,262
Median Household Income
$41,591
Median Earnings
$1,692
Median Rent
$580,600
Median Home Value
Check the figures for this property
Cap Rate, Value Estimation, Potential NOI and more
View Realmo Analytics
Market
Vacancy Rate% for Office in West region




Frequently Asked Questions
What type of property is this?
Office building - Combined office building plus adjacent vacant land under CC-1 Central Commercial zoning in American Fork’s downtown core.
Where is this office building located?
The property is located at 140 N 100 E American Fork, UT.
What is the asking price?
The asking price for this property is $1,500,000.
What are key features of this property?
This property features: CC‑1 Central Commercial downtown zoning permits retail, office, restaurant, hotel, theater, and higher‑density residential above ground‑floor commercial.; Offered together: 140 N 100 E plus adjacent 126 N 100 E totaling approx. 0.62 acres (27,007 SF) on the east side of 100 East between 100 N and 200 N.; Primary parcel includes a 4,293 SF office building built in 1975 (2,557 SF main level + 1,736 SF finished basement).


