Two-Unit Duplex for
14-16 Hamilton Street Allentown, NJ 08501
For Sale
$450,000
MULTI_FAMILY - Allentown, NJ
Property Size1,896 SF
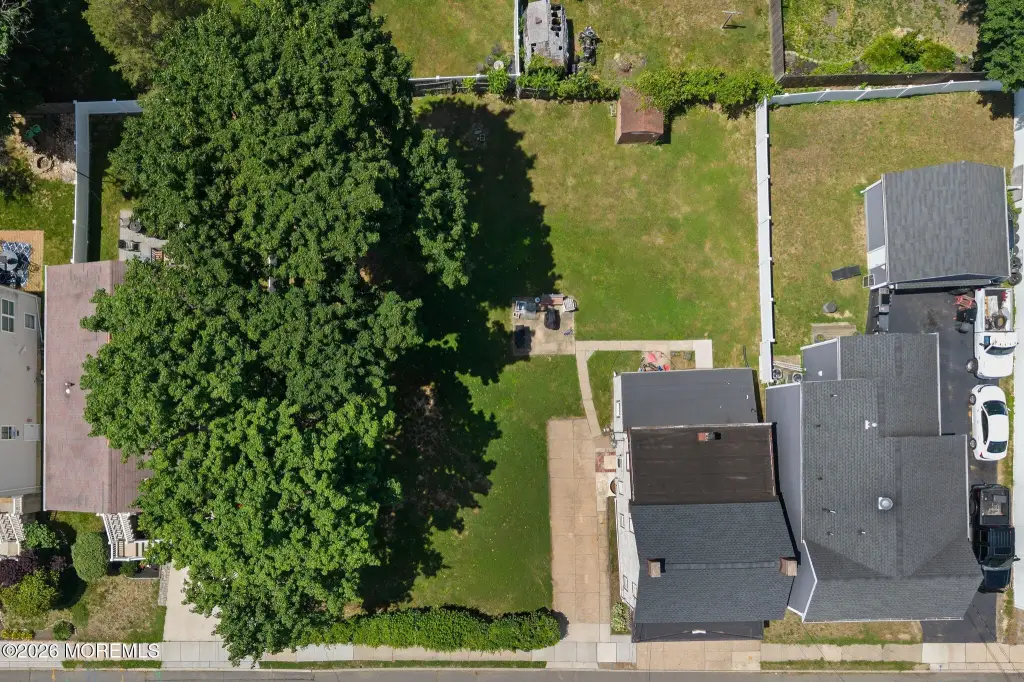
Lot Size0.24 Acres
Price / SF$237.34
Days on Market47
Property Features for 14-16 Hamilton Street
General Information
Property type
Residential Multi Family
Property subtype
Duplex
Bedrooms
4
Bathrooms
3
Rooms
Bathroom 4, Bedroom 1, Bedroom 4, Bathroom 1, Bedroom 2, Bedroom 3, Basement, Bathroom 2, Bathroom 3
Parking
2
Parking features
Off Street
Basement
Dirt Floor
Standard status
Active
APN
03-00006-0000-00026
Size
1,896 SF
Lot size
0.24 Acres
Taxes and HOA fees
Tax Year
2025
Tax Annual Amount
8839
Utilities
Sewer type
Public Sewer
Heating system
Baseboard
Water source
Public
Building Details
Year built
1930
Floors in Building
2
Number of units
2
Roof type
Shingle
Listing Agency:
Keller Williams Premier Office
(609) 459-5100
Listed By:
Patricia M Hogan · License #339824
(609) 459-5100
Added: Jun 12
Changed: Jul 17
Last Checked: Jul 28 at 12:06AM
MLS# 22617783
Copyright © 2026 More MLS. All rights reserved. All information provided by the listing agent/broker is deemed reliable but is not guaranteed and should be independently verified.
Investment Insights
Based on property information with market context.
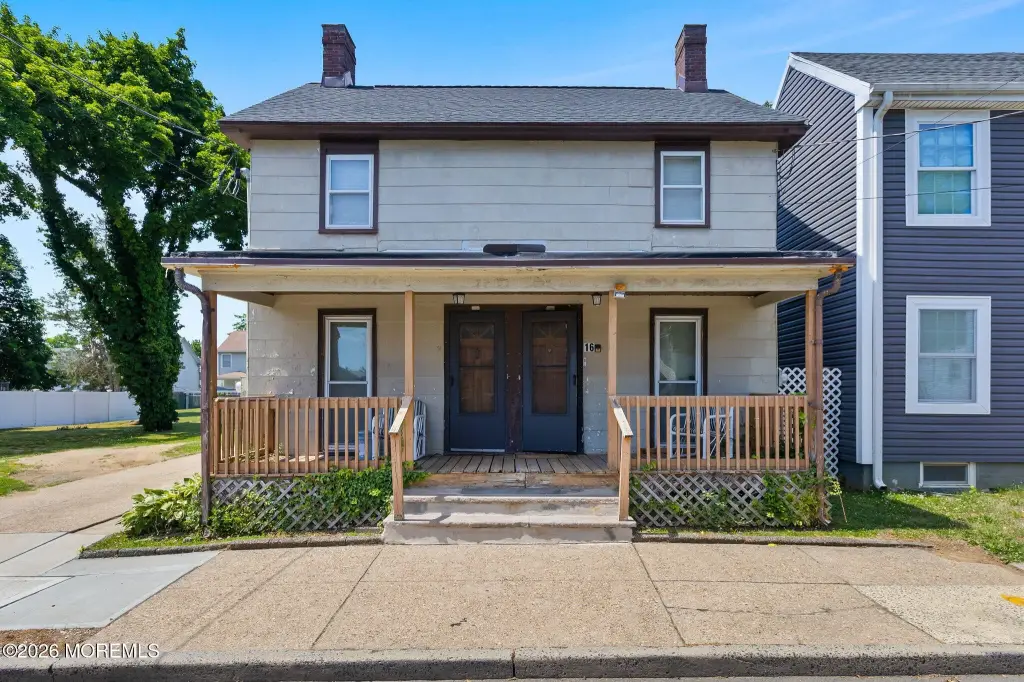
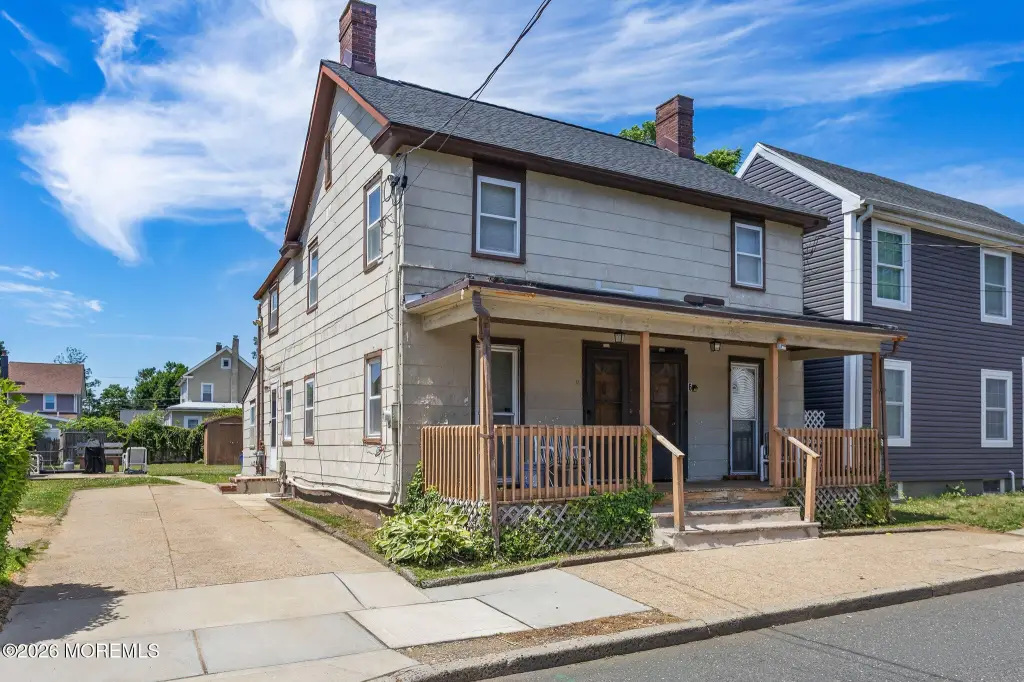
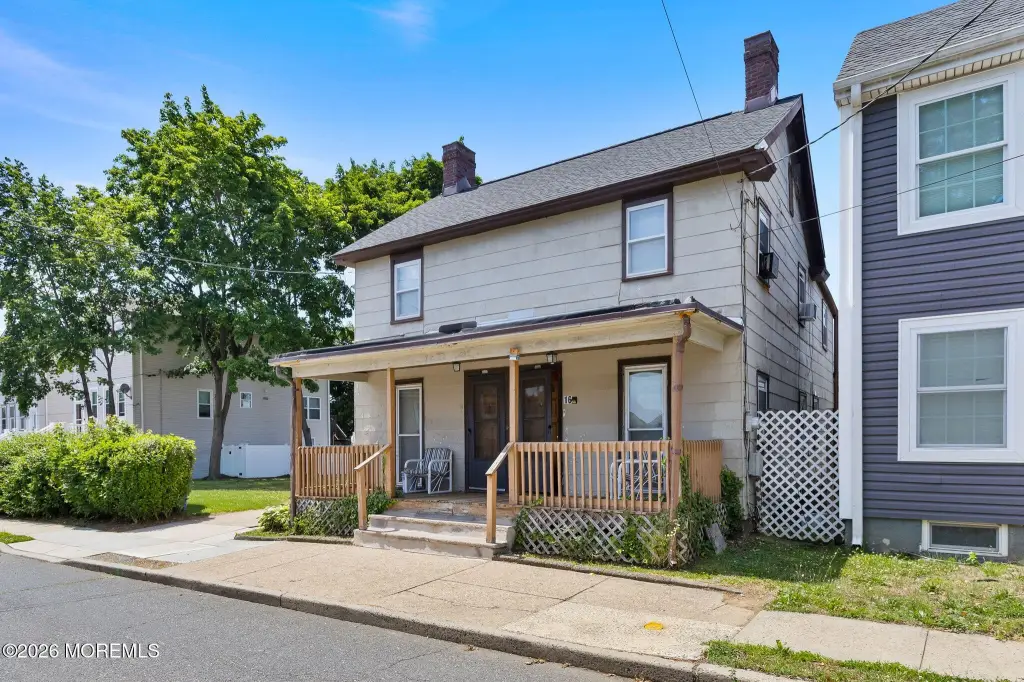
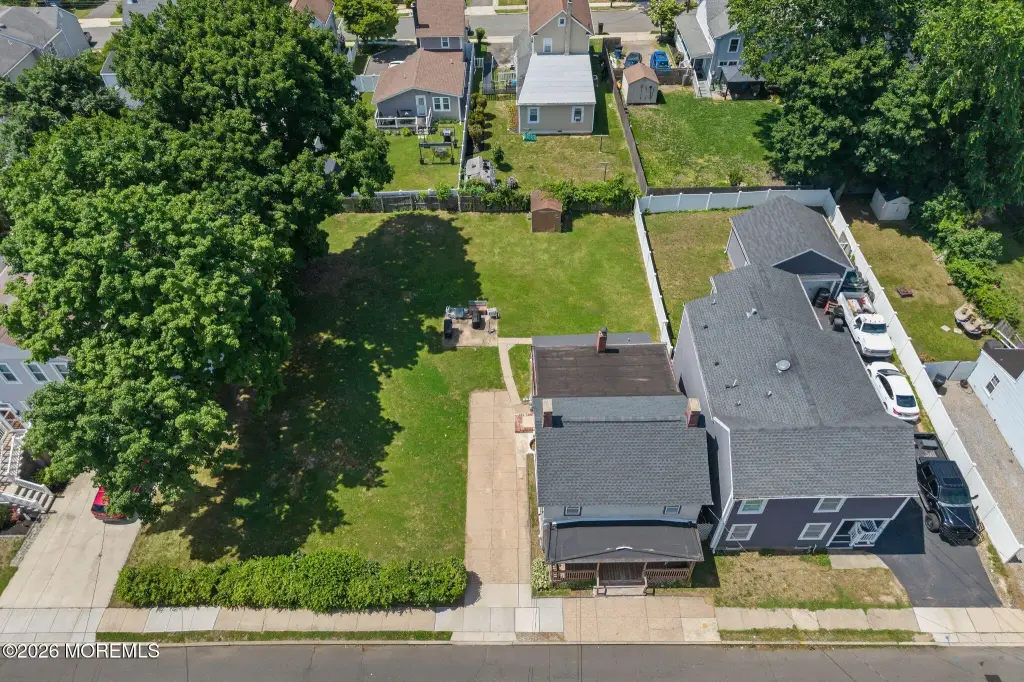
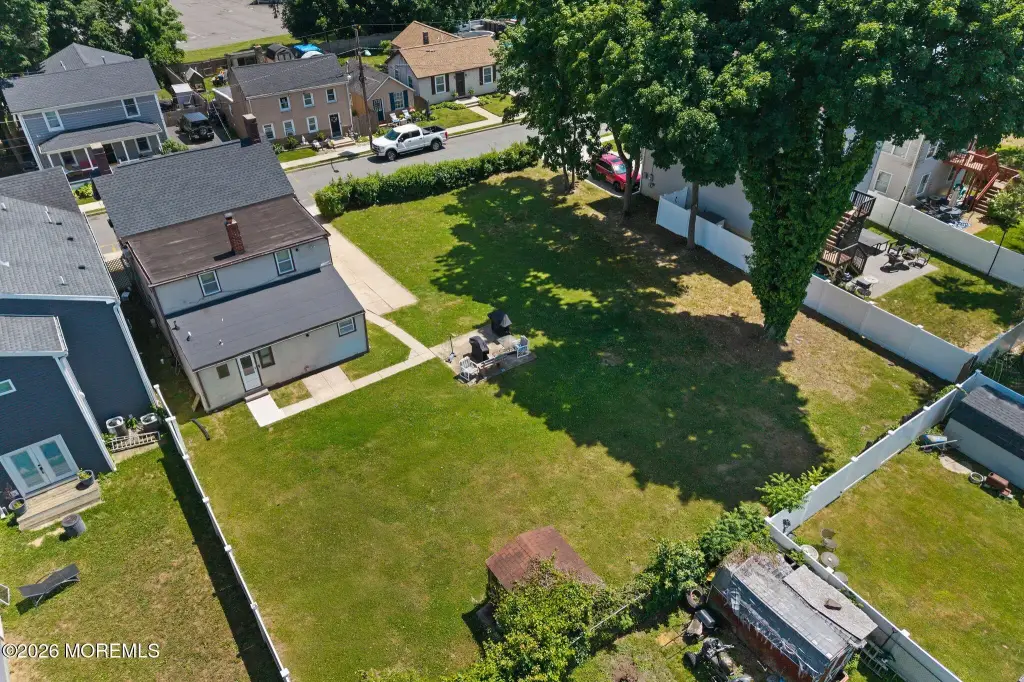
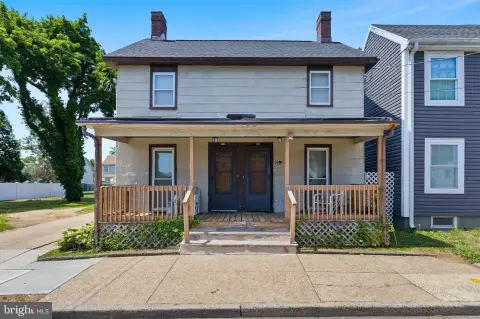
This duplex includes two separate residential units on a single double lot setting. Unit 1 is a two-story layout with three bedrooms and 1.5 bathrooms, featuring living room, dining room, kitchen, and an attic. Unit 2 offers one to two bedrooms with one bathroom, along with a living room and kitchen. The property is being sold strictly as-is, and buyers should plan for their own updates and due diligence.
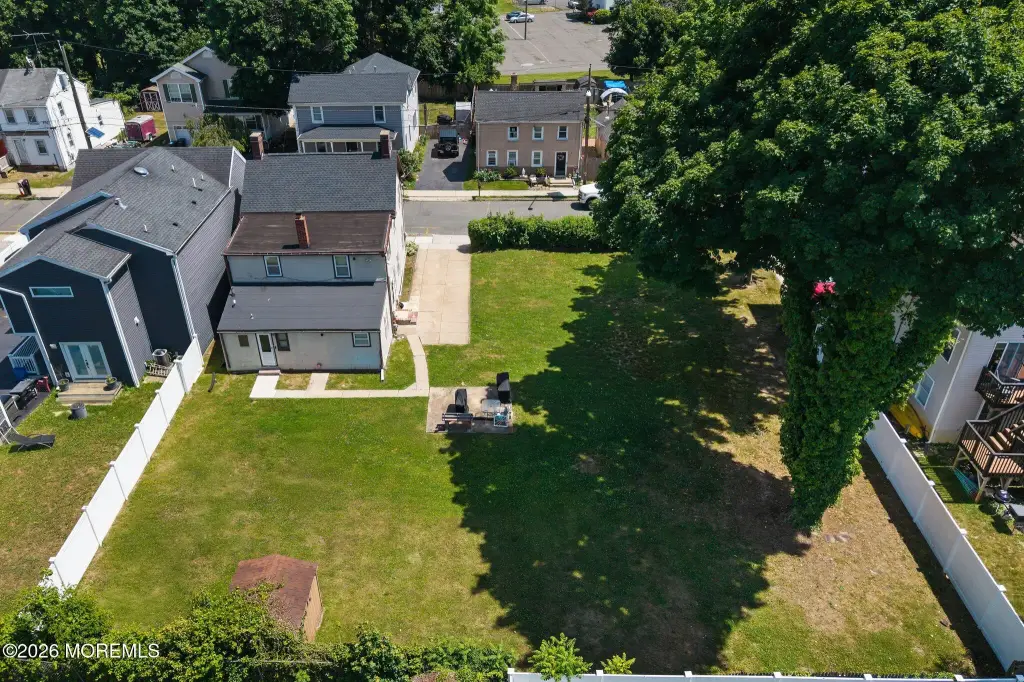
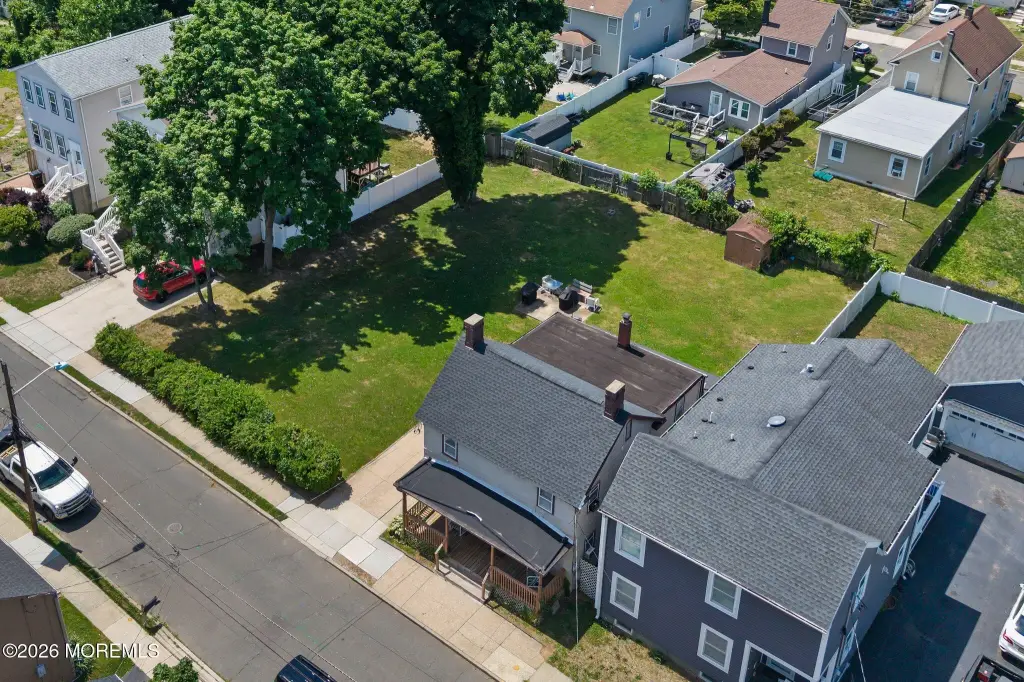
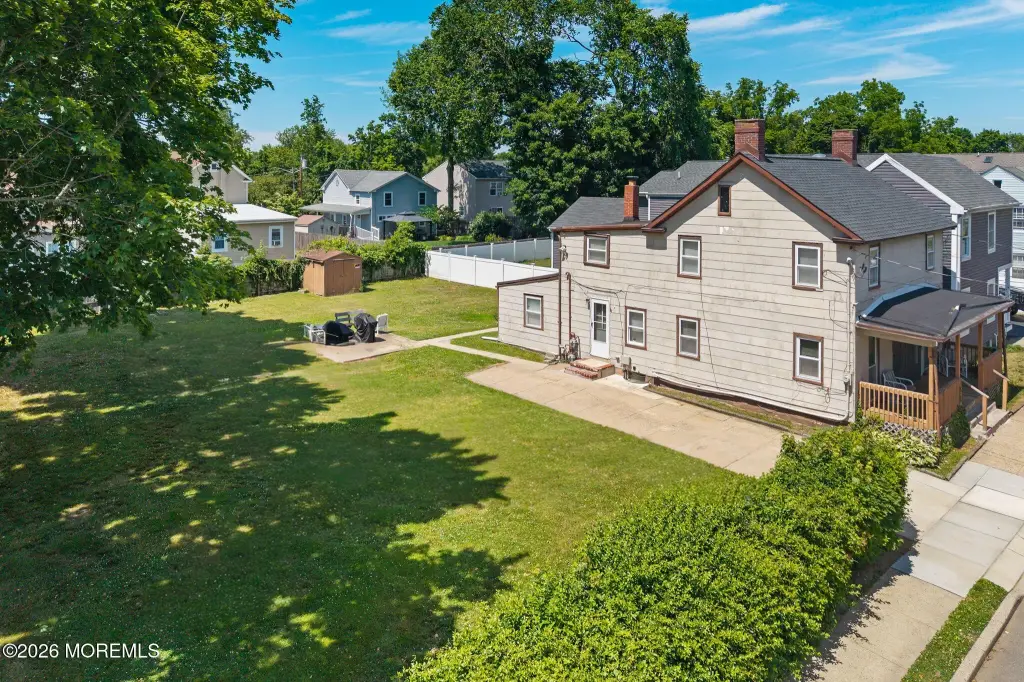
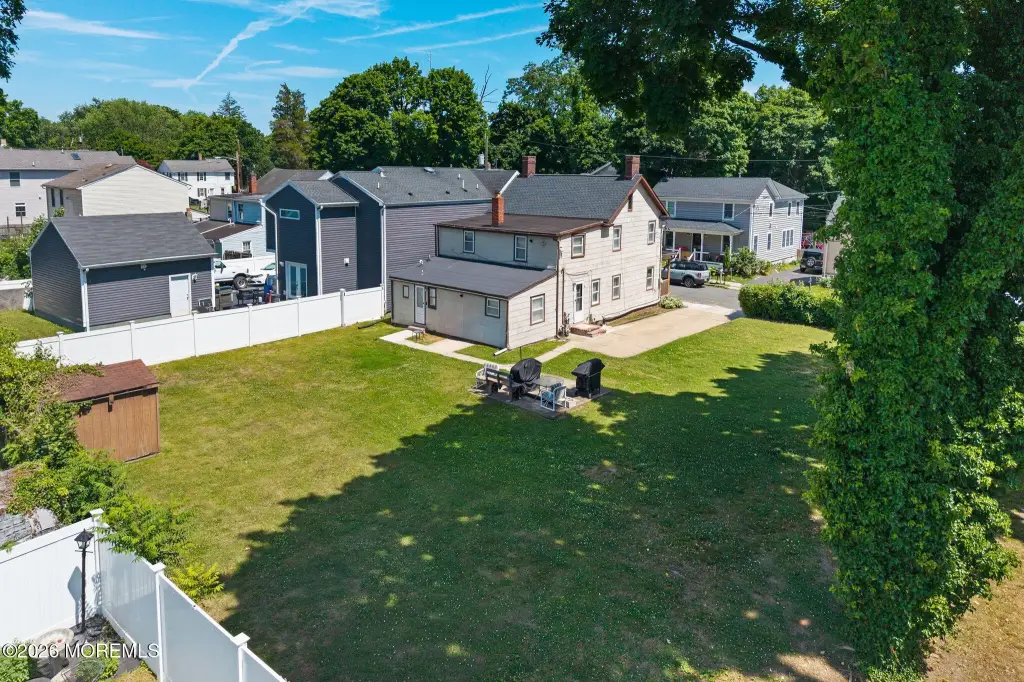
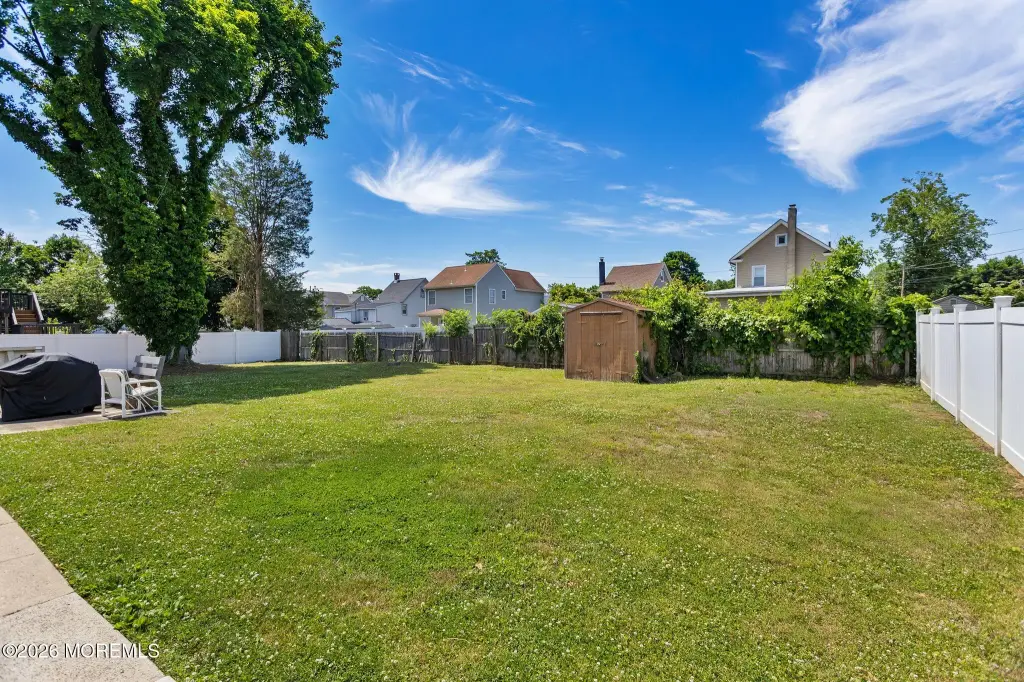
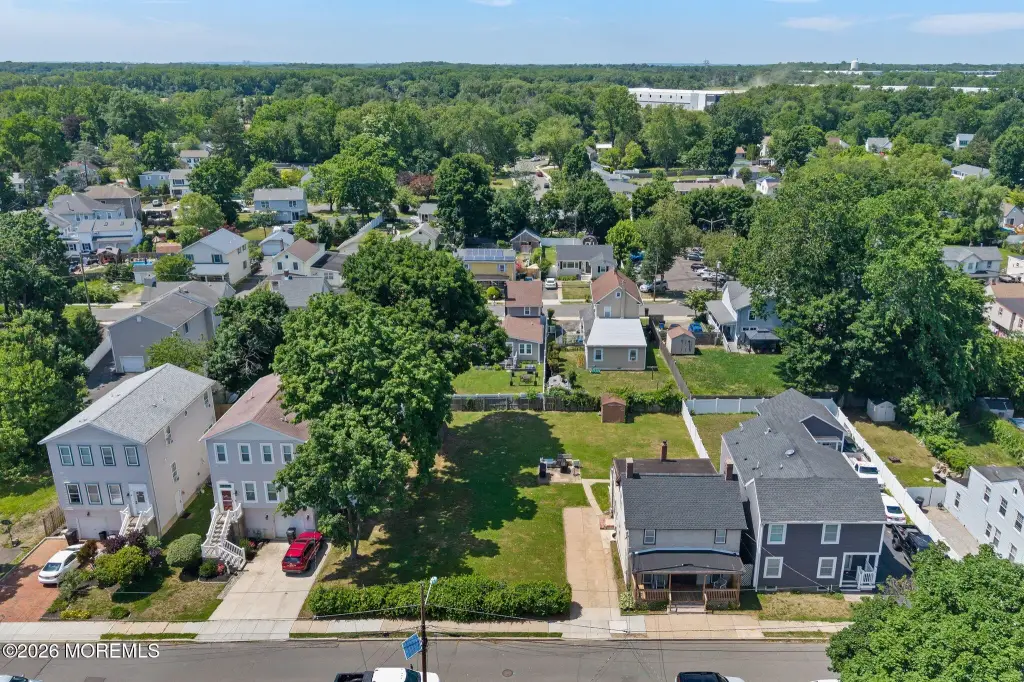
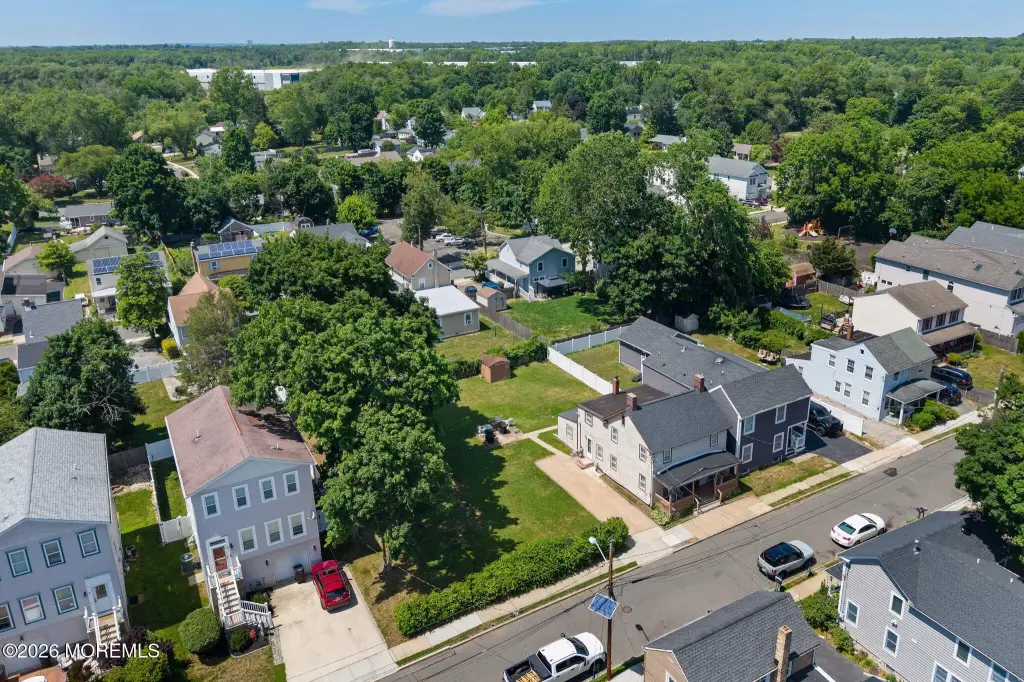
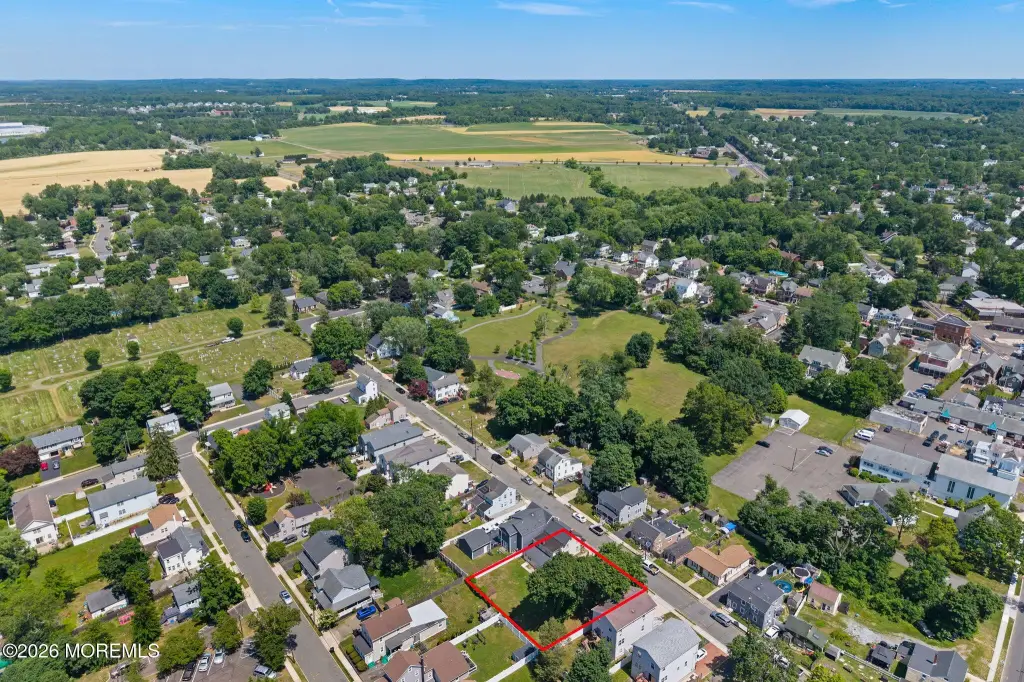
Located at 14-16 Hamilton Street in Allentown, NJ, the home is described as being in Historic Allentown Borough and within walkable distance to Main Street’s shops, parks, studios, and restaurants, based on the listing remarks. The seller notes the lot may be suitable for possible subdivision, subject to the buyer obtaining all required certifications.
This property can suit an owner-occupant looking to live in one unit while updating the other, or an investor seeking a duplex with two independently arranged units. Prospective buyers should independently verify any subdivision feasibility and confirm all required permits and certifications. The listing also indicates the buyer will need to complete due diligence, as well as address any housing contingency considerations identified by the seller.
Located at 14-16 Hamilton Street in Allentown, NJ, the home is described as being in Historic Allentown Borough and within walkable distance to Main Street’s shops, parks, studios, and restaurants, based on the listing remarks. The seller notes the lot may be suitable for possible subdivision, subject to the buyer obtaining all required certifications.
This property can suit an owner-occupant looking to live in one unit while updating the other, or an investor seeking a duplex with two independently arranged units. Prospective buyers should independently verify any subdivision feasibility and confirm all required permits and certifications. The listing also indicates the buyer will need to complete due diligence, as well as address any housing contingency considerations identified by the seller.
Key Highlights
- Potential duplex in Historic Allentown Borough with value‑add opportunity (sold strictly AS IS).
- Year built 1930 duplex on an expansive double lot with walkability to Main Street shops, parks, studios, and restaurants.
- Unit 1 offers 3BR and 1.5 baths across 2 stories with LR, DR, kit, and attic.
Financial Insights For Multifamily LT 5
Simulate Cap Rate and NOI
NOI Build-Up
- Vacancy
- income lost from leasable area expected to sit empty during the year — subtracted from gross rent.
- EGI (Effective Gross Income)
- gross rent minus vacancy losses — the realistic income before paying operating costs.
- OpEx (Operating Expenses)
- recurring costs to operate the property (property tax, insurance, utilities, maintenance, management) — excludes financing and capital improvements.
- NOI (Net Operating Income)
- income a property generates after operating costs but before financing and taxes.
| Component | $ | $/SF |
|---|---|---|
| Gross rent | $48.5k | $25.56 |
| − Vacancy | −$3.1k | −$1.65 |
| EGI | $45.3k | $23.91 |
| − OpEx | −$13.6k | −$7.17 |
| NOI | $31.7k | $16.74 |
1,896 SF · lease $25.56/SF/yr · vacancy 6.46% · expense 30.00%
Alternative Uses
Best Use
Multifamily LT 5
$453.3K
$396.7K – $528.9K
NOI $31,732 @ 7.0% cap · market cap 7.05%
Second Best
Apartment 5plus
$416.5K
$364.5K – $486.0K
NOI $29,157 @ 7.0% cap · market cap 6.48%
Theoretical Best
Office A
$495.1K
$433.2K – $577.6K
NOI $34,656 @ 7.0% cap · market cap 7.70%
Zoning and permitted uses should be independently verified with authorities.
Property Analytics
Property Profile
Location Intelligence
Current Use




Frequently Asked Questions
What type of property is this?
Duplex - Duplex with two distinct unit layouts on a double lot, offered for buyers seeking a value-add renovation.
Where is this duplex located?
The property is located at 14-16 Hamilton Street Allentown, NJ.
What is the asking price?
The asking price for this property is $450,000.
What are key features of this property?
This property features: Potential duplex in Historic Allentown Borough with value‑add opportunity (sold strictly AS IS).; Year built 1930 duplex on an expansive double lot with walkability to Main Street shops, parks, studios, and restaurants.; Unit 1 offers 3BR and 1.5 baths across 2 stories with LR, DR, kit, and attic.


