Highway-Fronted Flex
For Sale
$374,900
13879 Us-160, Forsyth, MO 65653
Commercial Sale, Forsyth, MO
Property Size4,000 SF
Lot Size0.80 Acres
Price / SF$93.73
Days on Market47
Property Features for 13879 Us-160
General Information
Property type
Commercial Sale
Property subtype
Other
Bathrooms
2
Full bathrooms
2
Rooms
Bathroom 1, Bathroom 2
Lot features
Level
Directions
From Branson: take 65 to F Hwy, Follow F Hwy and stay straight to contiue East on US-160, to property on Left. From Forsyth: head North out of town on US-160, (pass the JCT of HWY 176 for Rockaway) property is on the Right at 13879 US 160
Standard status
Active
APN
04-4.0-20-001-003-004.000
Lot size
0.80 Acres
Taxes and HOA fees
Tax Year
2026
Utilities
Utilities
Electricity Available
Heating system
Propane (Heating), Forced Air
Cooling system
Central Air, Electric
Amenities
boardroom
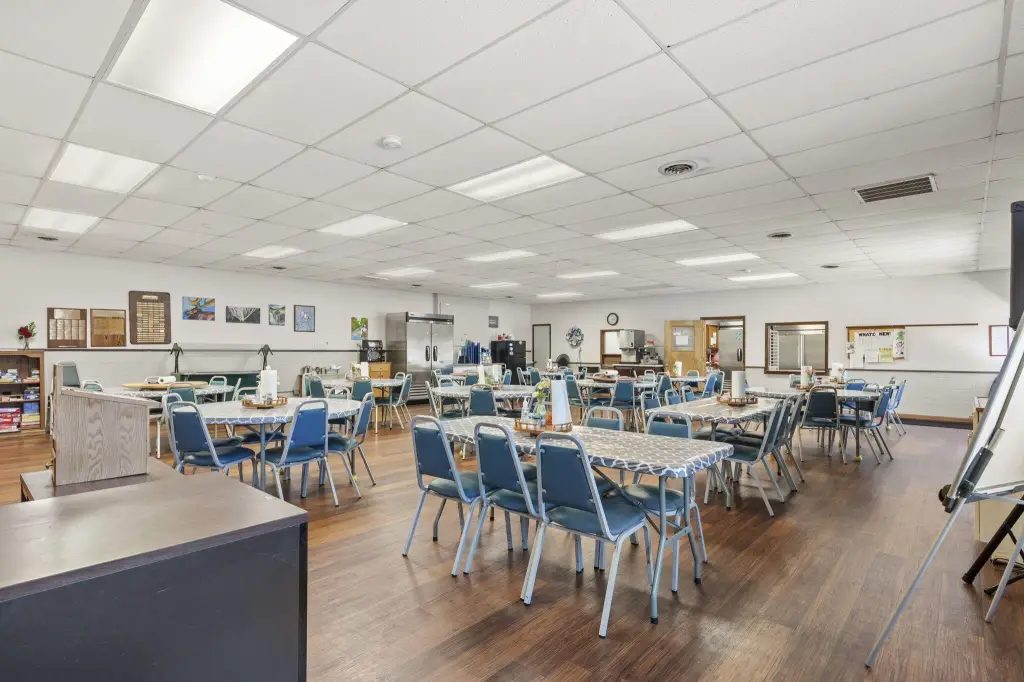
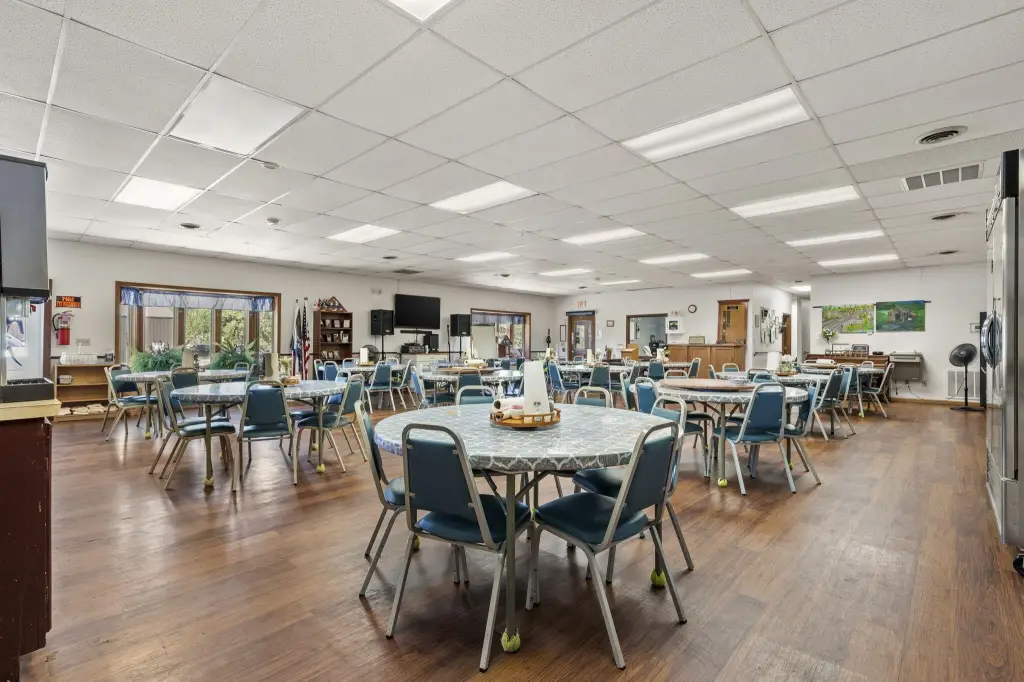
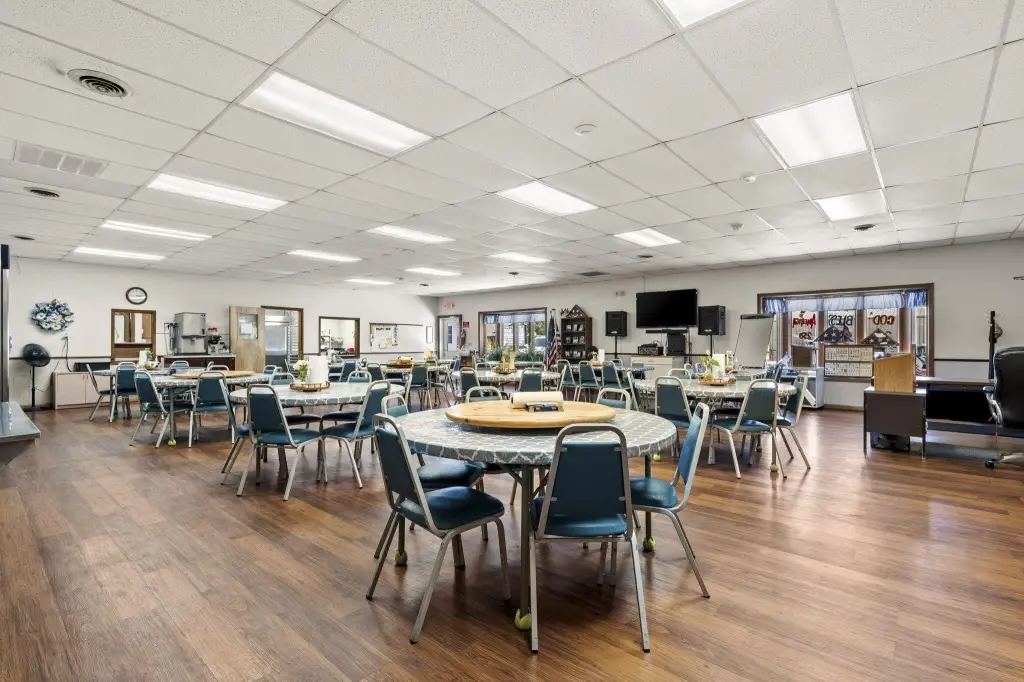
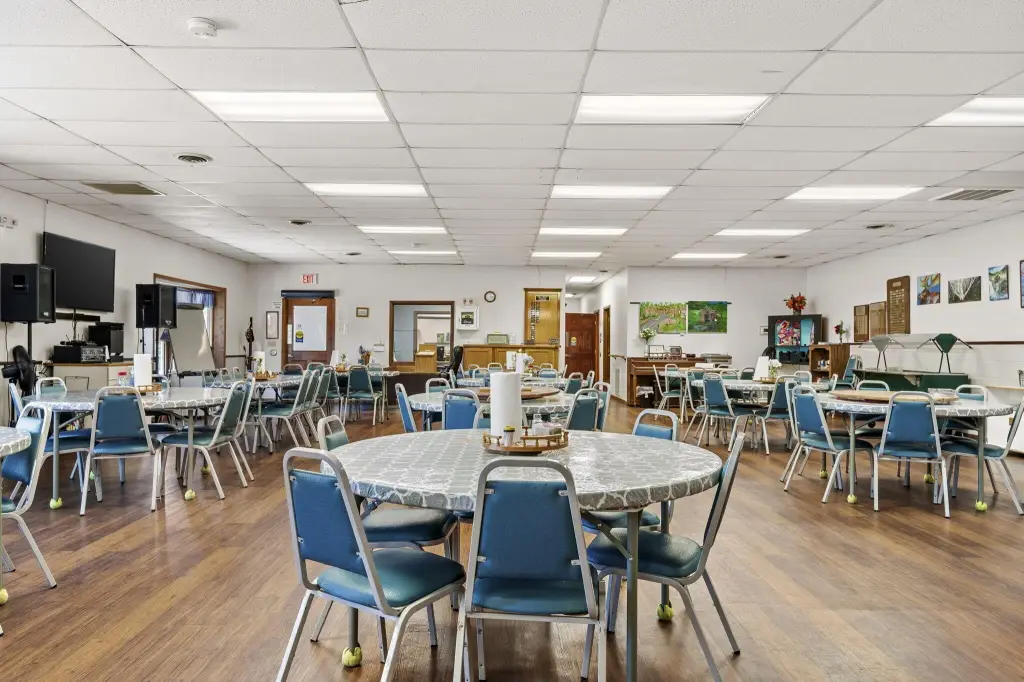
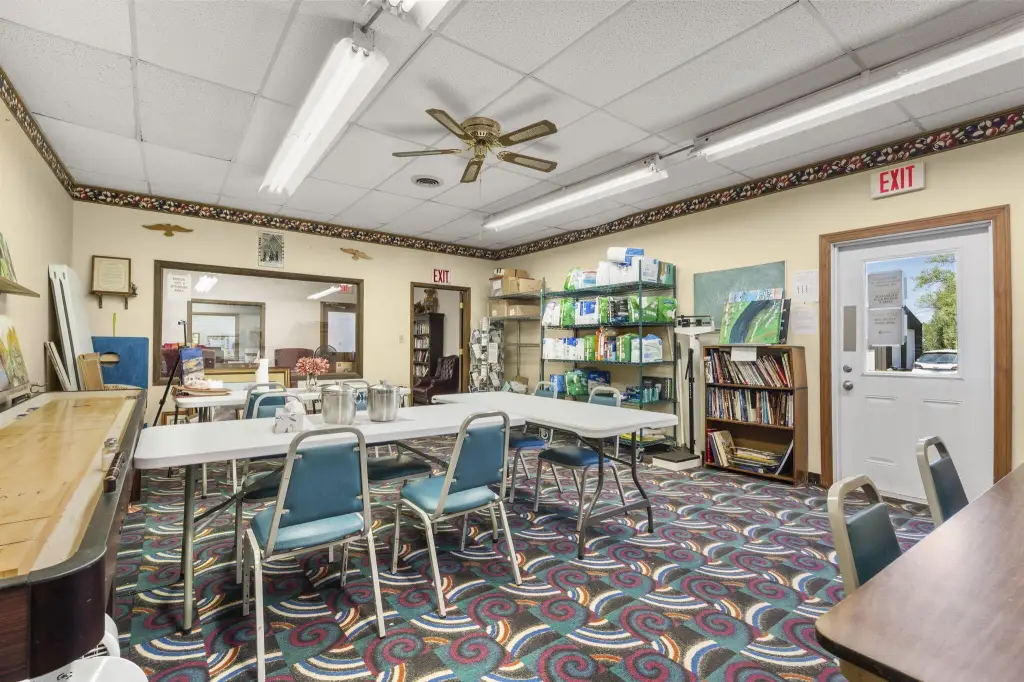
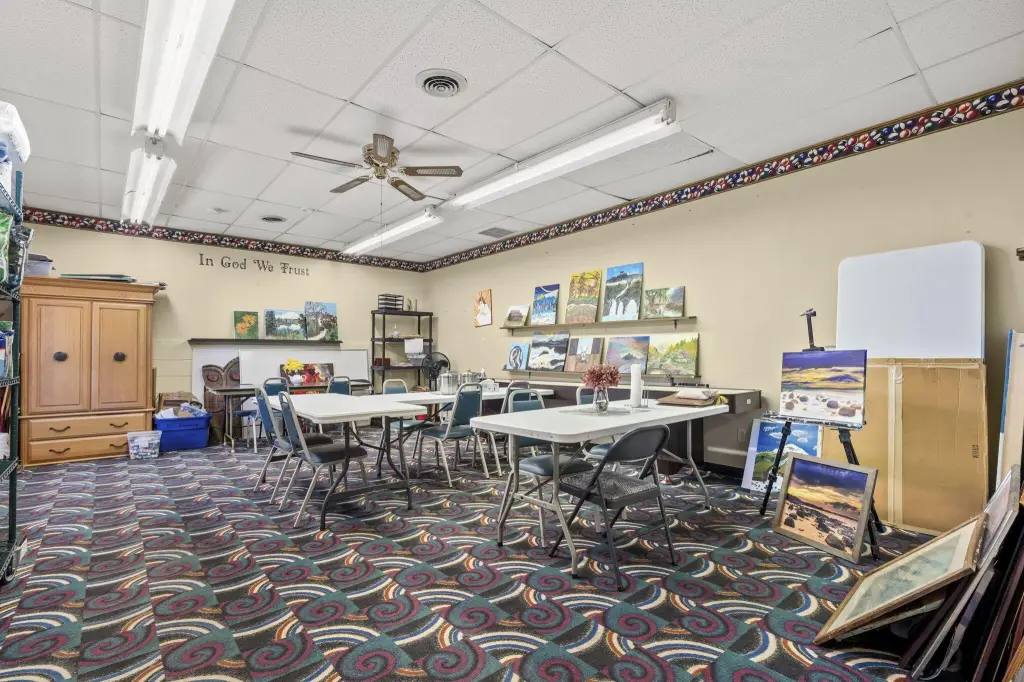
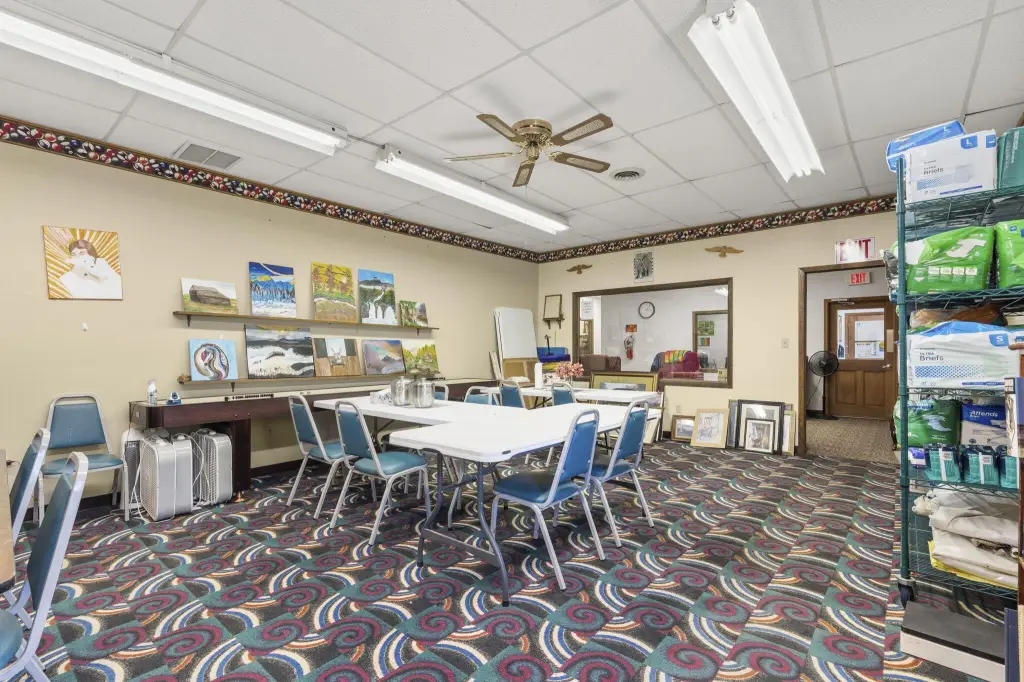
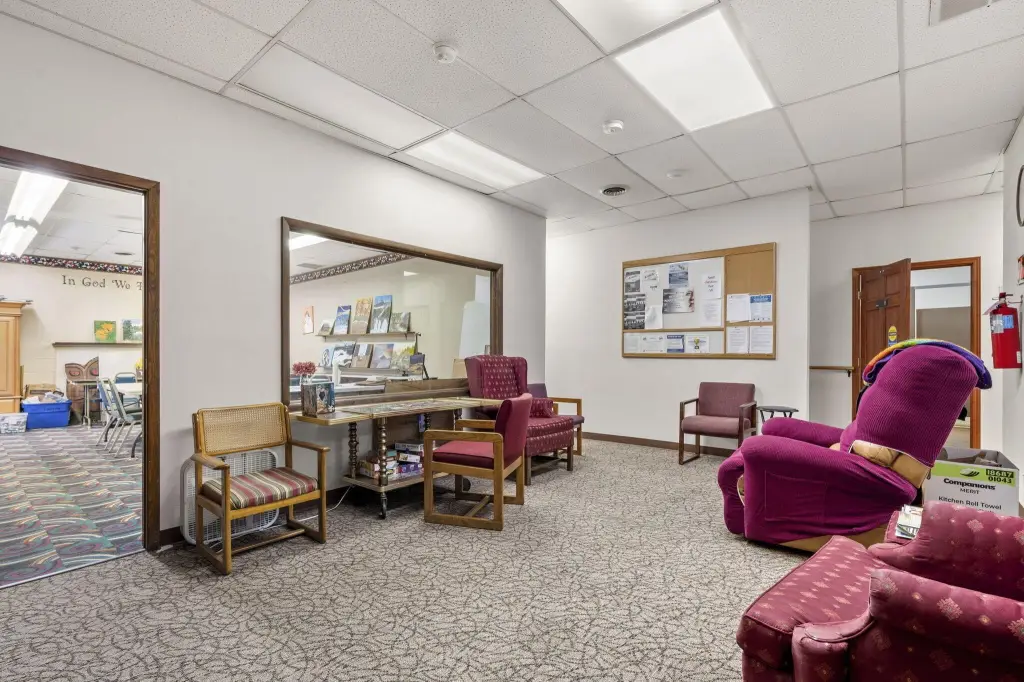
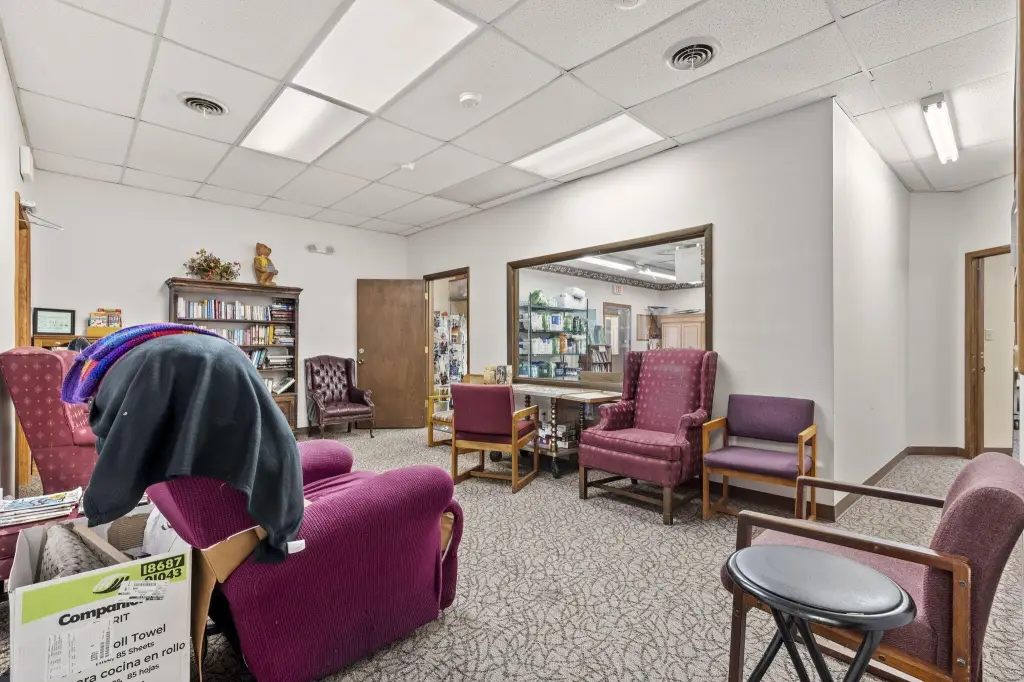
expansive open common/meeting areas
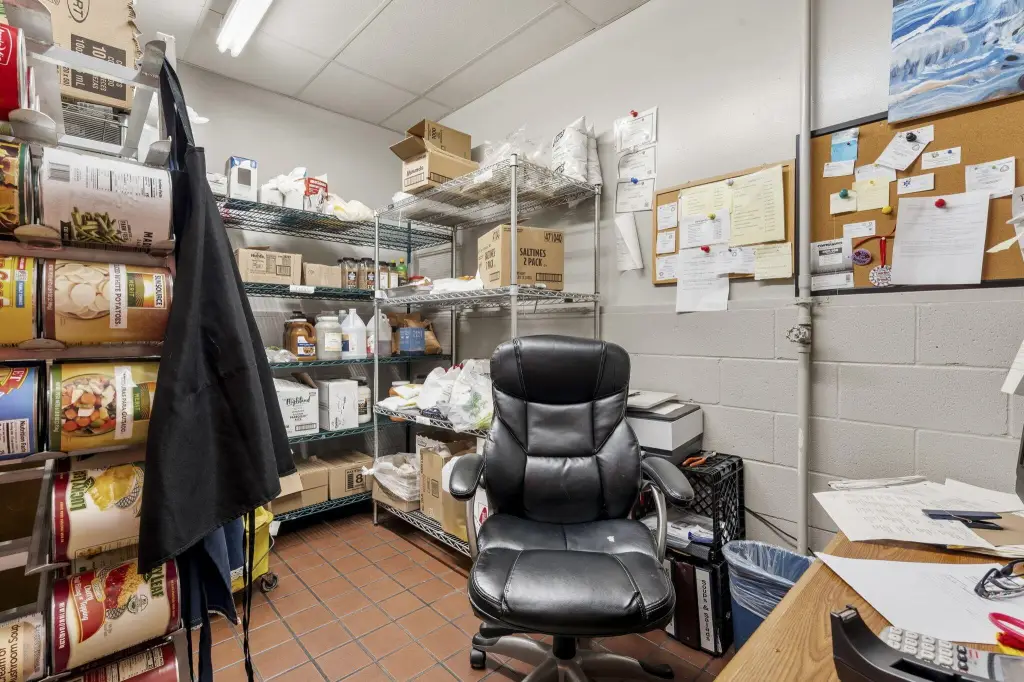
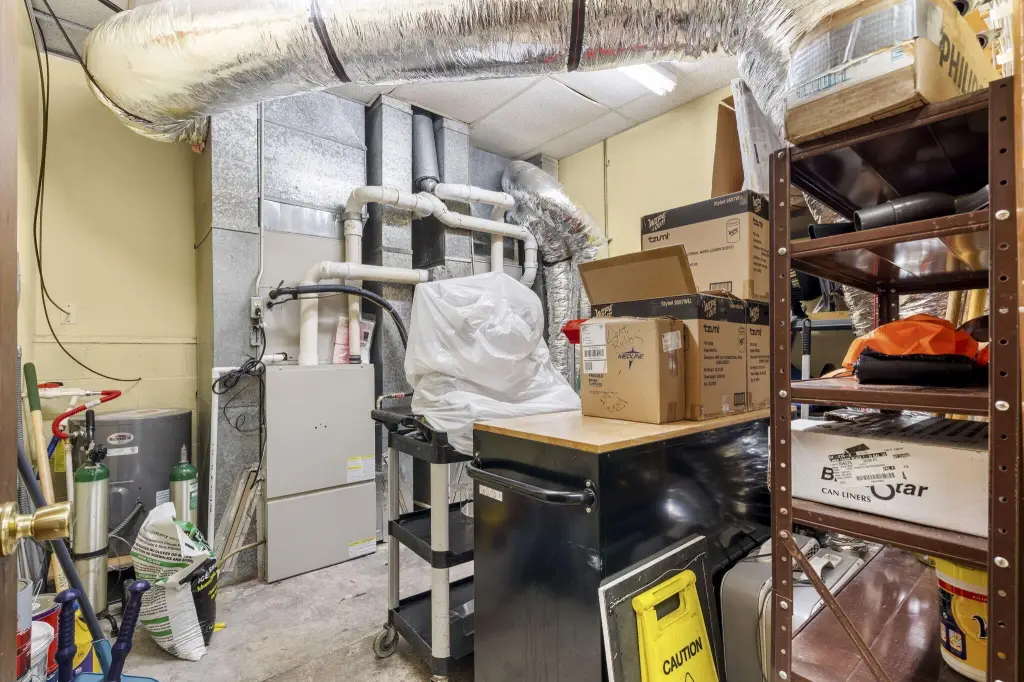
storage
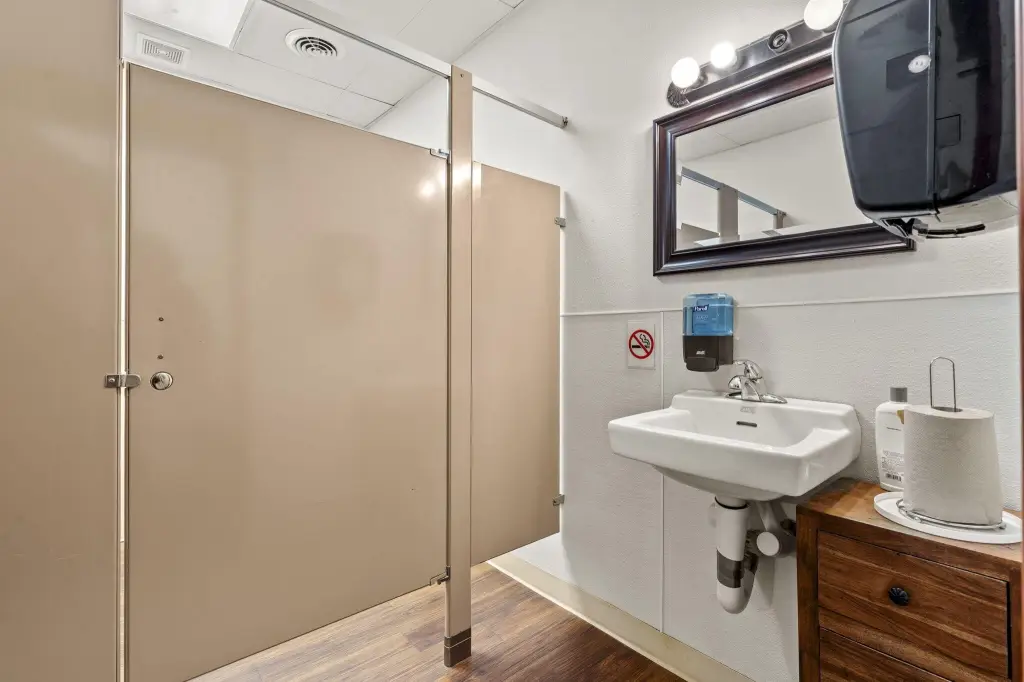
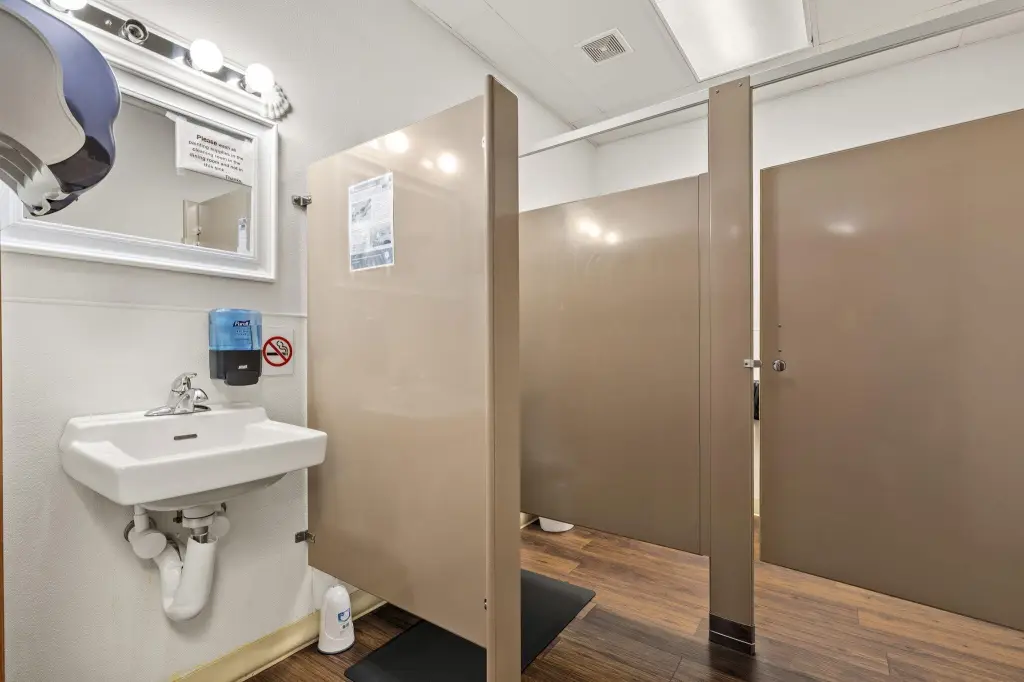
multiple restroom facilities
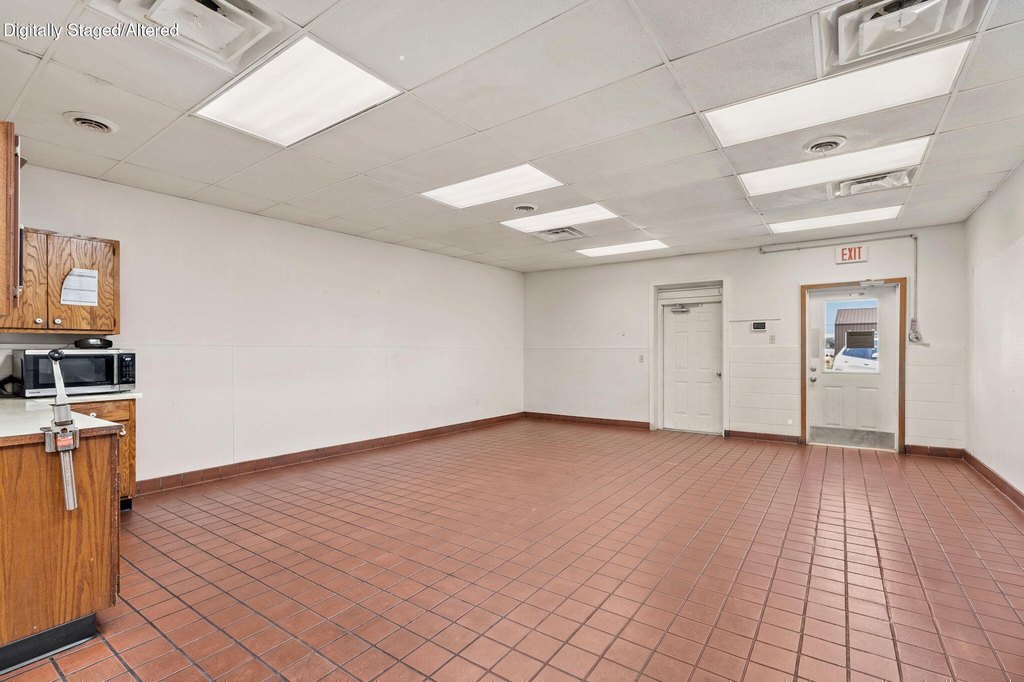
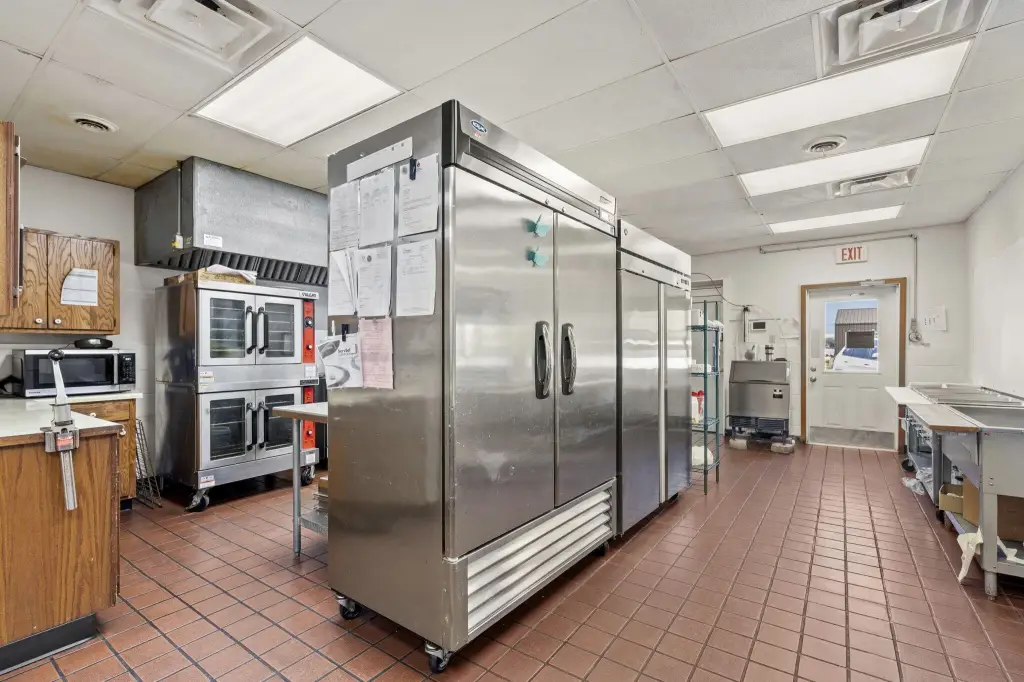
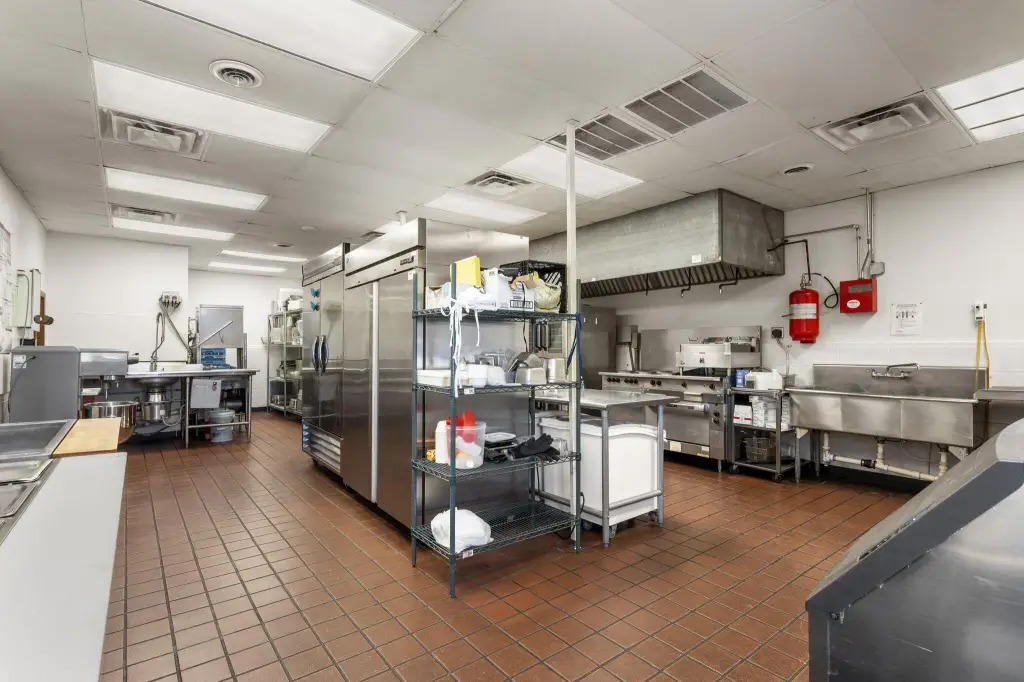
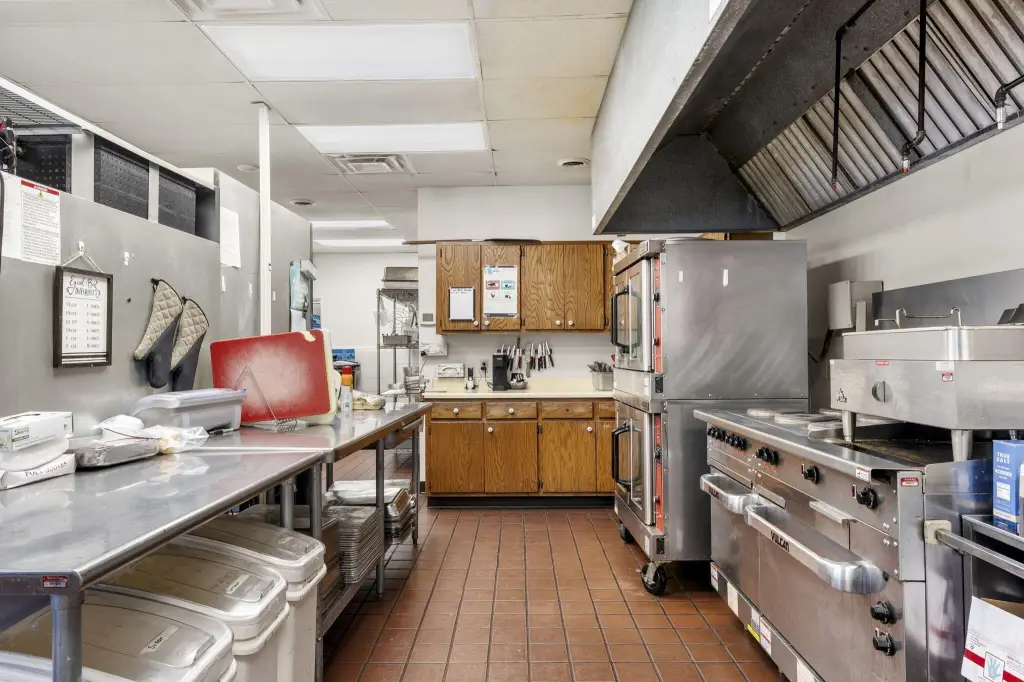
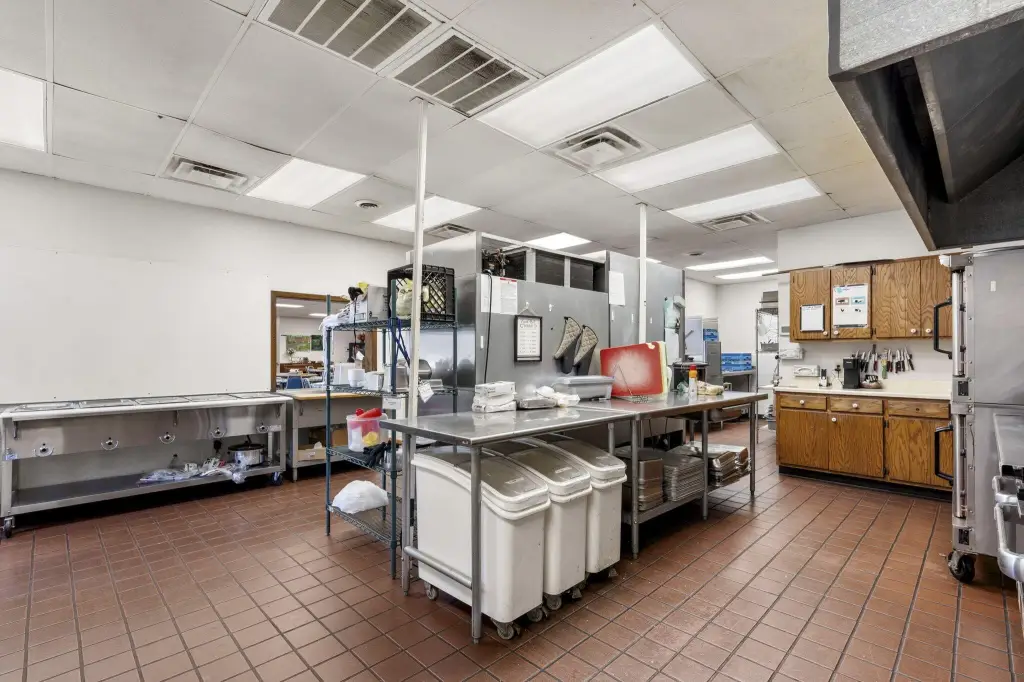
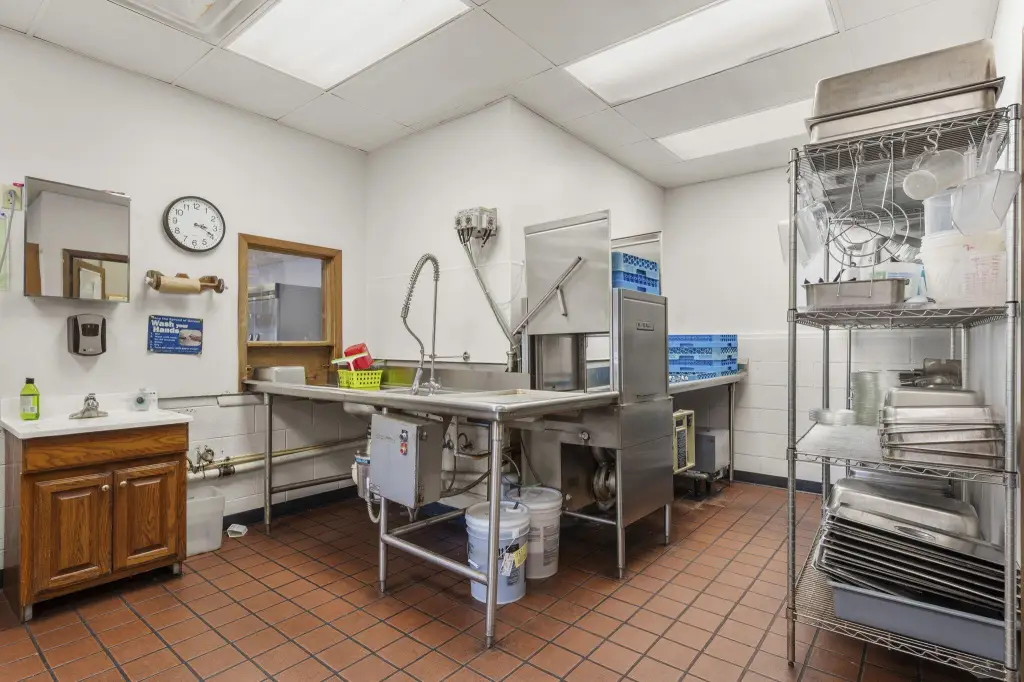
large commercial kitchen space
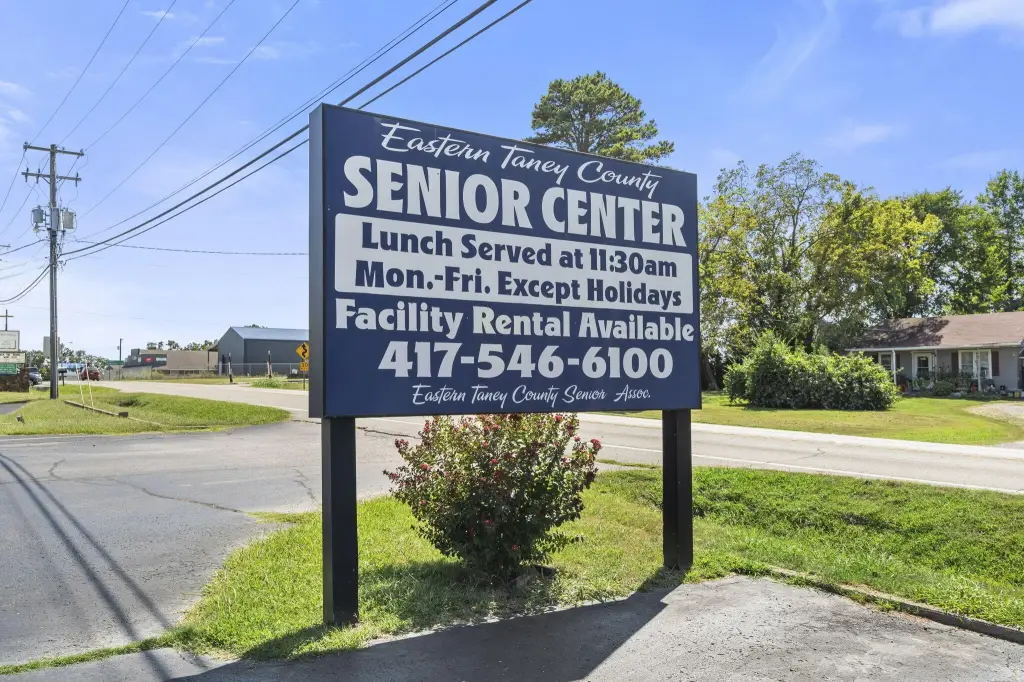
prominent roadside signage
Building Details
Year built
1980
Roof type
Metal
Listing Agency:
Red Cedar Land Company LLC
(417) 860-0896
Listed By:
Mandi Rogers · License #2015034246
(620) 377-5022
Added: Aug 22
Changed: Sep 21
Last Checked: Oct 7 at 1:06AM
MLS# 60332109
Copyright © 2026 Southern Missouri Regional MLS, LLC (SOMO). All rights reserved. All information provided by the listing agent/broker is deemed reliable but is not guaranteed and should be independently verified.
Investment Insights
Based on property information with market context.
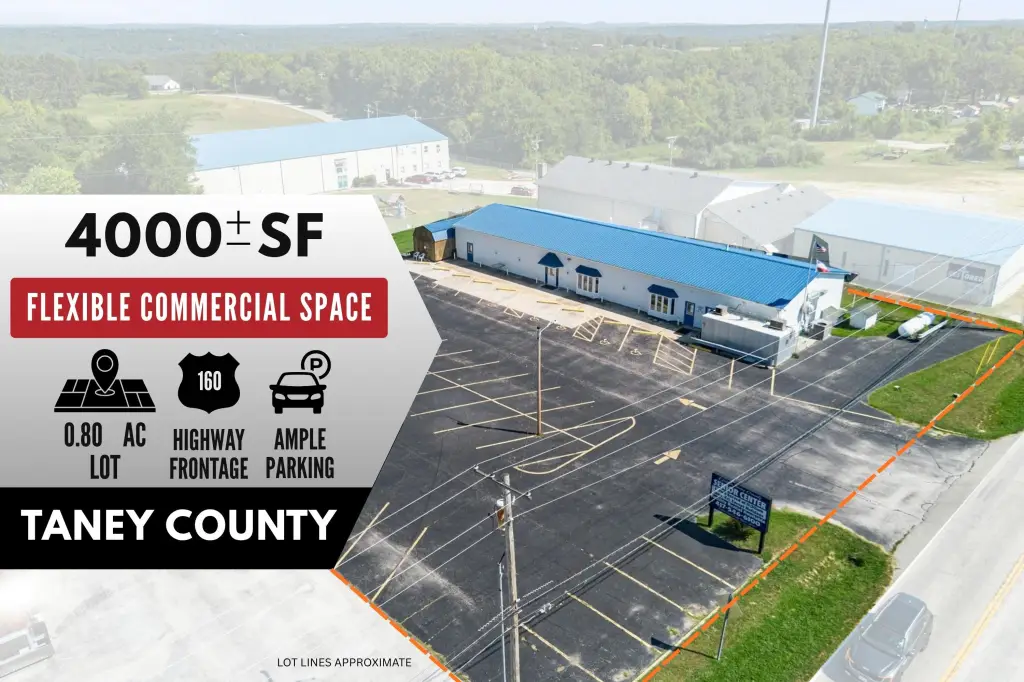
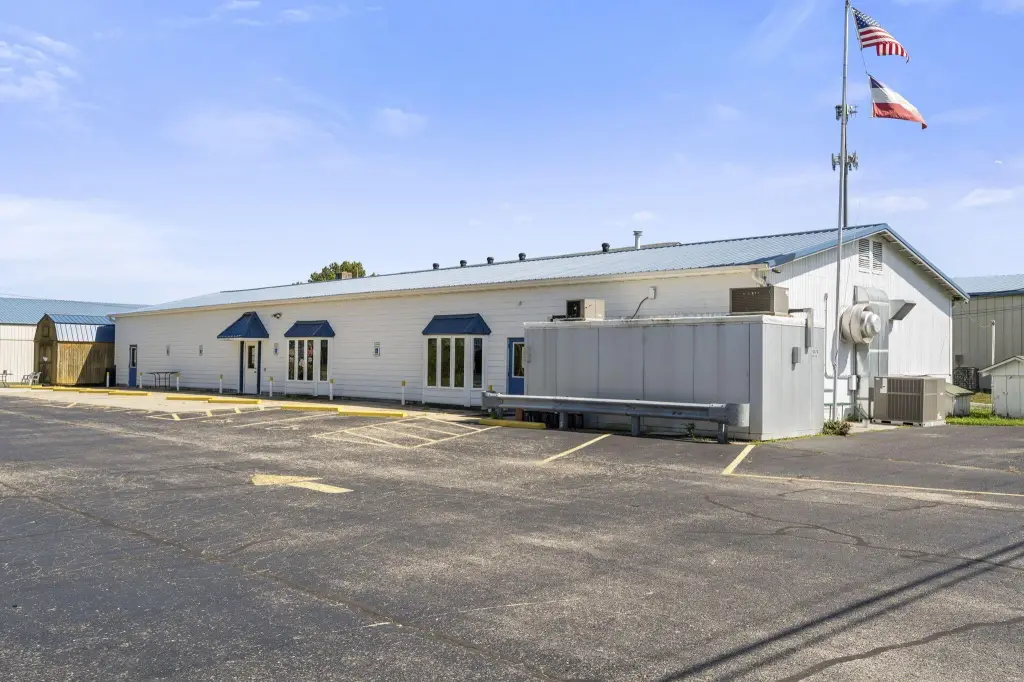
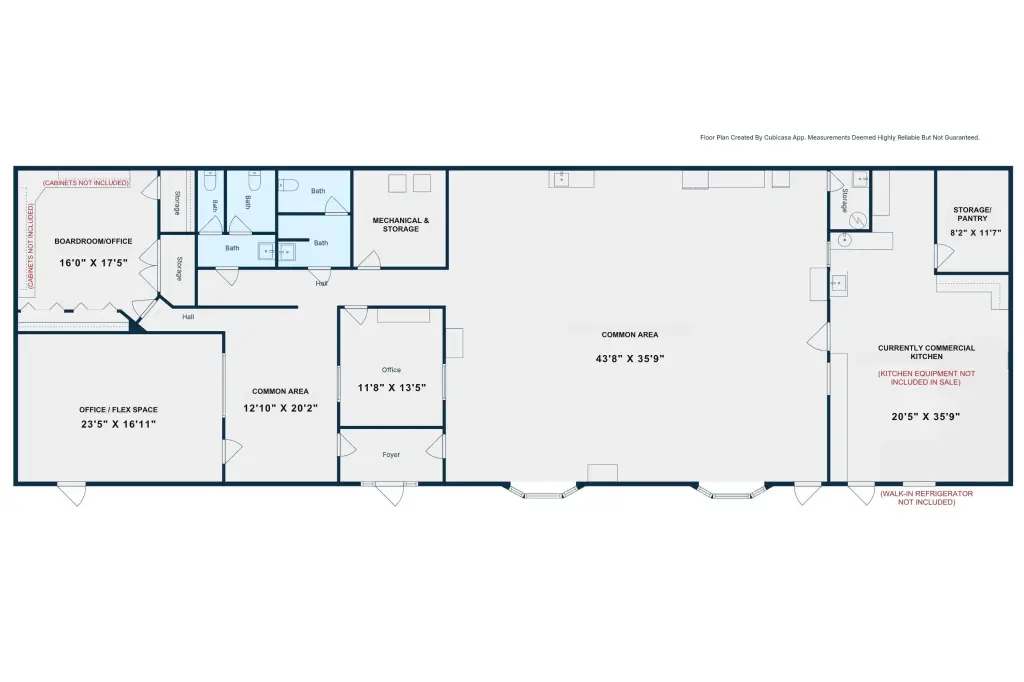
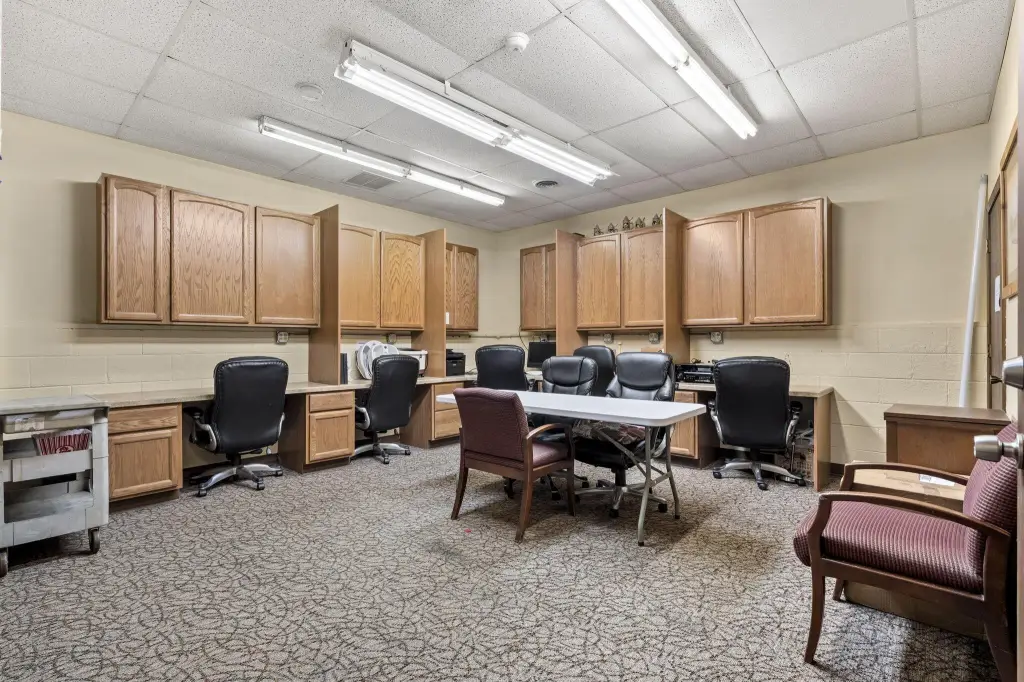
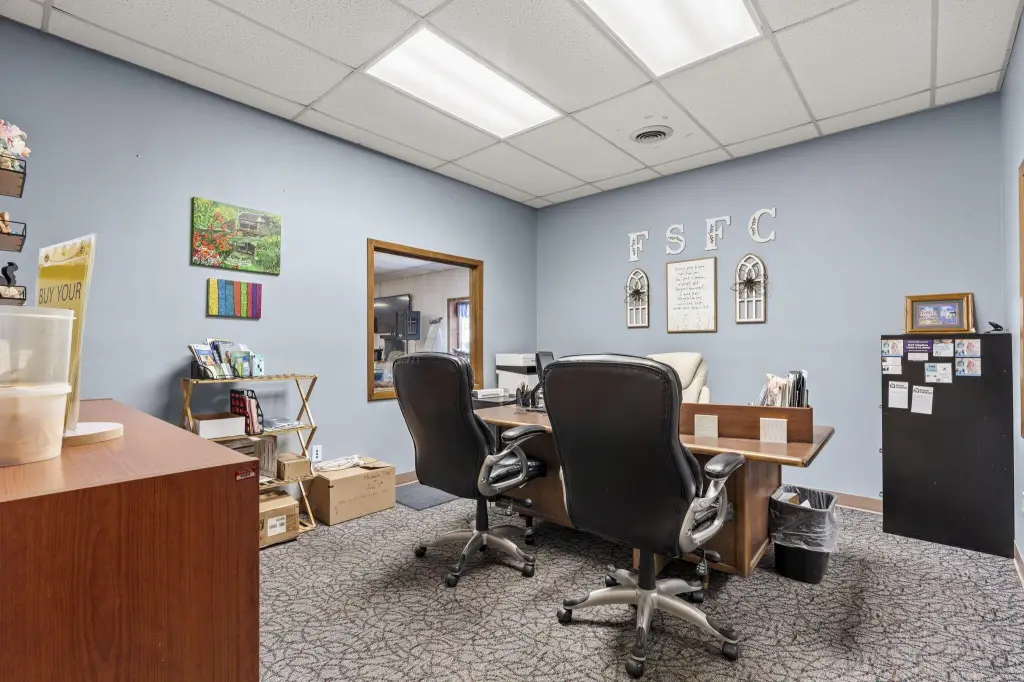
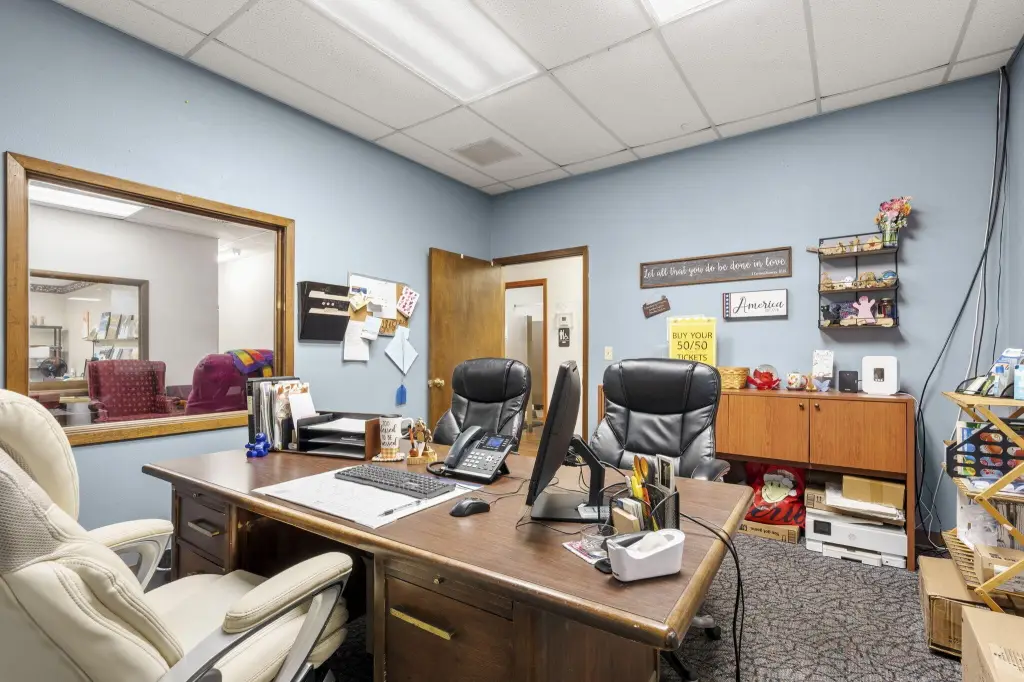
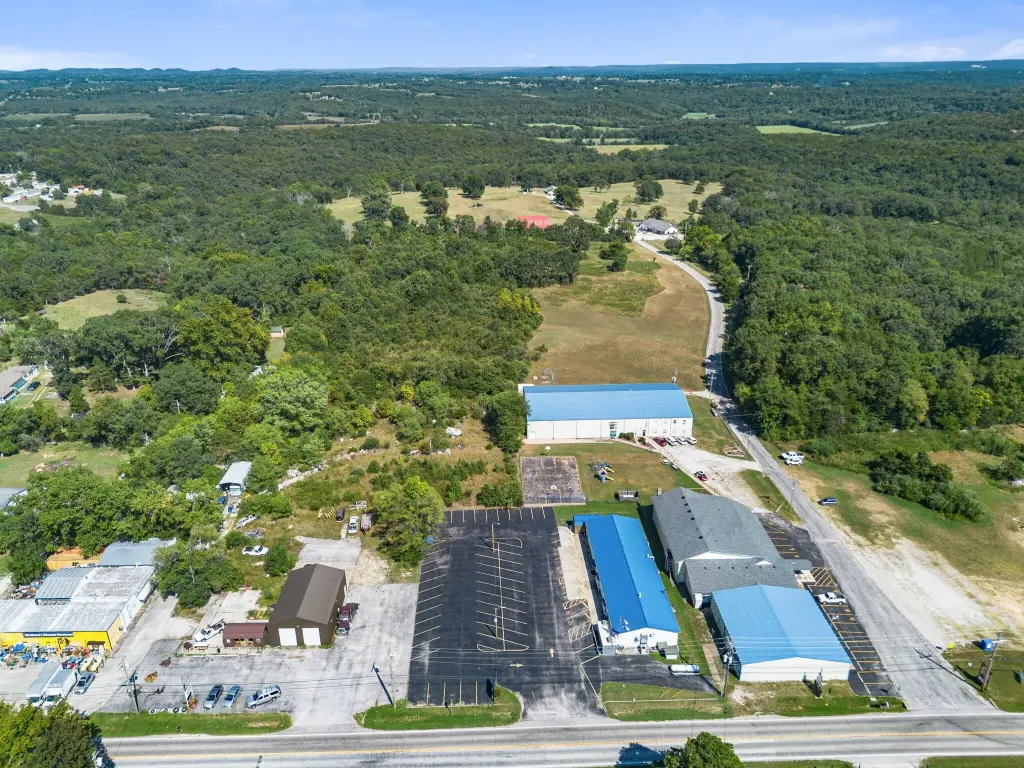
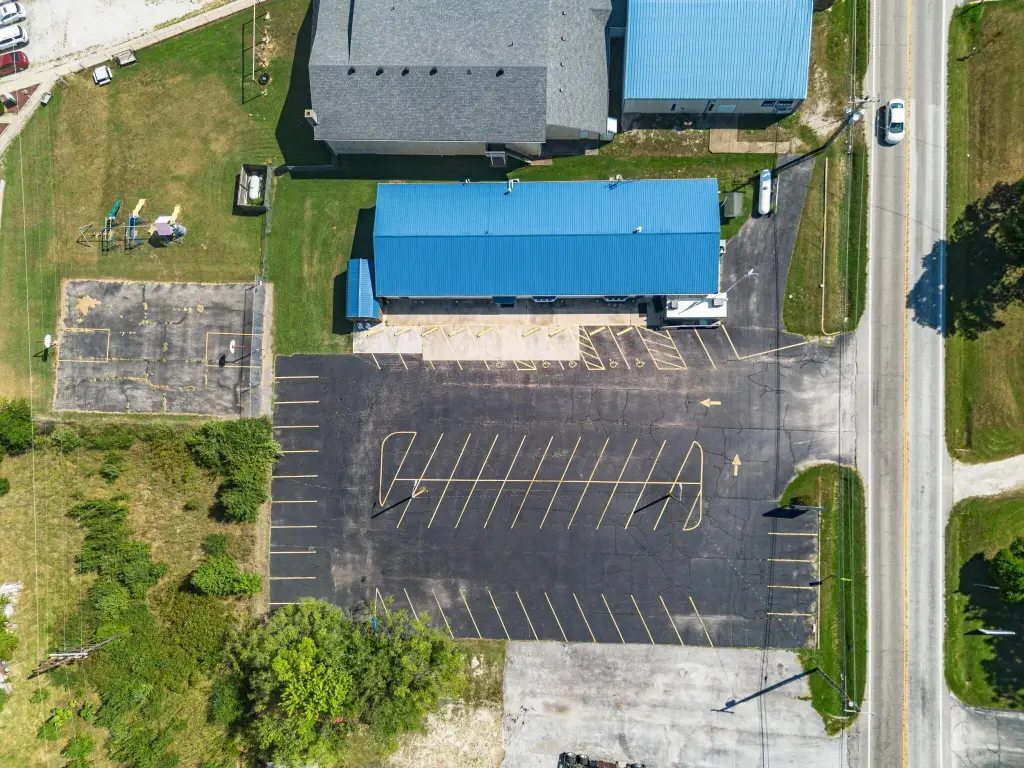
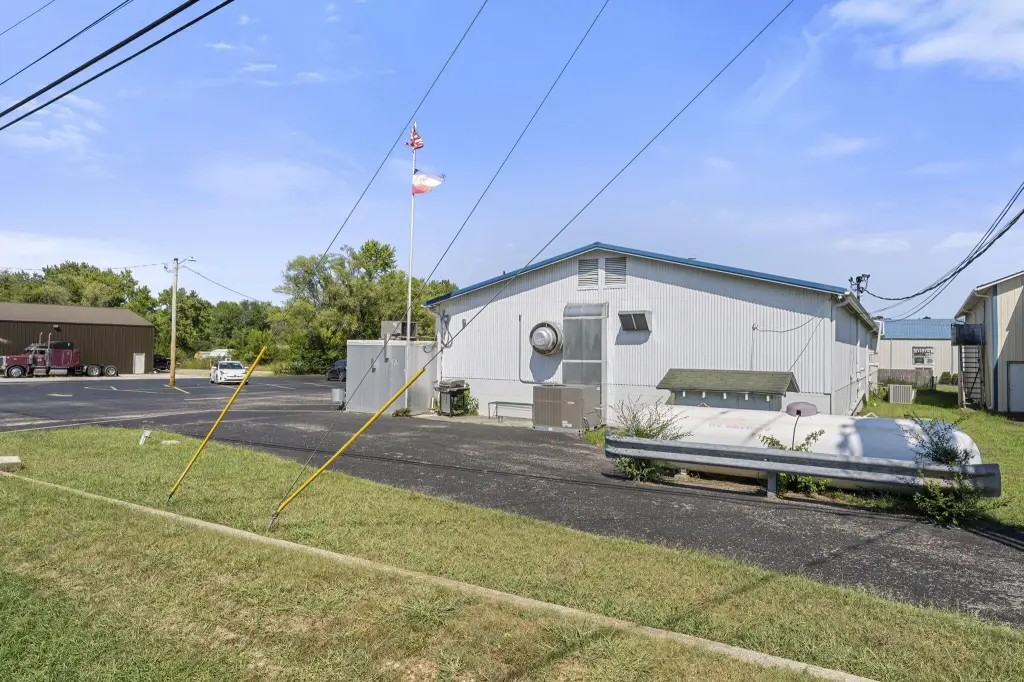
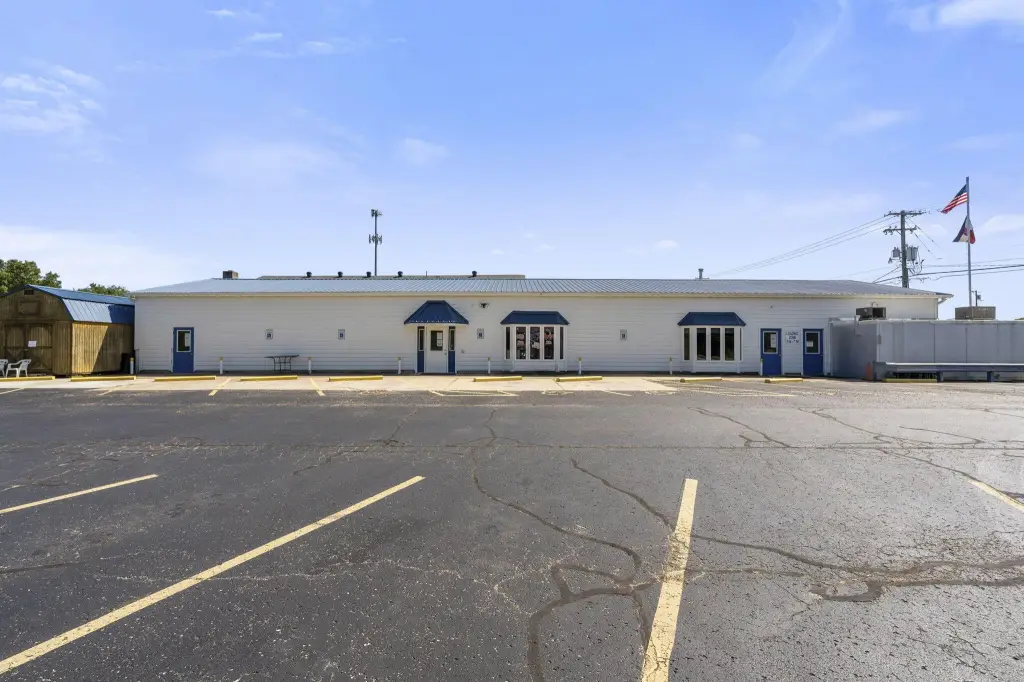
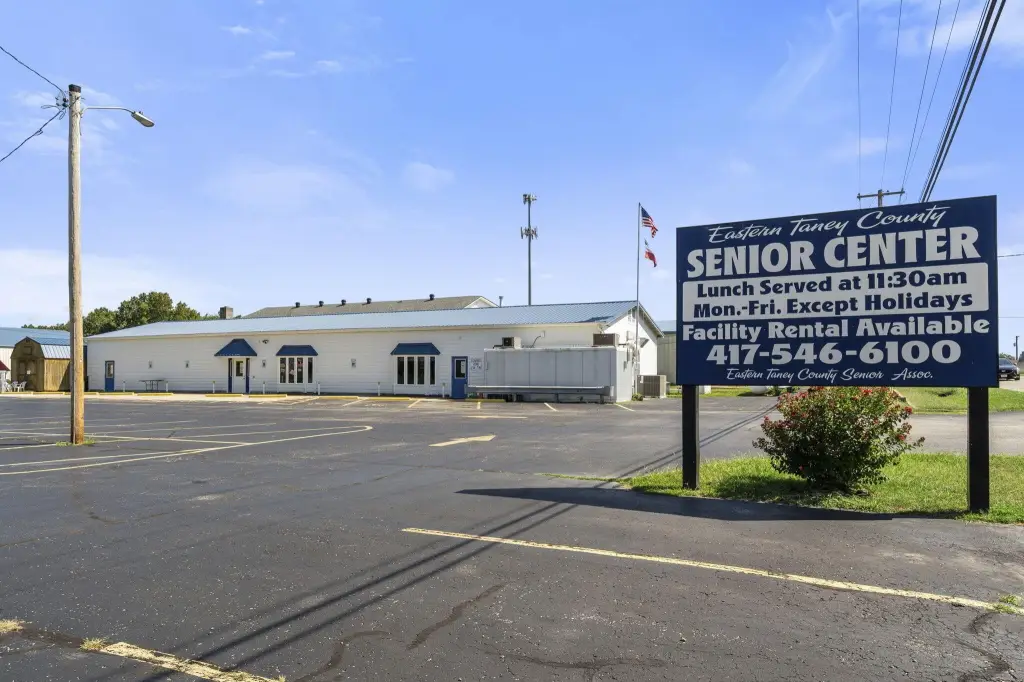
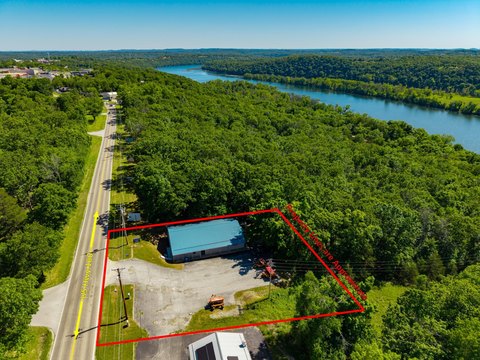
This flex-space property includes an approximately 4,000-square-foot building on 0.8+/- acres along US Highway 160. The interior combines offices, flexible work areas, a boardroom, open meeting space, storage, multiple restrooms, and a substantial commercial kitchen area. Four exterior entrances support separate access points within the building. The largest open room measures approximately 43'8'' x 35'9''.
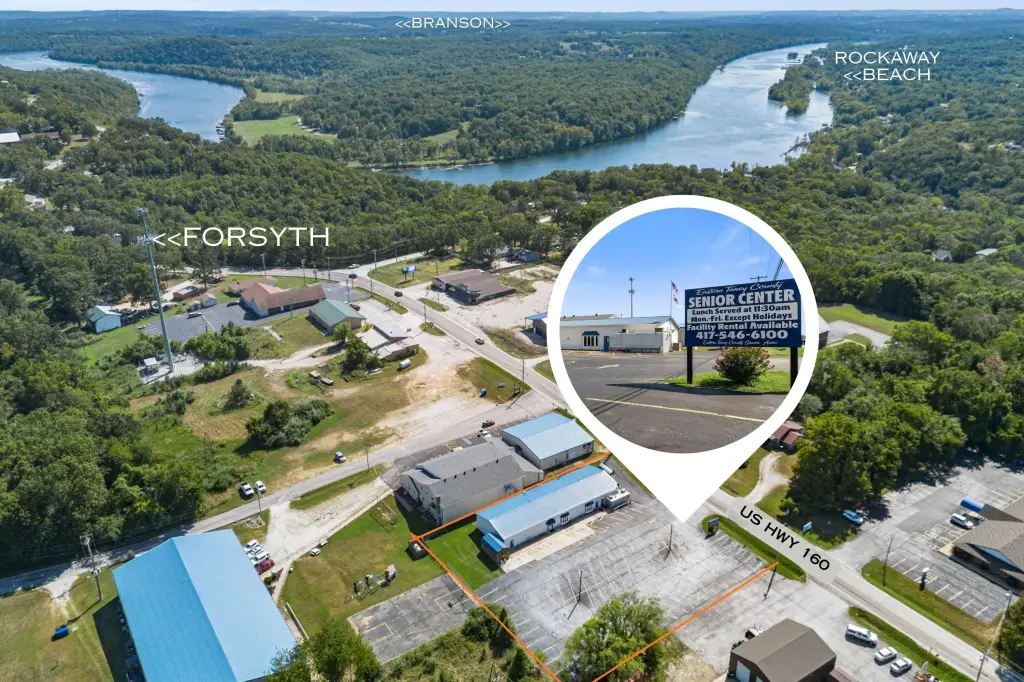
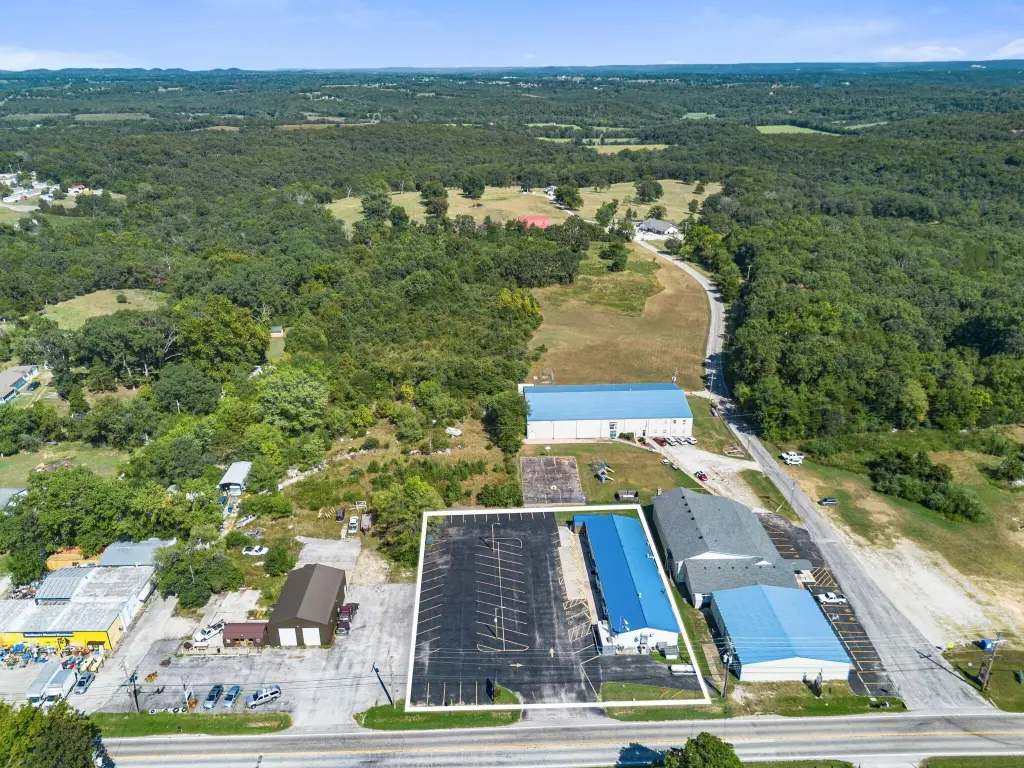
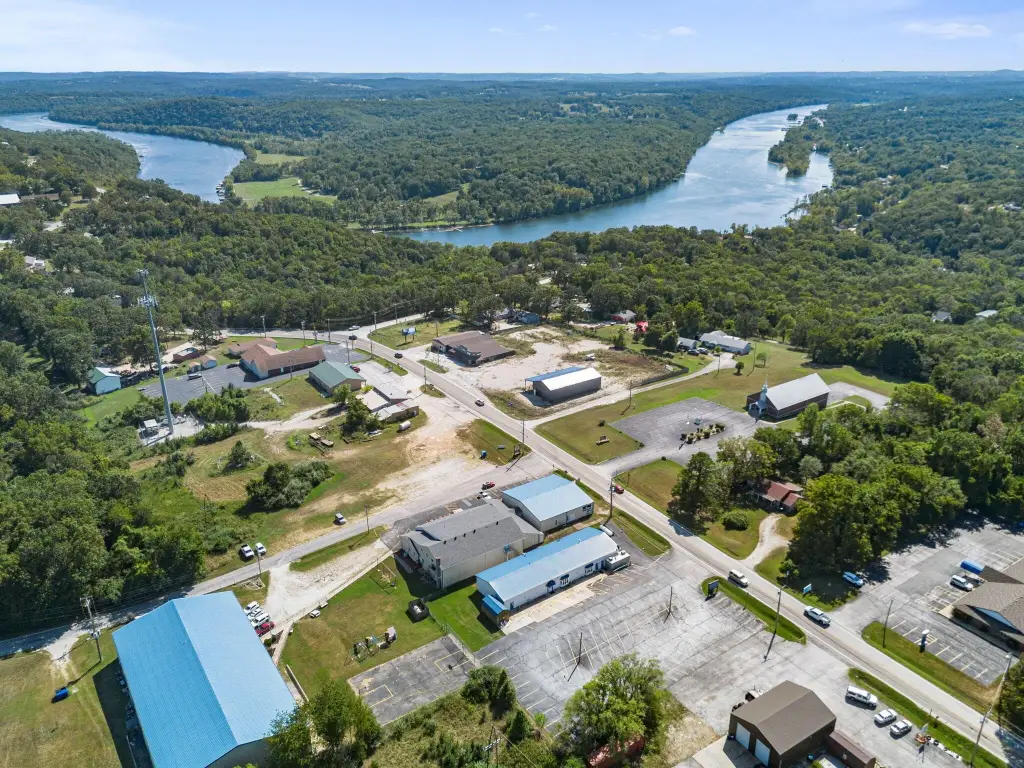
The site is outside Forsyth city limits and includes paved parking, roadside signage, and highway frontage. The building dates to 1980 and has a metal roof, HVAC improvements, and a well pump installed in 2026. Private well and septic currently serve the property, with public sewer expansion planned along the highway corridor. Kitchen equipment, refrigerators/freezers, and other specified equipment are excluded from the sale.
The site is outside Forsyth city limits and includes paved parking, roadside signage, and highway frontage. The building dates to 1980 and has a metal roof, HVAC improvements, and a well pump installed in 2026. Private well and septic currently serve the property, with public sewer expansion planned along the highway corridor. Kitchen equipment, refrigerators/freezers, and other specified equipment are excluded from the sale.
Key Highlights
- Approximately 4,000 sq ft building on 0.8+/- acres
- US Highway 160 frontage with prominent roadside signage
- Four separate exterior entrances
Financial Insights
Estimated NOI and Cap Rate
NOI / Yr
$31,674
Cap Rate
8.45%
Suggested Prices Based on Cap Rates
Cap Rate 5%
$633,480
$633.5K
Cap Rate 7%
$452,486
$452.5K
Cap Rate 9%
$351,933
$351.9K
Market Conditions
NOI Build-Up for 4,000 SF
Gross rent
$51.8K $12.96/SF
− Vacancy
−$3.1K −$0.78/SF
EGI
$48.7K $12.18/SF
− OpEx
−$17.1K −$4.26/SF
NOI
$31.7K $7.92/SF
Area
Taney County, MO
Vacancy
6.00%
Lease Rate
$12.96 /SF/Yr
Expense Ratio
35.00%
Simulate Cap Rate and NOI
Suggested Prices Based on Cap Rates
Cap Rate 5%
$633,480
Cap Rate 7%
$452,486
Cap Rate 9%
$351,933
Alternative Uses
Best Use
Office B
$591.4K
$517.5K – $690.0K
NOI $41,400 @ 7.0% cap · market cap 11.04%
Second Best
Flex RnD
$452.5K
$395.9K – $527.9K
NOI $31,674 @ 7.0% cap · market cap 8.45%
Theoretical Best
Office A
$781.7K
$684.0K – $912.0K
NOI $54,720 @ 7.0% cap · market cap 14.60%
Zoning and permitted uses should be independently verified with authorities.
Property Analytics
Unlock full access to Insights
Subscribe to Realmo Intelligence
Open Analytics
Current Use
Lease Details
Yes
Highway access
Yes
Paved road access
Yes
Utilities to site
Location Intelligence
Trade Area within ½ mile
67
Businesses Nearby
Well-served
Demand for This Use
Explore this area
Business Placement
Demographics for 65653, MO
5,806
Population
2,894
Households
2
Avg Household Size
50
Median Age
20%
College-Educated
92%
High-School Grad
63.8 sq mi
ZIP Area
91
Density / Sq Mi
$47,929
Median Household Income
$34,470
Median Earnings
$719
Median Rent
$181,400
Median Home Value
Check the figures for this property
Cap Rate, Value Estimation, Potential NOI and more
View Realmo Analytics
Market
Vacancy Rate% for Office in Midwest region

Questions? Ask Rey
Realmo’s AI knows this listing — price, zoning, demand, history. Ask anything.

Frequently Asked Questions
What type of property is this?
Flex space - Multi-room commercial building with separate entrances, offices, meeting areas, storage, restrooms, and a commercial kitchen space.
Where is this flex space located?
The property is located at 13879 Us-160 Forsyth, MO.
What is the asking price?
The asking price for this property is $374,900.
What are key features of this property?
This property features: Approximately 4,000 sq ft building on 0.8+/- acres; US Highway 160 frontage with prominent roadside signage; Four separate exterior entrances



