Daytona Beach Italian Restaurant
For Sale
Contact for pricing
136 S Atlantic Avenue, Daytona Beach, FL 32118
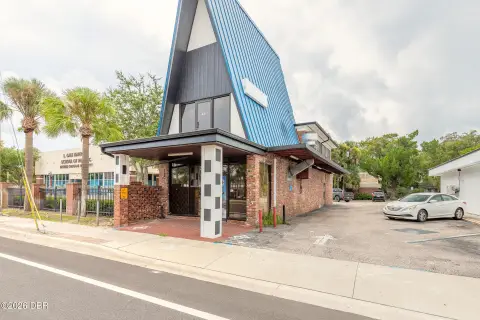
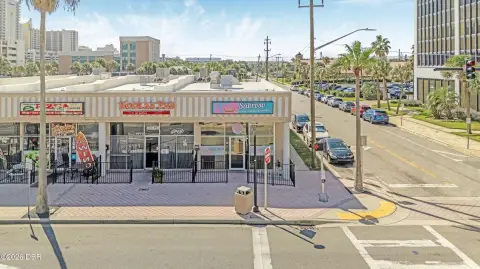
Established Italian restaurant steps from the ocean in Daytona Beach.
Property Size2,219 SF
Price / SF$180.04
Days on Market1131
Property Features for 136 S Atlantic Avenue
General Information
Standard status
Active
Size
2,219 SF
Property subtype
Business for Sale, Retail
Building Details
Year Built
1984
Stories
1
Listing Agency:
FAME Real Estate LLC
Listed By:
Mike Khorassani
(386) 334-2226
Source:
Crexi
Added: Sep 5, 2023
Changed: Oct 8
Last Checked: Oct 7 at 11:28AM
Displayed information is deemed reliable but is not guaranteed and should be independently verified. All listing content including descriptions, pricing, images are the copyrighted material of FAME Real Estate LLC
Investment Insights
Based on property information with market context.
This is an opportunity to own a well-established Italian restaurant located steps away from the ocean in Daytona Beach. The business offers authentic Italian cuisine in a warm and inviting atmosphere, benefitting from its prime location in a bustling tourist area with high visibility. The property features a fully equipped kitchen with two walk-in freezers. The dining area encompasses 1880 square feet with additional outside seating suitable for both intimate dinners and larger gatherings. The property has a 3 year lease with option to renew, and includes two full bars and a liquor license to convey with the sale. The property size is 2219 square feet.
Key Highlights
- Prime location steps from the ocean in Daytona Beach with high visibility and heavy tourist traffic.
- Thriving, well‑established Italian restaurant business with an established reputation.
- Liquor license included with the sale.
Financial Insights
Estimated NOI and Cap Rate
NOI / Yr
$33,696
Cap Rate
8.43%
Suggested Prices Based on Cap Rates
Cap Rate 5%
$673,920
$673.9K
Cap Rate 7%
$481,371
$481.4K
Cap Rate 9%
$374,400
$374.4K
Market Conditions
NOI Build-Up for 2,219 SF
Gross rent
$48.7K $21.96/SF
− Vacancy
−$3.8K −$1.71/SF
EGI
$44.9K $20.25/SF
− OpEx
−$11.2K −$5.06/SF
NOI
$33.7K $15.19/SF
Area
Volusia County, FL
Vacancy
7.80%
Lease Rate
$21.96 /SF/Yr
Expense Ratio
25.00%
Simulate Cap Rate and NOI
Suggested Prices Based on Cap Rates
Cap Rate 5%
$673,920
Cap Rate 7%
$481,371
Cap Rate 9%
$374,400
Alternative Uses
Best Use
Specialty Retail
$481.4K
$421.2K – $561.6K
NOI $33,696 @ 7.0% cap · market cap 8.43%
Second Best
—
—
no second resolved use
Theoretical Best
Office A
$654.3K
$572.5K – $763.3K
NOI $45,800 @ 7.0% cap · market cap 11.46%
Zoning and permitted uses should be independently verified with authorities.
Property Analytics
Unlock full access to Insights
Subscribe to Realmo Intelligence
Open Analytics
Current Use
Location Intelligence
Trade Area within ½ mile
750
Businesses Nearby
55k
Monthly Visits Nearby
Under-served
Demand for This Use
Explore this area
Business Placement
Foot Traffic Nearby
Dining 50%
Shops & Services 43%
Hotels & Casinos 7%
Joe's Crab Shack
Dining
19,572 visits/mo
0.3 miles
7-Eleven
Shops & Services
9,090 visits/mo
0.3 miles
7-Eleven
Shops & Services
7,013 visits/mo
0.2 miles
Circle K
Shops & Services
4,699 visits/mo
0.4 miles
Domino's Pizza
Dining
4,599 visits/mo
0.5 miles
Demographics for 32118, FL
17,906
Population
16,390
Households
1.1
Avg Household Size
58
Median Age
31%
College-Educated
94%
High-School Grad
4.2 sq mi
ZIP Area
4,263
Density / Sq Mi
$60,418
Median Household Income
$36,153
Median Earnings
$1,283
Median Rent
$339,500
Median Home Value
Check the figures for this property
Cap Rate, Value Estimation, Potential NOI and more
View Realmo Analytics
Market
Vacancy Rate% for Retail in South region

Questions? Ask Rey
Realmo’s AI knows this listing — price, zoning, demand, history. Ask anything.





Frequently Asked Questions
What type of property is this?
Conventional restaurant - Established Italian restaurant steps from the ocean in Daytona Beach.
Where is this conventional restaurant located?
The property is located at 136 S Atlantic Avenue Daytona Beach, FL.
What is the asking price?
The asking price for this property is $399,500.
What are key features of this property?
This property features: Prime location steps from the ocean in Daytona Beach with high visibility and heavy tourist traffic.; Thriving, well‑established Italian restaurant business with an established reputation.; Liquor license included with the sale.