Mixed-Use Property with
For Sale
$599,000
25-31 North Street, Proctor, VT 05765
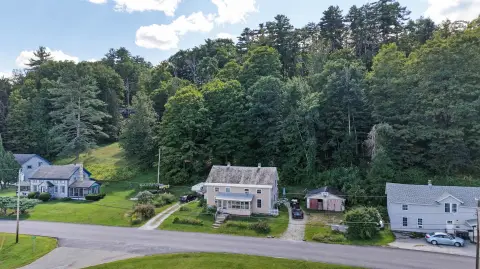
Operating restaurant with two apartments, outdoor seating, furnishings, and kitchen equipment on a substantial Vermont landholding.
Property Size3,978 SF
Price / SF$150.58
Days on Market696
Property Features for 25-31 North Street
General Information
Standard status
Active
Size
3,978 SF
Property subtype
Multi Family
Zoning
Commercial
Taxes and HOA fees
Annual Taxes
$7,481
Amenities
Wall AC Units
Oil, Baseboard
Yes
Wood
Oil Water Heater, Owned Water Heater
2
Interior
Interior Stairs, Interior Access
Metal
Beige
Wood Frame, Wood Siding
Building Details
Year Built
1880
Listing Agency:
EXP Realty
Listed By:
Zachary Zupan · License #VT082.0134350
(802) 430-9929
Source:
Compass
Added: Nov 19, 2024
Changed: Oct 14
Last Checked: Oct 16 at 11:01AM
Displayed information is deemed reliable but is not guaranteed and should be independently verified. All listing content including descriptions, pricing, images are the copyrighted material of EXP Realty

Ask AI about this property
Review the available facts, identify missing information and prepare questions for the agent.
Investment Insights
Based on property information with market context.
This mixed-use property combines an operating restaurant with two income-producing apartments in a 3,978-square-foot building constructed in 1880. The restaurant accommodates 72 guests indoors and also offers outdoor seating, a bar, pool table, wood floors, and a state-of-the-art kitchen. Inventory and furnishings are included. Interior systems include wall AC units, oil-fired baseboard heat, and an owned oil water heater.
The property at 25-31 North Street in Proctor, Vermont, includes 16.78 acres across two parcels. One 5.66-acre parcel contains the restaurant and multifamily building, while the additional 11.12 acres include the Sutherland Falls Quarry. The site is zoned Commercial and includes metal and wood-siding exterior construction.
The property at 25-31 North Street in Proctor, Vermont, includes 16.78 acres across two parcels. One 5.66-acre parcel contains the restaurant and multifamily building, while the additional 11.12 acres include the Sutherland Falls Quarry. The site is zoned Commercial and includes metal and wood-siding exterior construction.
Key Highlights
- 3,978‑square‑foot mixed‑use building constructed in 1880
- Restaurant seats 72 indoors and includes outdoor seating
- Two income‑producing apartments within the property
Financial Insights
Estimated NOI and Cap Rate
NOI / Yr
$40,277
Cap Rate
6.72%
Suggested Prices Based on Cap Rates
Cap Rate 5%
$805,540
$805.5K
Cap Rate 7%
$575,386
$575.4K
Cap Rate 9%
$447,522
$447.5K
Market Conditions
NOI Build-Up for 3,978 SF
Gross rent
$59.7K $15.00/SF
− Vacancy
−$6.0K −$1.50/SF
EGI
$53.7K $13.50/SF
− OpEx
−$13.4K −$3.38/SF
NOI
$40.3K $10.13/SF
Area
Rutland County, VT
Vacancy
10.00%
Lease Rate
$15.00 /SF/Yr
Expense Ratio
25.00%
Simulate Cap Rate and NOI
Suggested Prices Based on Cap Rates
Cap Rate 5%
$805,540
Cap Rate 7%
$575,386
Cap Rate 9%
$447,522
Alternative Uses
Best Use
Specialty Retail
$575.4K
$503.5K – $671.3K
NOI $40,277 @ 7.0% cap · market cap 6.72%
Second Best
Mixed Use
$460.3K
$402.8K – $537.0K
NOI $32,222 @ 7.0% cap · market cap 5.38%
Theoretical Best
Healthcare Medical
$692.6K
$606.0K – $808.1K
NOI $48,483 @ 7.0% cap · market cap 8.09%
Zoning and permitted uses should be independently verified with authorities.
How Realmo checks its estimates
Property Analytics
Current Use
Location Intelligence
Trade Area within ½ mile
65
Businesses Nearby
Explore this area
Business Placement
Demographics for 05765, VT
1,722
Population
761
Households
2.3
Avg Household Size
44
Median Age
28%
College-Educated
97%
High-School Grad
7.2 sq mi
ZIP Area
239
Density / Sq Mi
$65,000
Median Household Income
$42,115
Median Earnings
$997
Median Rent
$199,300
Median Home Value
Market
Vacancy Rate% for Retail in Northeast region

Frequently Asked Questions
What type of property is this?
Mixed-use property - Operating restaurant with two apartments, outdoor seating, furnishings, and kitchen equipment on a substantial Vermont landholding.
Where is this mixed-use property located?
The property is located at 25-31 North Street Proctor, VT.
What is the asking price?
The asking price for this property is $599,000.
What are key features of this property?
This property features: 3,978‑square‑foot mixed‑use building constructed in 1880; Restaurant seats 72 indoors and includes outdoor seating; Two income‑producing apartments within the property


