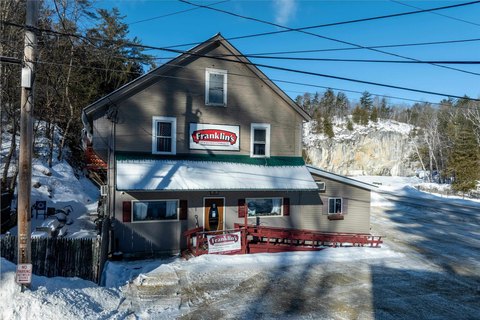
Duplex With Slate
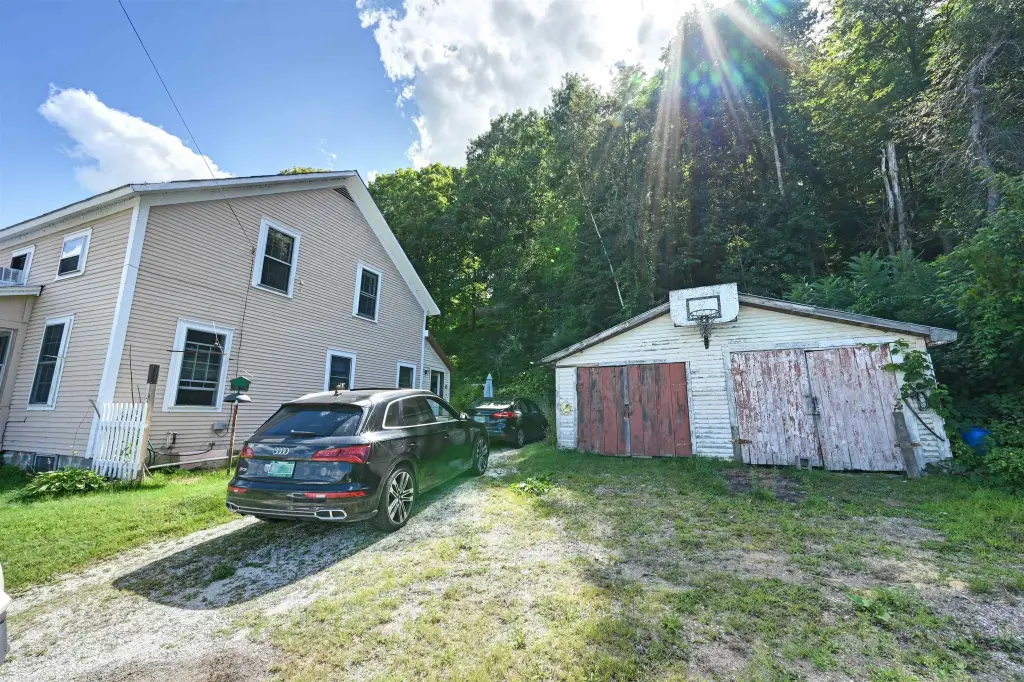
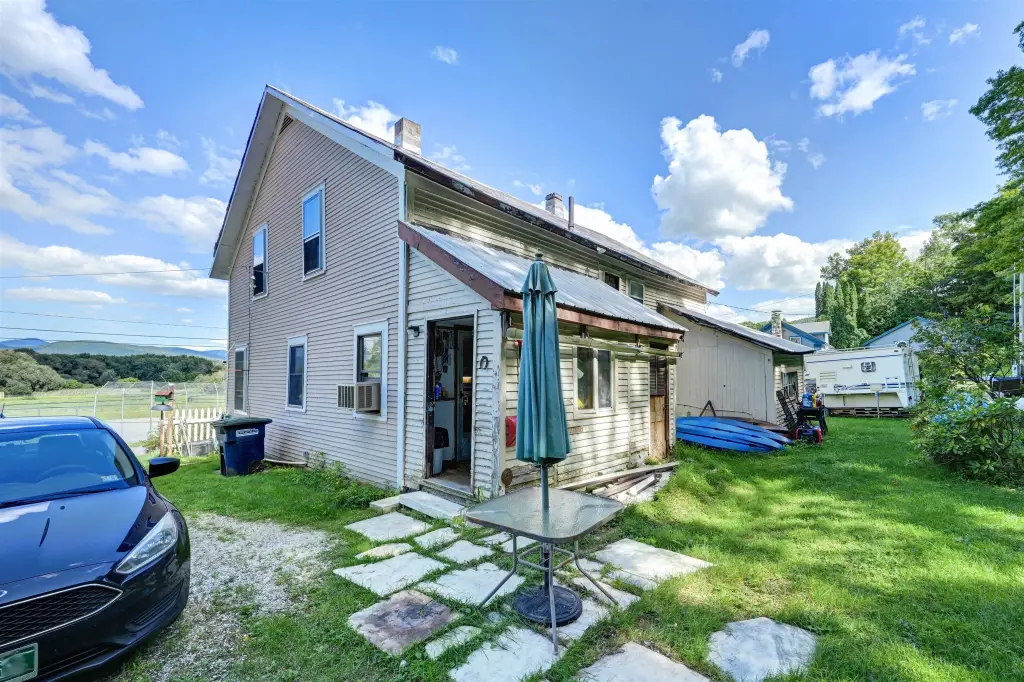
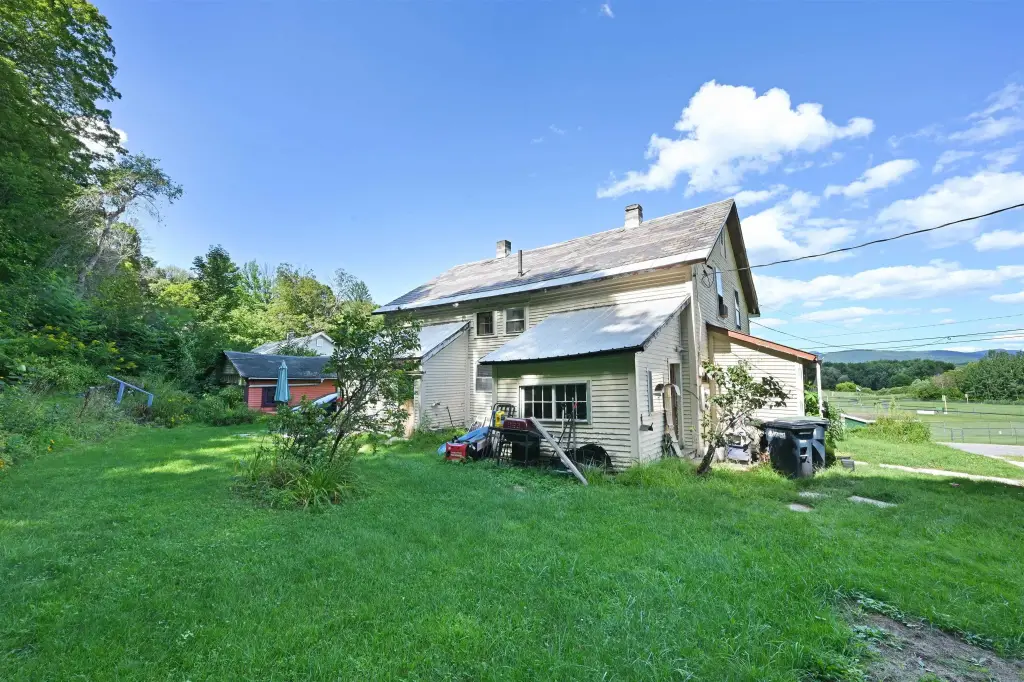
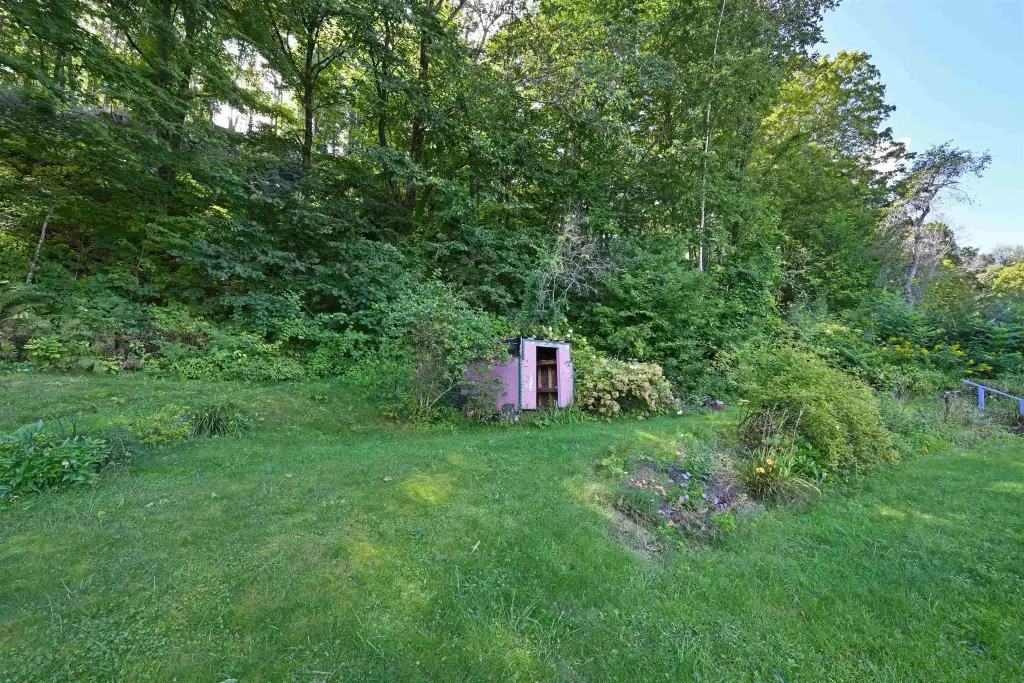
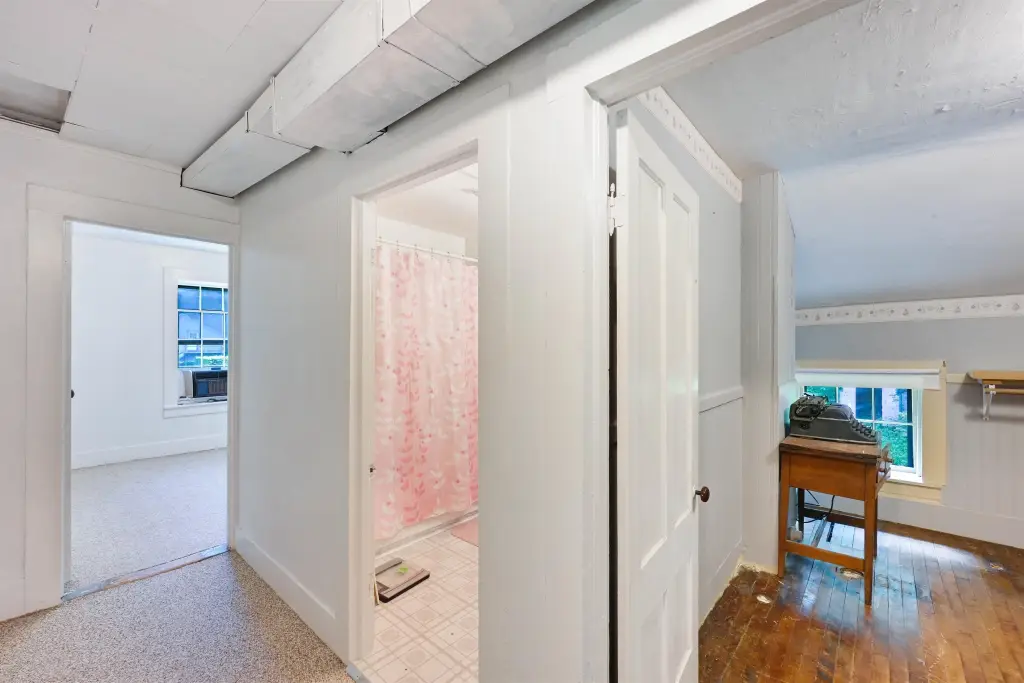
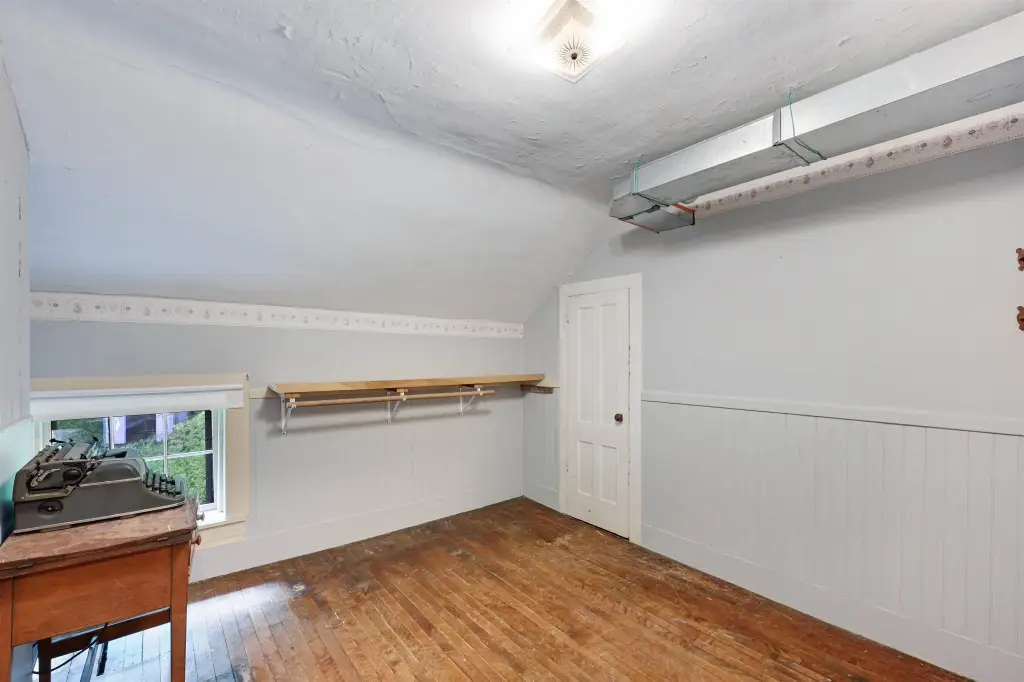
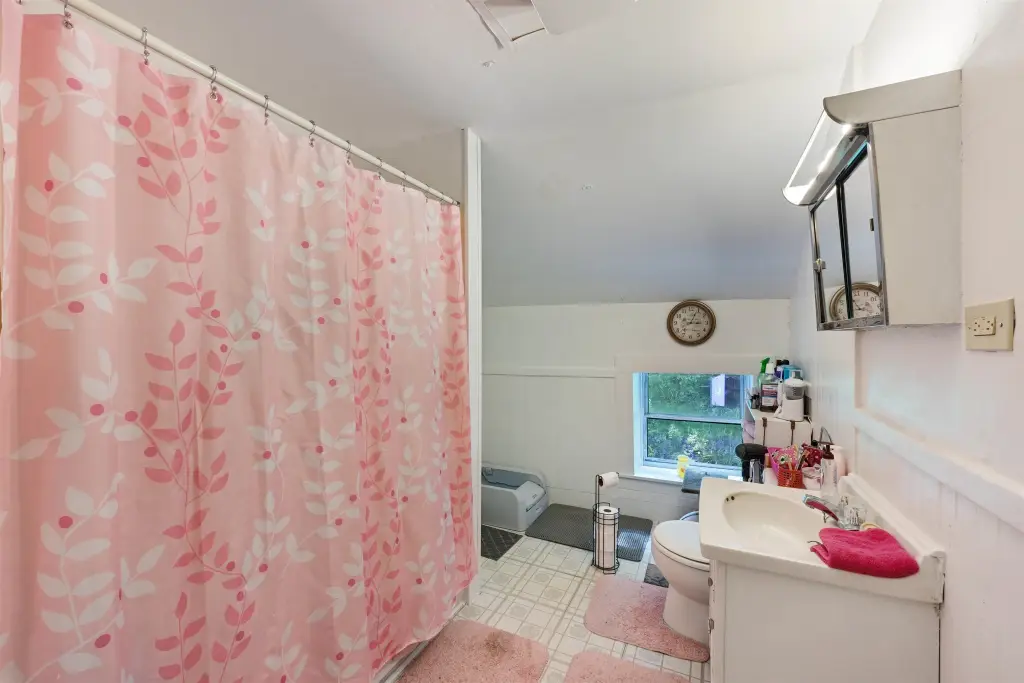
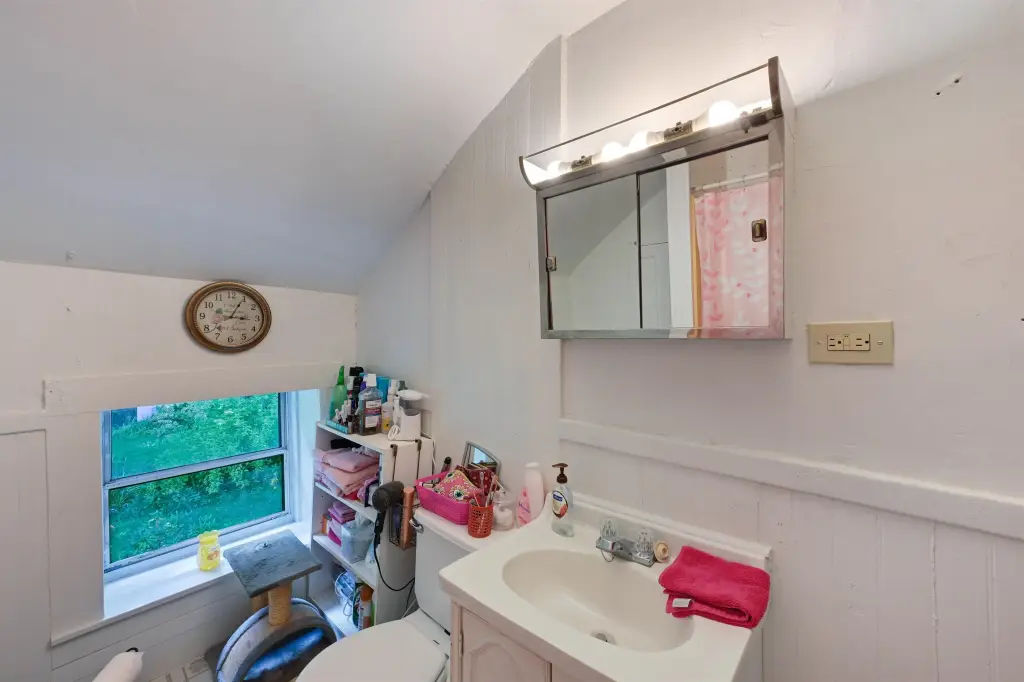
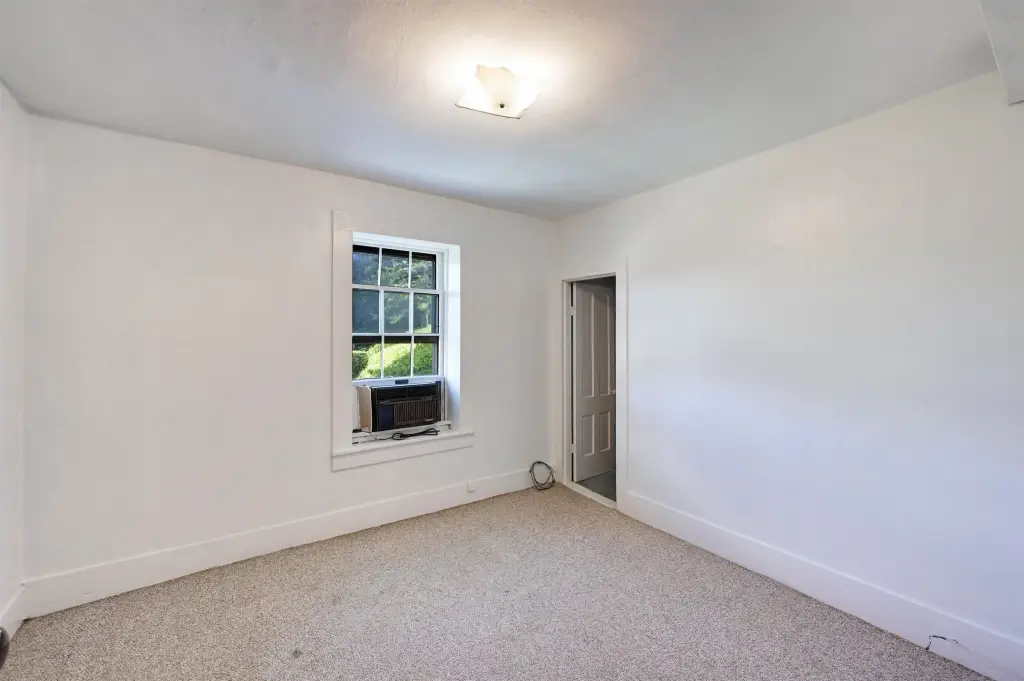
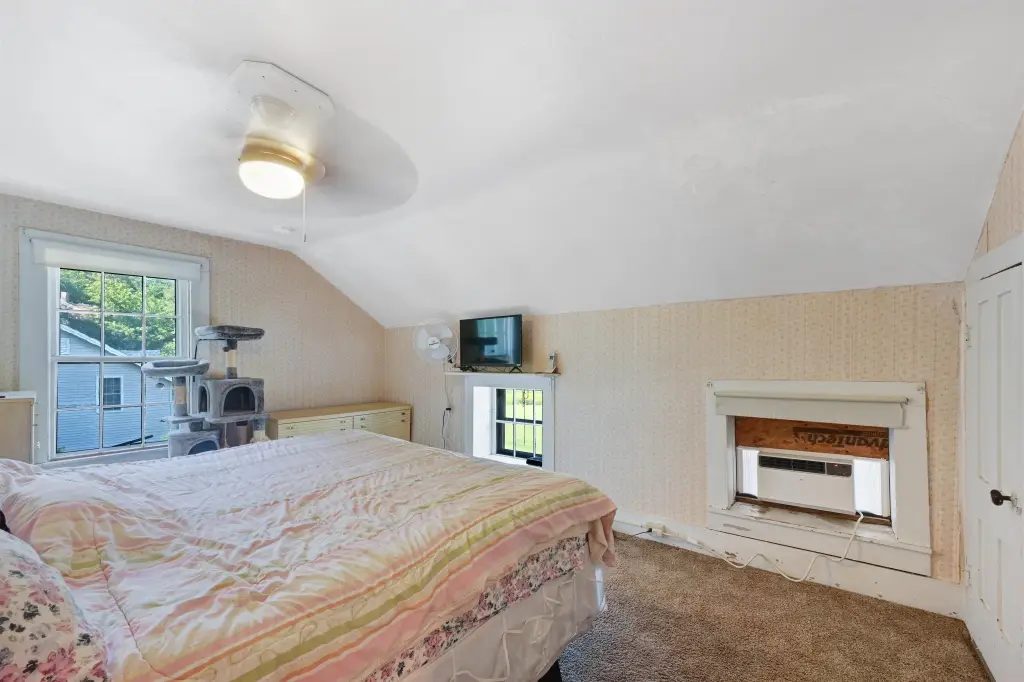
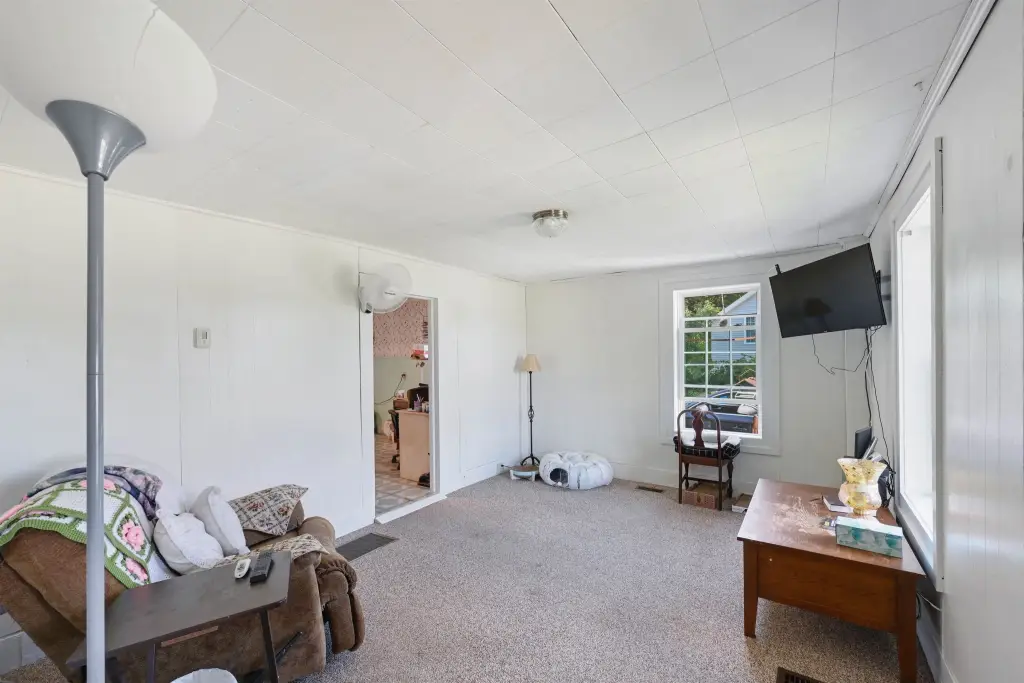
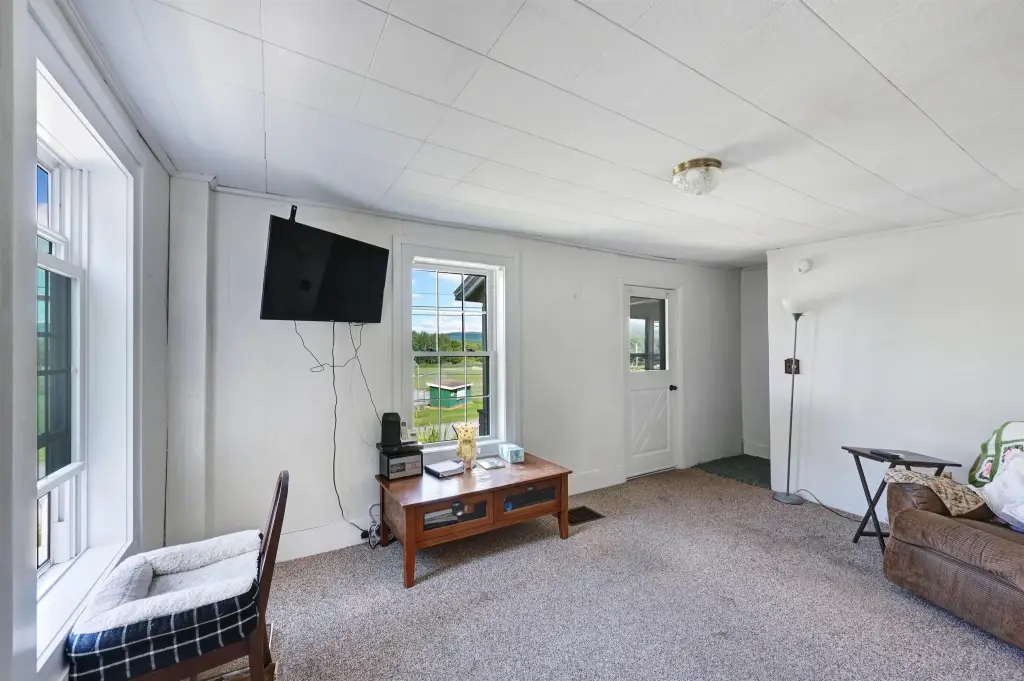
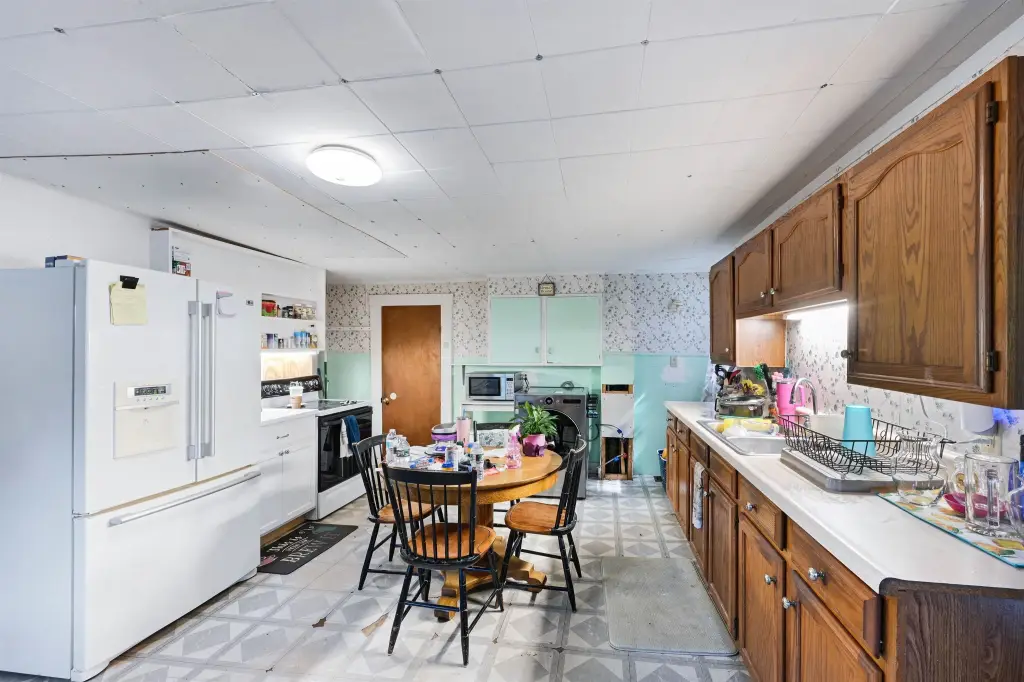
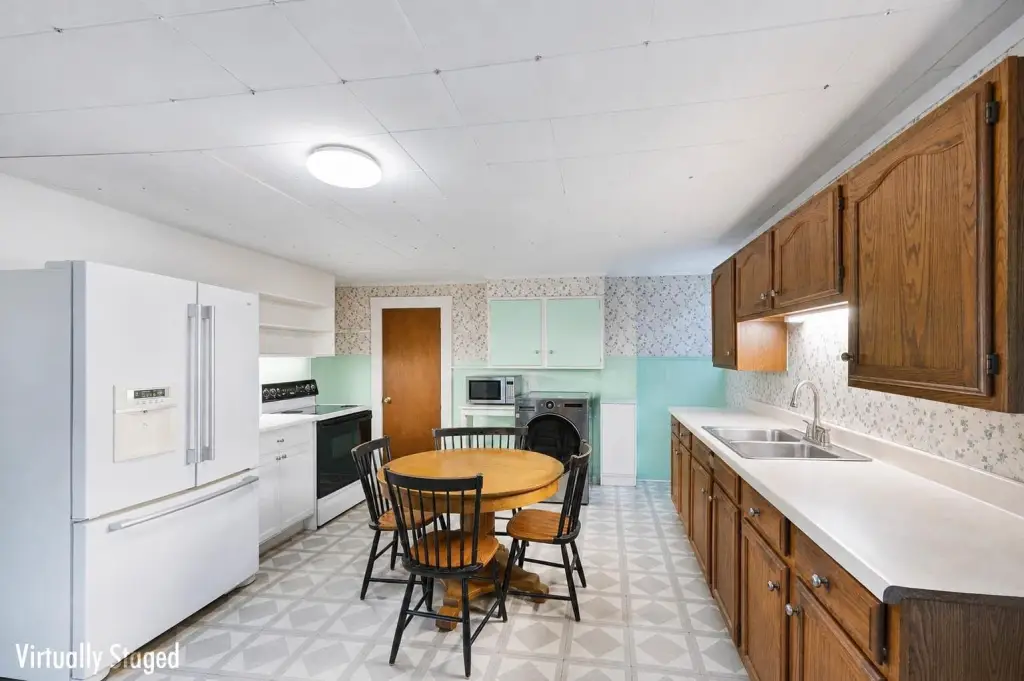
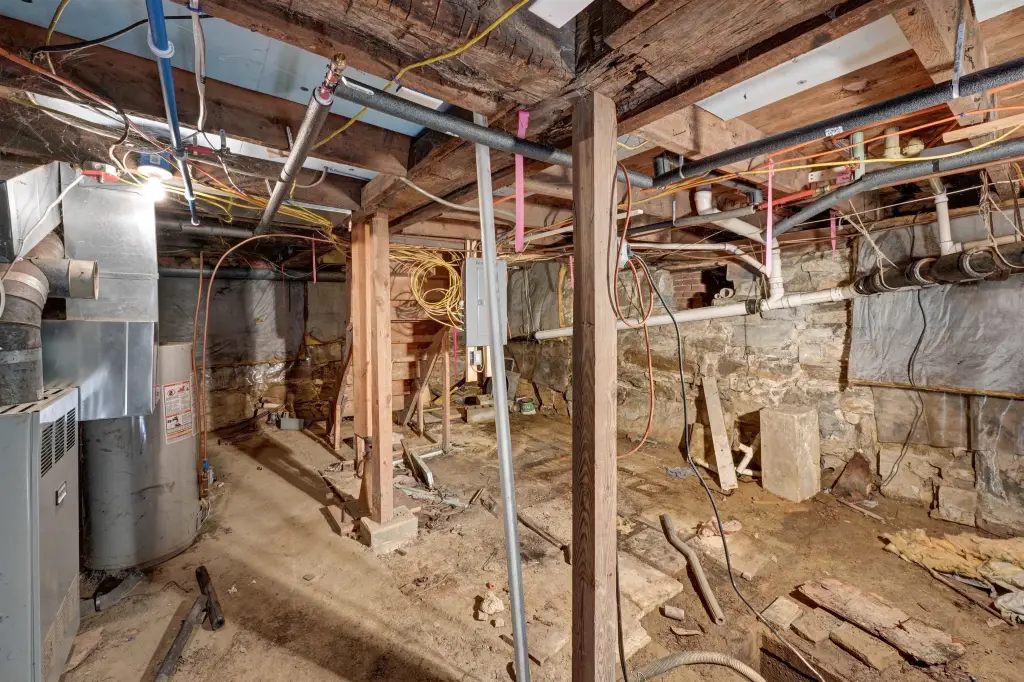
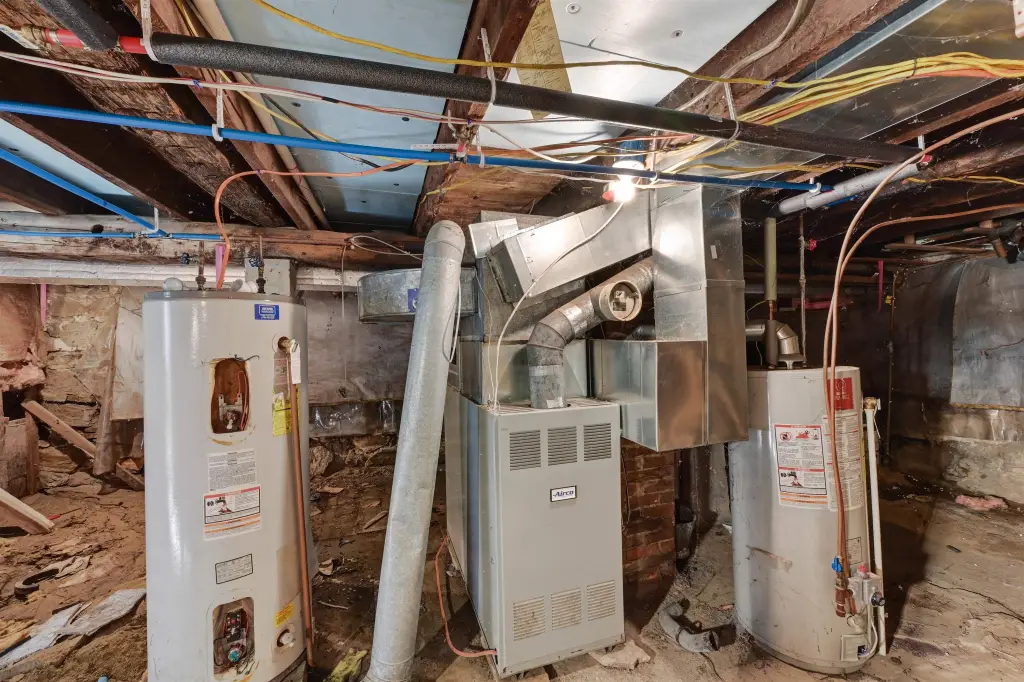
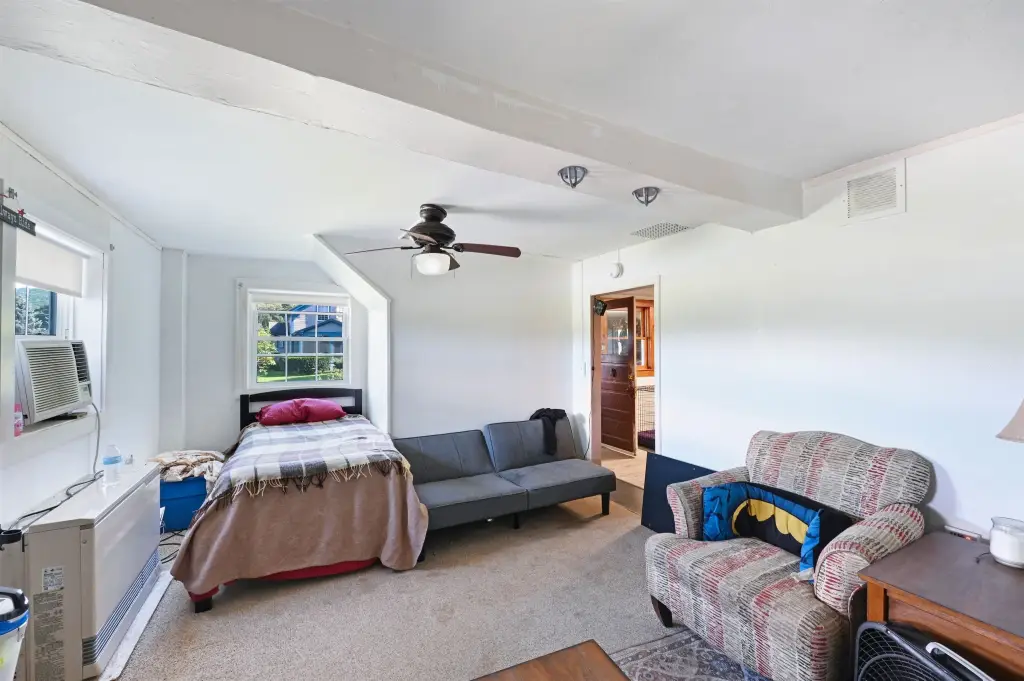
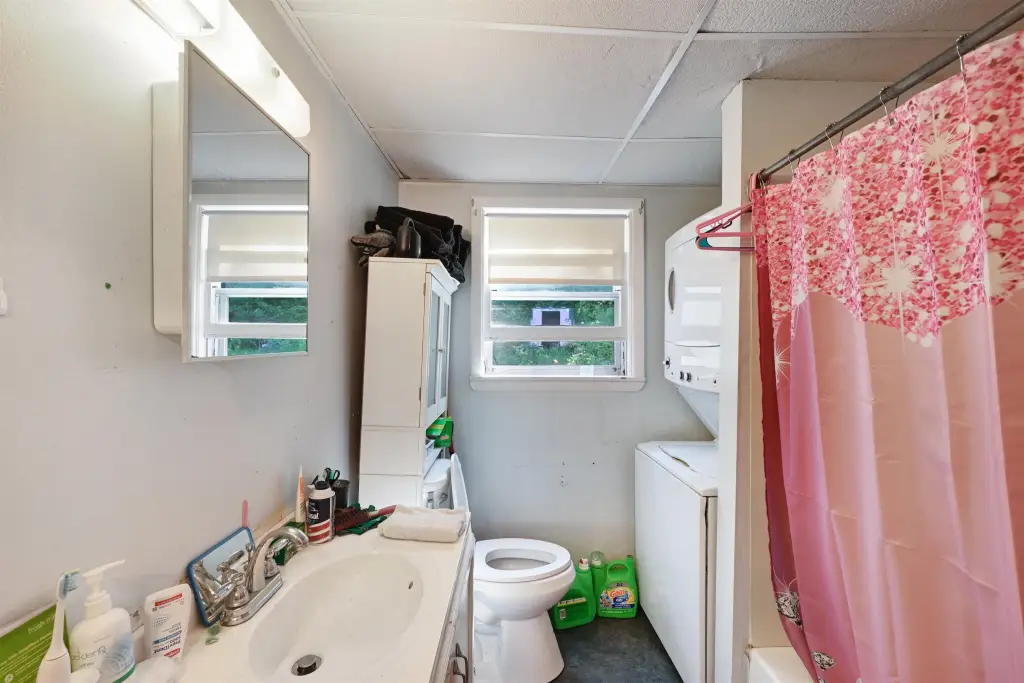
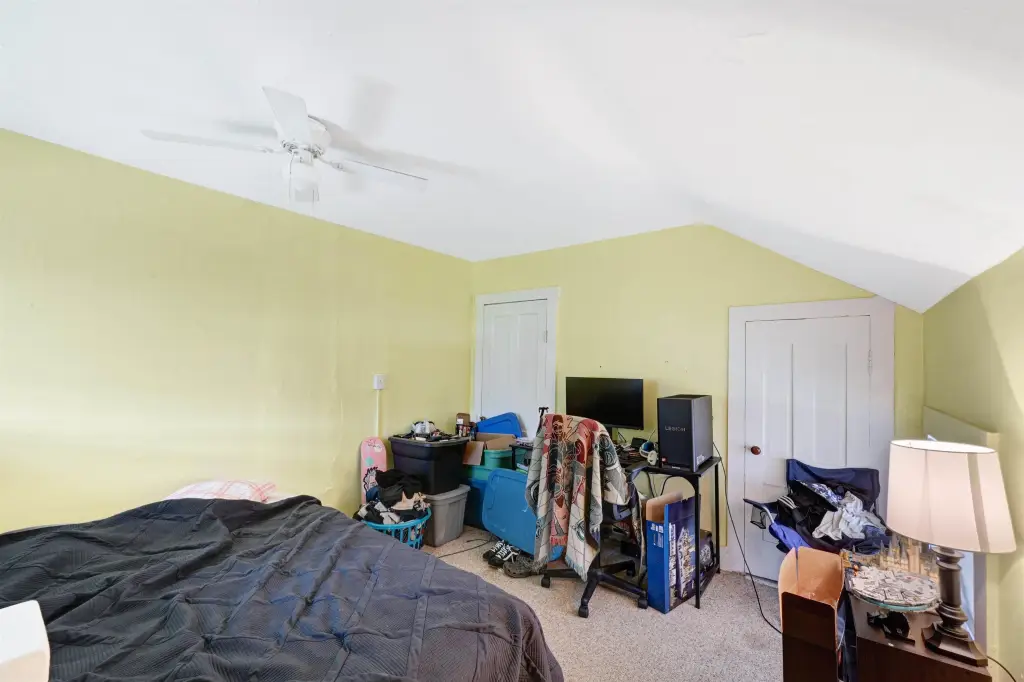
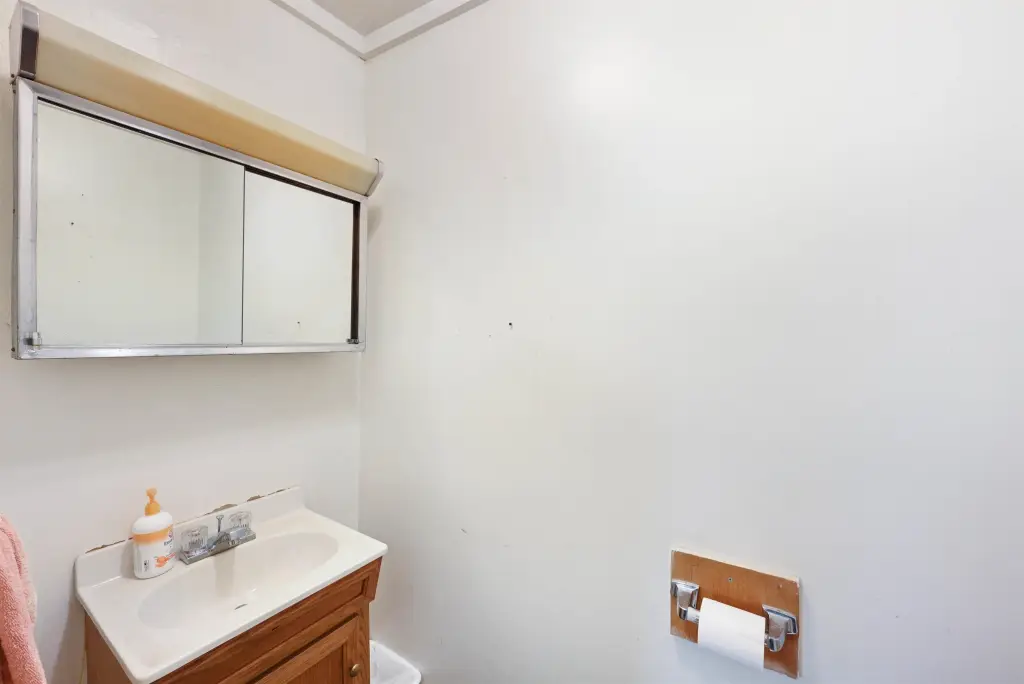
For Sale
$180,000
31-33 Gorham Bridge Road, Proctor, VT 05765
Multi-Family, Proctor, VT
Property Size1,809 SF
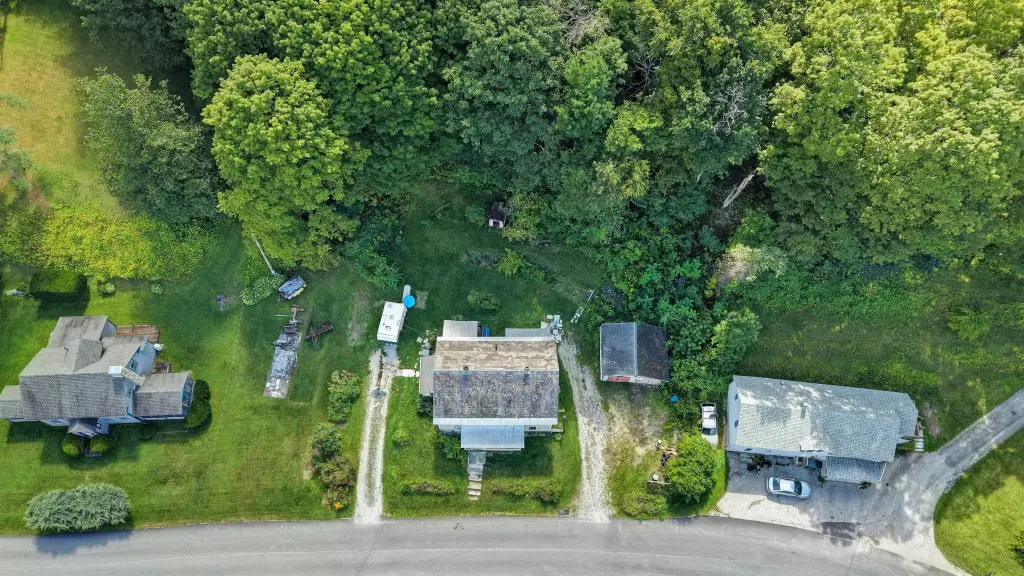
Lot Size0.36 Acres
Price / SF$99.50
Days on Market50
Property Features for 31-33 Gorham Bridge Road
General Information
Property type
Residential Multi Family
Property subtype
Other
Zoning
res
Bedrooms
5
Bathrooms
3
Full bathrooms
3
Rooms
Bedroom 5, Basement, Bathroom 2, Bathroom 1, Bedroom 1, Bedroom 3, Bedroom 4, Bathroom 3, Bedroom 2
Lot features
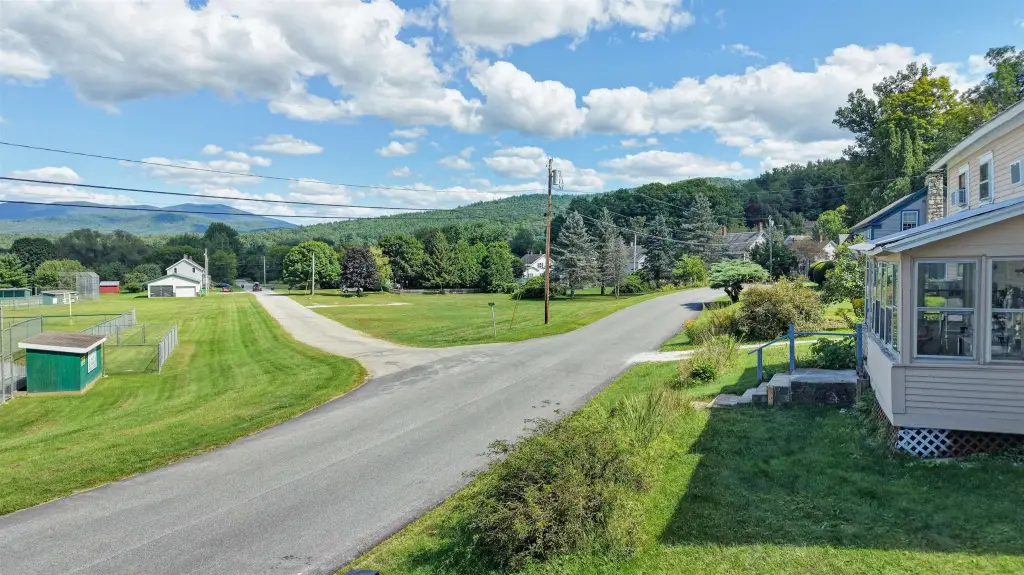
Landscaped, Mountain View
Elementary school
Proctor Elementary School
Middle school
Proctor Jr/Sr High School
High school
Proctor Jr/Sr High School
Elementary school district
Greater Rutland County Supervisory Union
Middle school district
Greater Rutland County Supervisory Union
High school district
Greater Rutland County Supervisory Union
Directions
From US-7, turn right onto Corn Hill Rd. Slight right onto VT-3 S. Turn right onto Gorham Bridge Rd. The destination will be on the right.
Standard status
Active
Size
1,809 SF
Lot size
0.36 Acres
Taxes and HOA fees
Tax Year
2027
Tax Annual Amount
2548
Utilities
Utilities
Cable Available
Heating system
Forced Air, Oil
Water source
Public
Building Details
Year built
1880
Floors in Building
2
Number of units
2
Building materials
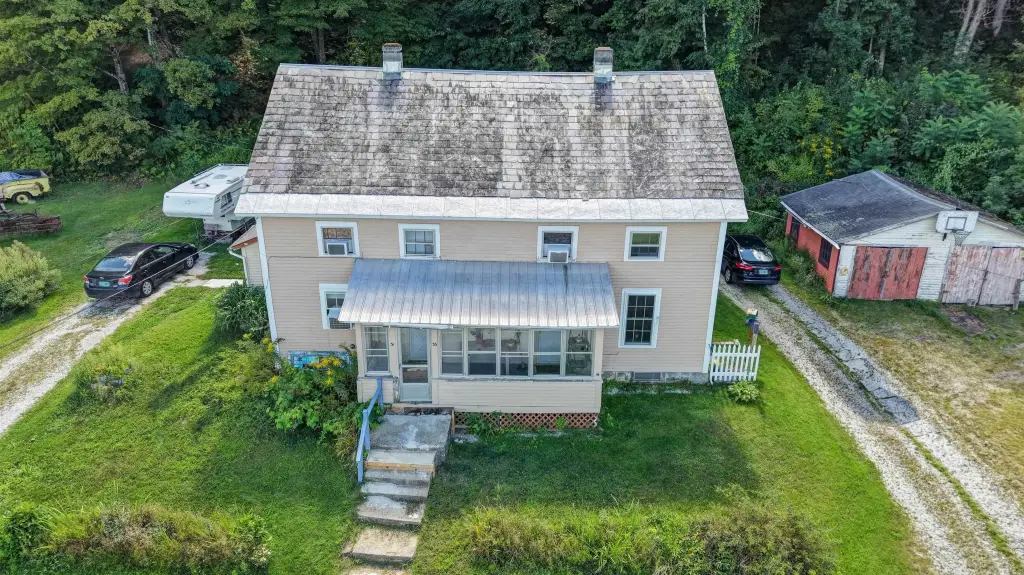
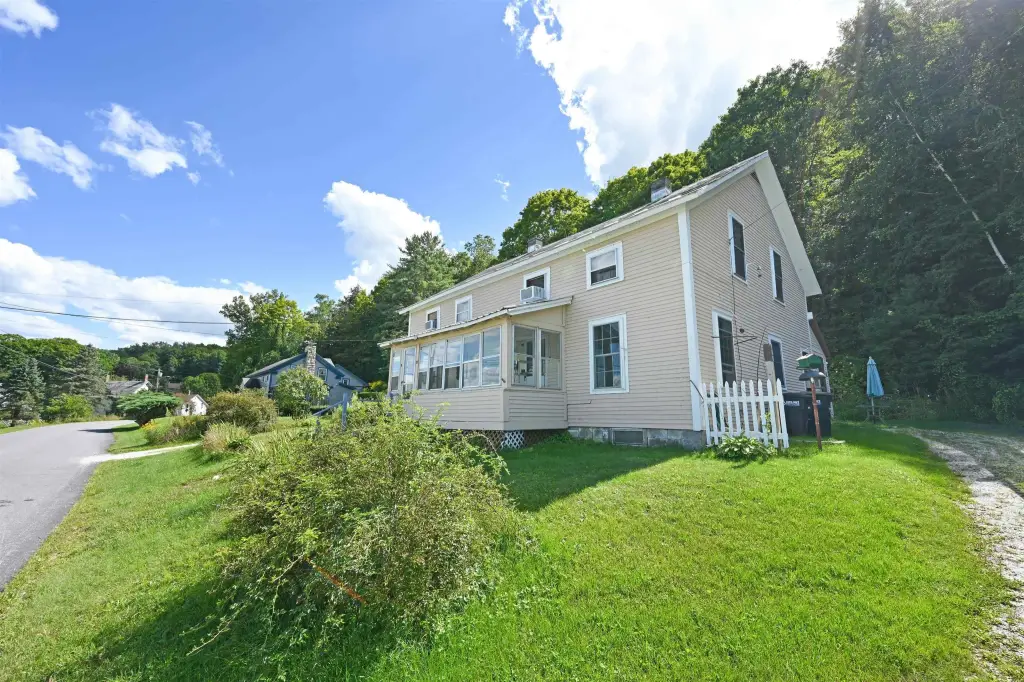
Wood Siding
Roof type
Slate
Architectural style
Other
Listing Agency:
Flex Realty
(802) 399-2860
Listed By:
Chris Williams
(802) 578-8885
Added: Aug 26
Changed: Oct 8
Last Checked: Oct 14 at 1:06AM
MLS# 5106770
Copyright © 2026 PrimeMLS. All rights reserved. All information provided by the listing agent/broker is deemed reliable but is not guaranteed and should be independently verified.
Investment Insights
Based on property information with market context.
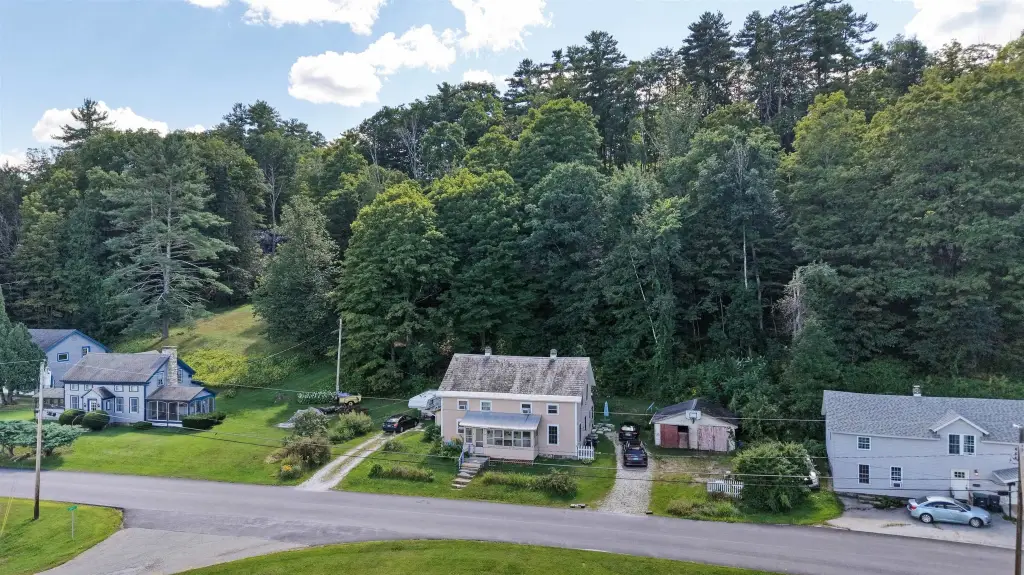
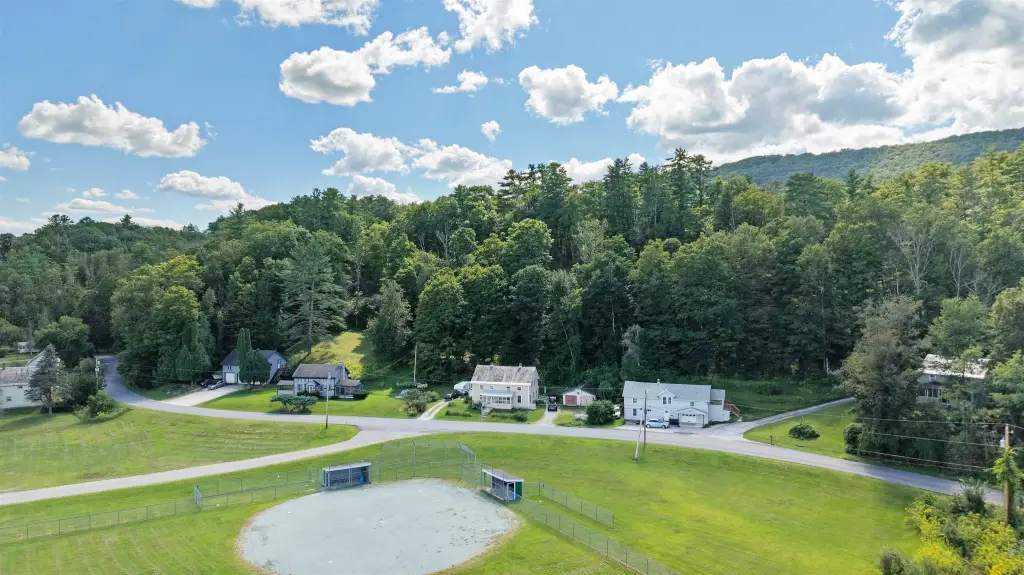
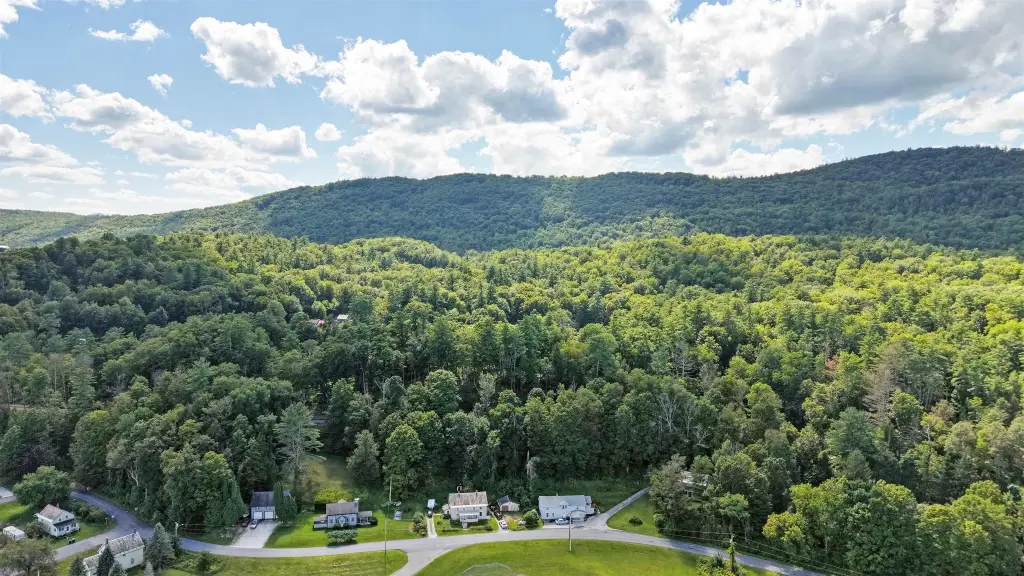
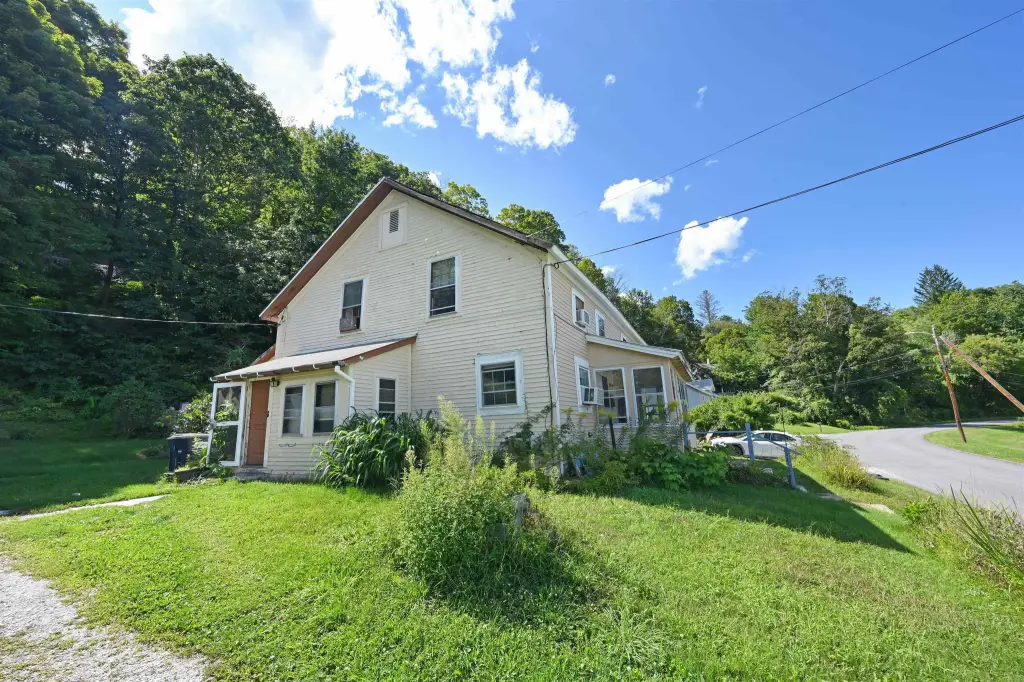
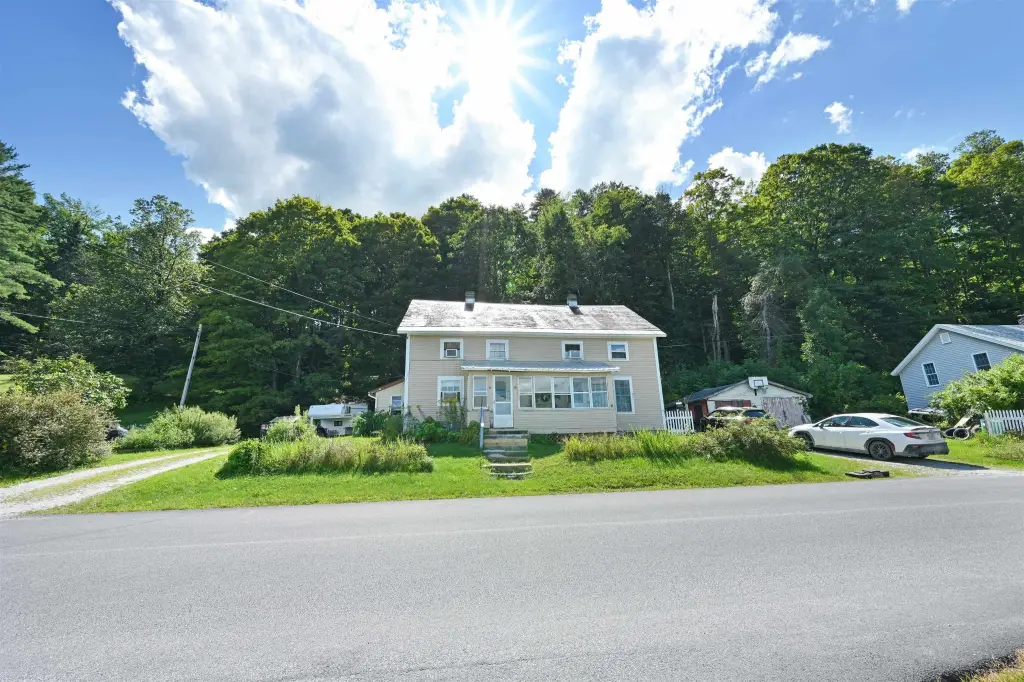
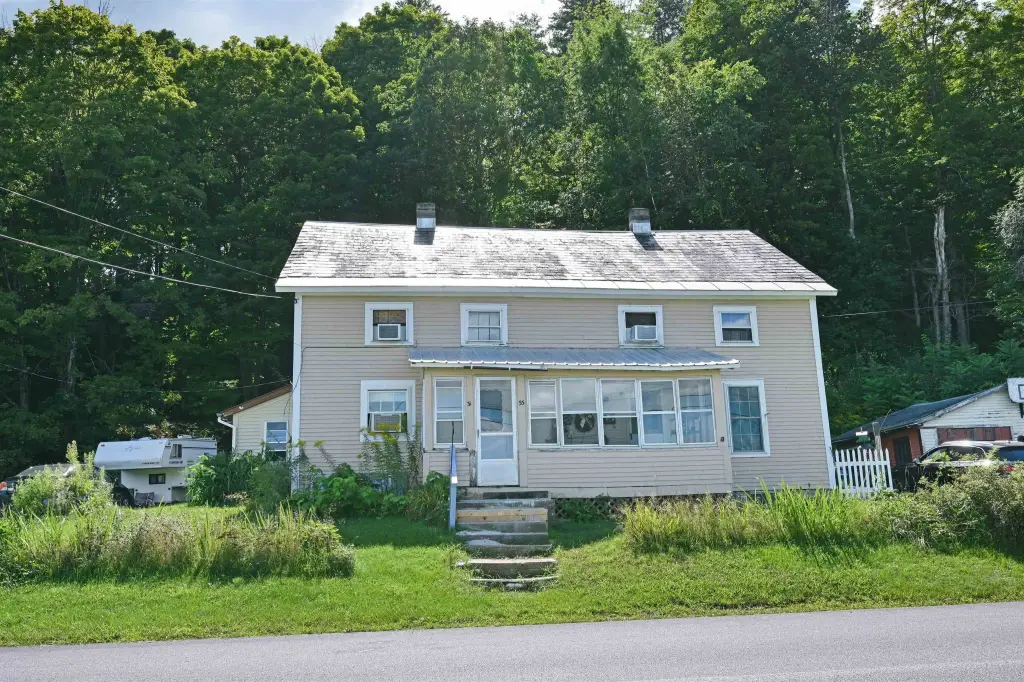
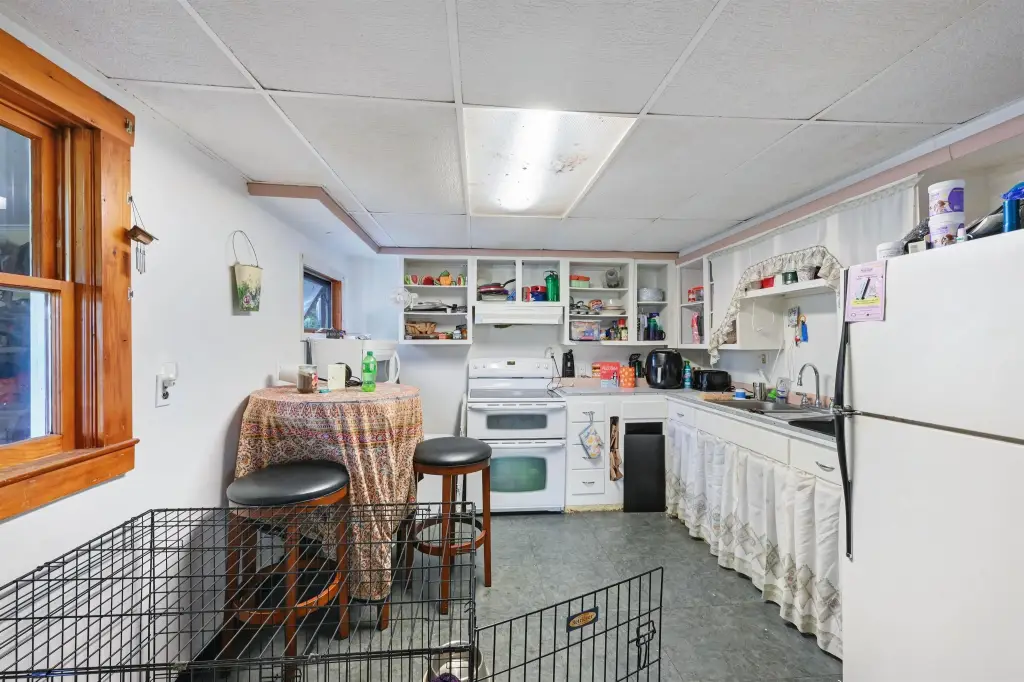
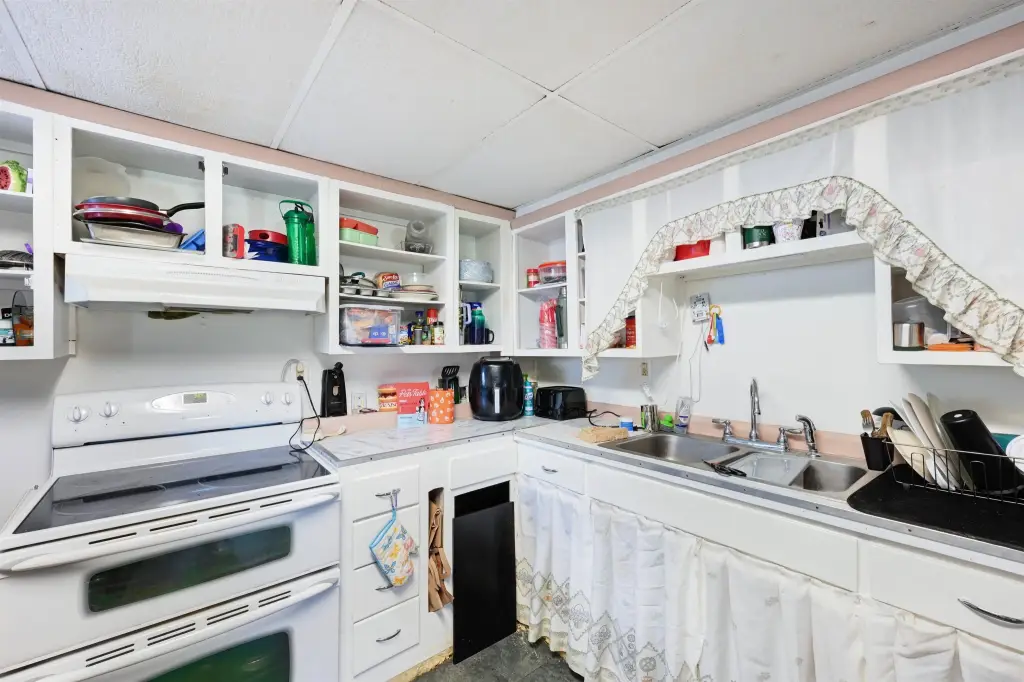
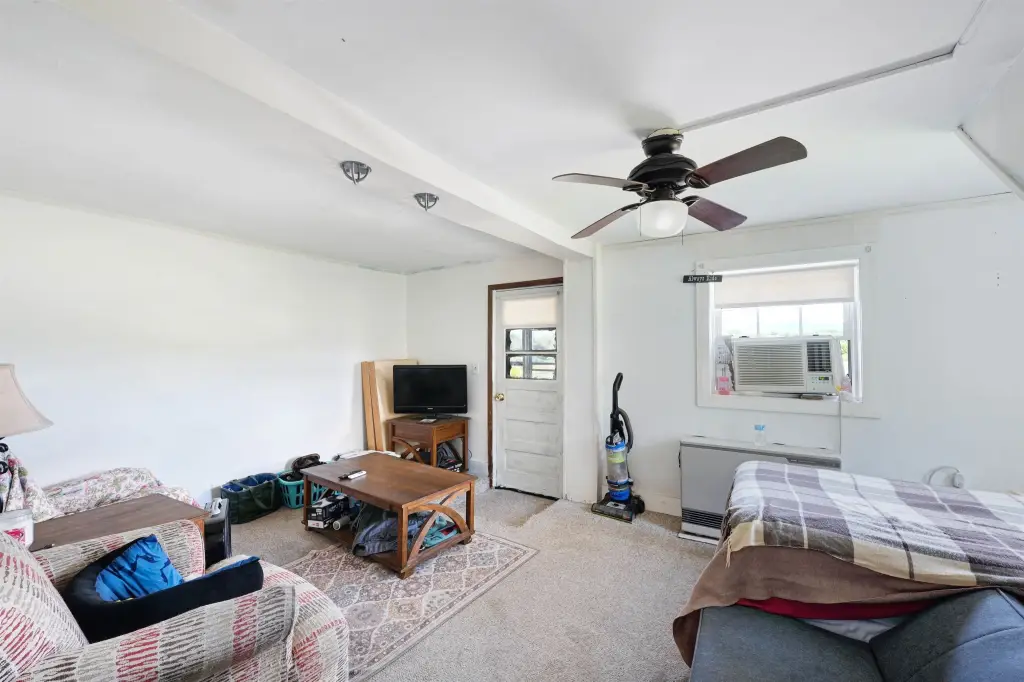
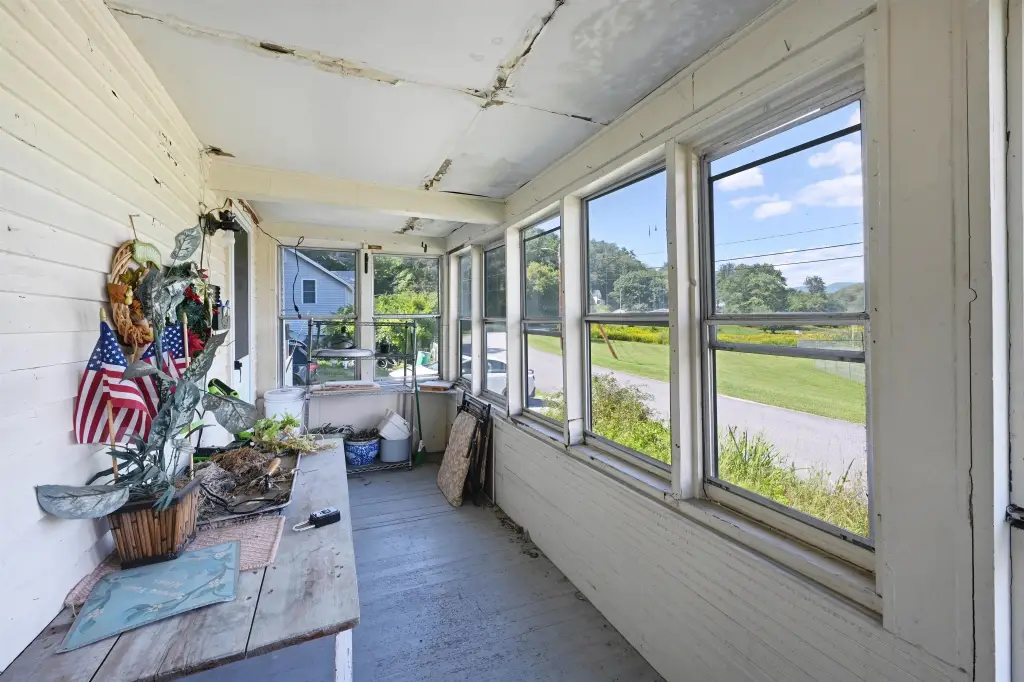
This residential duplex contains approximately 1,809 square feet on a 0.36-acre lot in Proctor. The layout includes one four-bedroom unit and a separate one-bedroom unit. The 1880 property has wood siding, a slate roof, oil-fired forced-air heat, wall air-conditioning units, public water, and a full basement. An enclosed front porch and landscaped yard add usable exterior space, while mountain views contribute to the setting.
Located at 31-33 Gorham Bridge Road, the property is near Beaver Pond, the Carriage Trails, local hiking areas, Proctor Pool, and the town ice and roller skating rink. The Vermont Marble Museum, Marble Bridge, Wilson Castle, Proctor Free Library, parks, schools, and recreational programs are also in the surrounding community. Rutland provides additional shopping, dining, entertainment, and services.
Located at 31-33 Gorham Bridge Road, the property is near Beaver Pond, the Carriage Trails, local hiking areas, Proctor Pool, and the town ice and roller skating rink. The Vermont Marble Museum, Marble Bridge, Wilson Castle, Proctor Free Library, parks, schools, and recreational programs are also in the surrounding community. Rutland provides additional shopping, dining, entertainment, and services.
Key Highlights
- Two‑unit duplex with approximately 1,809 square feet of finished space
- Unit mix includes one 4‑bedroom unit and one 1‑bedroom unit
- Situated on 0.36 acres in Proctor, VT
Financial Insights
Estimated NOI and Cap Rate
NOI / Yr
$15,796
Cap Rate
8.78%
Suggested Prices Based on Cap Rates
Cap Rate 5%
$315,920
$315.9K
Cap Rate 7%
$225,657
$225.7K
Cap Rate 9%
$175,511
$175.5K
Market Conditions
NOI Build-Up for 1,809 SF
Gross rent
$29.3K $16.20/SF
− Vacancy
−$586 −$0.32/SF
EGI
$28.7K $15.88/SF
− OpEx
−$12.9K −$7.14/SF
NOI
$15.8K $8.73/SF
Area
Rutland County, VT
Vacancy
2.00%
Lease Rate
$16.20 /SF/Yr
Expense Ratio
45.00%
Simulate Cap Rate and NOI
Suggested Prices Based on Cap Rates
Cap Rate 5%
$315,920
Cap Rate 7%
$225,657
Cap Rate 9%
$175,511
Alternative Uses
Best Use
Multifamily LT 5
$244.9K
$214.3K – $285.7K
NOI $17,143 @ 7.0% cap · market cap 9.52%
Second Best
Apartment 5plus
$225.7K
$197.5K – $263.3K
NOI $15,796 @ 7.0% cap · market cap 8.78%
Theoretical Best
Healthcare Medical
$315.0K
$275.6K – $367.5K
NOI $22,048 @ 7.0% cap · market cap 12.25%
Zoning and permitted uses should be independently verified with authorities.
How Realmo checks its estimates
Property Analytics
Unlock full access to Insights
Subscribe to Realmo Intelligence
Open Analytics
Current Use
Lease Details
2
Residential units
Yes
Utilities to site
Location Intelligence
Trade Area within ½ mile
40
Businesses Nearby
Explore this area
Business Placement
Demographics for 05765, VT
1,722
Population
761
Households
2.3
Avg Household Size
44
Median Age
28%
College-Educated
97%
High-School Grad
7.2 sq mi
ZIP Area
239
Density / Sq Mi
$65,000
Median Household Income
$42,115
Median Earnings
$997
Median Rent
$199,300
Median Home Value
Check the figures for this property
Cap Rate, Value Estimation, Potential NOI and more
View Realmo Analytics
Market
Vacancy Rate% for Multifamily in Northeast region

Questions? Ask Rey
Realmo’s AI knows this listing — price, zoning, demand, history. Ask anything.

Frequently Asked Questions
What type of property is this?
Duplex - Two-unit residential property with public water, a full basement, and an enclosed front porch.
Where is this duplex located?
The property is located at 31-33 Gorham Bridge Road Proctor, VT.
What is the asking price?
The asking price for this property is $180,000.
What are key features of this property?
This property features: Two‑unit duplex with approximately 1,809 square feet of finished space; Unit mix includes one 4‑bedroom unit and one 1‑bedroom unit; Situated on 0.36 acres in Proctor, VT


