Mixed-Use Building with Air
For Sale
Contact for pricing
123-125 W 20 Street, New York, NY 10011
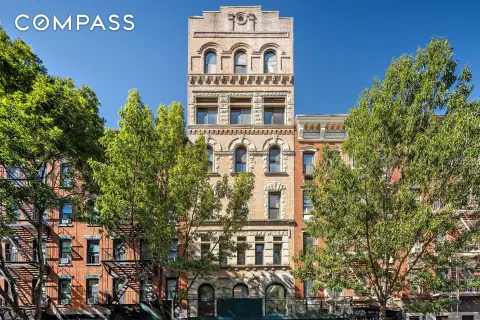
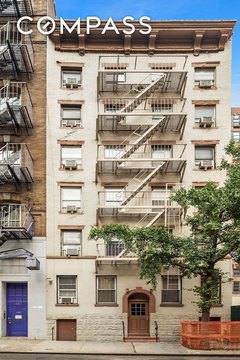
Five-story elevator building combining residential units with retail and office space in a renovated brick structure.
Property Size17,149 SF
Price / SF$1,749
Days on Market527
Property Features for 123-125 W 20 Street
General Information
Standard status
Active
Size
17,149 SF
Property subtype
Business for Sale, Multifamily, Office, Retail, Mixed Use
Zoning
C6
Building Details
Year Built
1993
Buildings
1
Listing Agency:
American Homes Group Inc
Listed By:
Suzy Miller · License #NY
Source:
Crexi
Added: May 9, 2025
Changed: Oct 5
Last Checked: Oct 16 at 8:08AM
Displayed information is deemed reliable but is not guaranteed and should be independently verified. All listing content including descriptions, pricing, images are the copyrighted material of American Homes Group Inc

Ask AI about this property
Review the available facts, identify missing information and prepare questions for the agent.
Investment Insights
Based on property information with market context.
This five-story elevator mixed-use building at 123-125 W 20 Street contains 17,149 square feet above grade, plus a finished 4,749-square-foot cellar. The layout includes nine units: five residential units, two commercial storefronts, and two offices undergoing conversion to residential use. Eight units are scheduled for vacant delivery. Residential apartments feature private outdoor space and two full bathrooms, while separate boilers, electrical panels, and meters support condominium conversion planning. Retail space accounts for 3,416 square feet, and ceiling heights range from over 10 feet on upper floors to 8.5 feet in the basement.
Capital improvements completed in 2024 include exterior brick repointing, replacement windows and doors, renovated bathrooms, and a new roof. The property is zoned C6 and includes approximately 14,449 square feet of unused air rights. One commercial tenant remains in place through 2026, with built-in lease escalations.
Capital improvements completed in 2024 include exterior brick repointing, replacement windows and doors, renovated bathrooms, and a new roof. The property is zoned C6 and includes approximately 14,449 square feet of unused air rights. One commercial tenant remains in place through 2026, with built-in lease escalations.
Key Highlights
- 17,149 SF above grade plus a finished 4,749 SF cellar
- Nine total units: five residential, two commercial storefronts, and two offices
- Approximately 14,449 SF of unused air rights
Financial Insights
Estimated NOI and Cap Rate
NOI / Yr
$2,413,285
Cap Rate
8.04%
Suggested Prices Based on Cap Rates
Cap Rate 5%
$48,265,700
$48.3M
Cap Rate 7%
$34,475,500
$34.5M
Cap Rate 9%
$26,814,278
$26.8M
Market Conditions
NOI Build-Up for 17,149 SF
Gross rent
$4.04M $235.68/SF
− Vacancy
−$594.1K −$34.64/SF
EGI
$3.45M $201.04/SF
− OpEx
−$1.03M −$60.31/SF
NOI
$2.41M $140.72/SF
Area
New York, NY
Vacancy
14.70%
Lease Rate
$235.68 /SF/Yr
Expense Ratio
30.00%
Simulate Cap Rate and NOI
Suggested Prices Based on Cap Rates
Cap Rate 5%
$48,265,700
Cap Rate 7%
$34,475,500
Cap Rate 9%
$26,814,278
Alternative Uses
Best Use
Retail
$34.48M
$30.17M – $40.22M
NOI $2,413,285 @ 7.0% cap · market cap 8.04%
Second Best
Mixed Use
$7.81M
$6.83M – $9.11M
NOI $546,624 @ 7.0% cap · market cap 1.82%
Theoretical Best
Specialty Retail
$42.69M
$37.35M – $49.80M
NOI $2,988,042 @ 7.0% cap · market cap 9.96%
Zoning and permitted uses should be independently verified with authorities.
How Realmo checks its estimates
Property Analytics
Current Use
Location Intelligence
Trade Area within ½ mile
41,706
Businesses Nearby
Explore this area
Business Placement
Demographics for 10011, NY
53,318
Population
35,049
Households
1.5
Avg Household Size
39
Median Age
79%
College-Educated
96%
High-School Grad
0.6 sq mi
ZIP Area
88,863
Density / Sq Mi
$146,571
Median Household Income
$113,503
Median Earnings
$2,868
Median Rent
$1,165,800
Median Home Value
Market
Vacancy Rate% for Office in Northeast region





Frequently Asked Questions
What type of property is this?
Mixed-use property - Five-story elevator building combining residential units with retail and office space in a renovated brick structure.
Where is this mixed-use property located?
The property is located at 123-125 W 20 Street New York, NY.
What is the asking price?
The asking price for this property is $29,999,999.
What are key features of this property?
This property features: 17,149 SF above grade plus a finished 4,749 SF cellar; Nine total units: five residential, two commercial storefronts, and two offices; Approximately 14,449 SF of unused air rights


