Renovated Two-Unit
For Sale
$574,000
Pending
134-136 Sawyer Street, South Portland, ME 04106
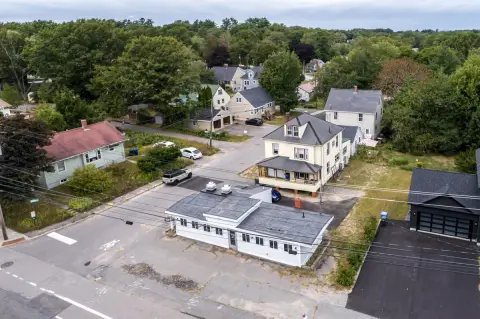
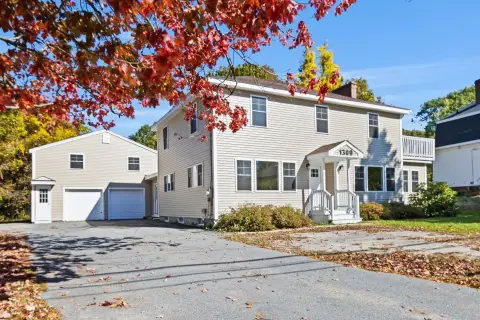
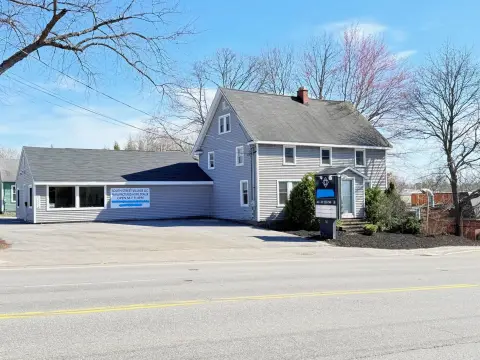
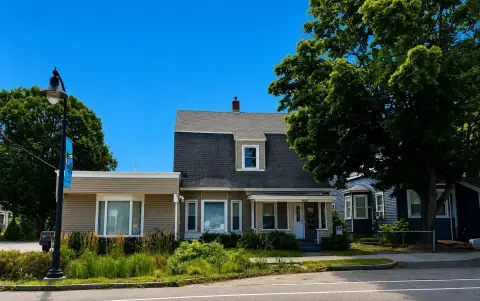
Recently updated property with private driveways, a fenced yard, and walkable access to the Greenbelt Trail.
Property Size2,323 SF
Days on Market219
Property Features for 134-136 Sawyer Street
General Information
Standard status
Pending
Size
2,323 SF
Property subtype
Multi-Family
Zoning
VR
Additional Details
Multifamily Units
2
Taxes and HOA fees
Annual Taxes
$7,166
Amenities
Heat Pump, Wall Unit(s)
Electric, Gas Natural, Baseboard, Direct Vent Furnace, Heat Pump
Bulkhead, Interior Entry, Partial, Brick/Mortar
Carpet, Vinyl
Bathtub, Main Level, Washer Hookup
Yes
2
Main Level, Washer Hookup
Bathtub
Stone floor in basement
2.0
Shingle
Double Pane Windows
Building Details
Year Built
1830
Buildings
1
Stories
2
Listing Agency:
Pine Tree Realty of Maine
Listed By:
Todd Harvey
(207) 650-3750
Source:
Compass
Added: Mar 13
Changed: Oct 8
Last Checked: Oct 16 at 10:28AM
Displayed information is deemed reliable but is not guaranteed and should be independently verified. All listing content including descriptions, pricing, images are the copyrighted material of Pine Tree Realty of Maine

Ask AI about this property
Review the available facts, identify missing information and prepare questions for the agent.
Investment Insights
Based on property information with market context.
Built in 1830 and recently renovated, this 2,323-square-foot duplex contains two residential units, each with a private driveway and a practical multi-level layout. The floor plans include three upstairs bedrooms, a kitchen, dining room, living room, and bonus room on the main level. A fenced backyard and storage shed add useful outdoor space, while interior features include heat pumps, direct vent furnaces, baseboard heat, and walk-out access.
The property is located in South Portland’s historic Ferry Village neighborhood, between Willard Beach and Knightville. The Greenbelt Trail is nearby, with walking access to the ocean and local businesses. Portland dining, marinas, lighthouses, and other South Portland amenities are within a short drive. Zoning is VR, and the two-unit configuration supports either owner occupancy or an income-producing residential use.
The property is located in South Portland’s historic Ferry Village neighborhood, between Willard Beach and Knightville. The Greenbelt Trail is nearby, with walking access to the ocean and local businesses. Portland dining, marinas, lighthouses, and other South Portland amenities are within a short drive. Zoning is VR, and the two-unit configuration supports either owner occupancy or an income-producing residential use.
Key Highlights
- 2,323‑square‑foot duplex with 2 residential units
- Built in 1830 and recently renovated
- Each unit has its own private driveway
Financial Insights
Estimated NOI and Cap Rate
NOI / Yr
$41,051
Cap Rate
7.15%
Suggested Prices Based on Cap Rates
Cap Rate 5%
$821,020
$821.0K
Cap Rate 7%
$586,443
$586.4K
Cap Rate 9%
$456,122
$456.1K
Market Conditions
NOI Build-Up for 2,323 SF
Gross rent
$62.7K $27.00/SF
− Vacancy
−$4.1K −$1.76/SF
EGI
$58.6K $25.25/SF
− OpEx
−$17.6K −$7.57/SF
NOI
$41.1K $17.67/SF
Area
Cumberland County, ME
Vacancy
6.50%
Lease Rate
$27.00 /SF/Yr
Expense Ratio
30.00%
Simulate Cap Rate and NOI
Suggested Prices Based on Cap Rates
Cap Rate 5%
$821,020
Cap Rate 7%
$586,443
Cap Rate 9%
$456,122
Alternative Uses
Best Use
Multifamily LT 5
$586.4K
$513.1K – $684.2K
NOI $41,051 @ 7.0% cap · market cap 7.15%
Second Best
Apartment 5plus
$545.6K
$477.4K – $636.5K
NOI $38,192 @ 7.0% cap · market cap 6.65%
Theoretical Best
Office A
$638.5K
$558.7K – $744.9K
NOI $44,693 @ 7.0% cap · market cap 7.79%
Zoning and permitted uses should be independently verified with authorities.
How Realmo checks its estimates
Property Analytics
Current Use
Lease Details
2
Residential units
Location Intelligence
Trade Area within ½ mile
304
Businesses Nearby
Explore this area
Business Placement
Demographics for 04106, ME
26,641
Population
12,849
Households
2.1
Avg Household Size
41
Median Age
49%
College-Educated
95%
High-School Grad
12.2 sq mi
ZIP Area
2,184
Density / Sq Mi
$83,744
Median Household Income
$47,818
Median Earnings
$1,642
Median Rent
$403,500
Median Home Value
Market
Vacancy Rate% for Multifamily in Northeast region





Frequently Asked Questions
What type of property is this?
Duplex - Recently updated property with private driveways, a fenced yard, and walkable access to the Greenbelt Trail.
Where is this duplex located?
The property is located at 134-136 Sawyer Street South Portland, ME.
What is the asking price?
The asking price for this property is $574,000.
What are key features of this property?
This property features: 2,323‑square‑foot duplex with 2 residential units; Built in 1830 and recently renovated; Each unit has its own private driveway