Two-Unit Duplex with Additional
For Sale
$499,000
449 Main Street, South Portland, ME 04106
Multi-Family, South Portland, ME
Property Size2,696 SF
Lot Size0.14 Acres
Price / SF$185.09
Days on Market50
Property Features for 449 Main Street
General Information
Property type
Residential Multi Family
Property subtype
Other
Zoning
Residential Zone A
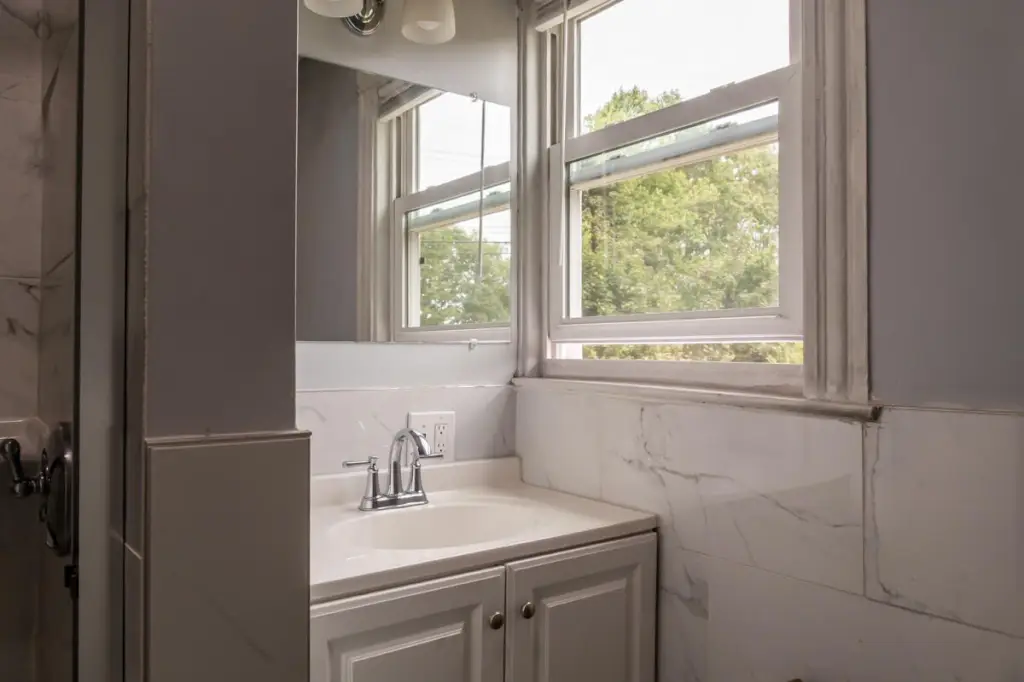
Bathrooms
2
Full bathrooms
2
Rooms
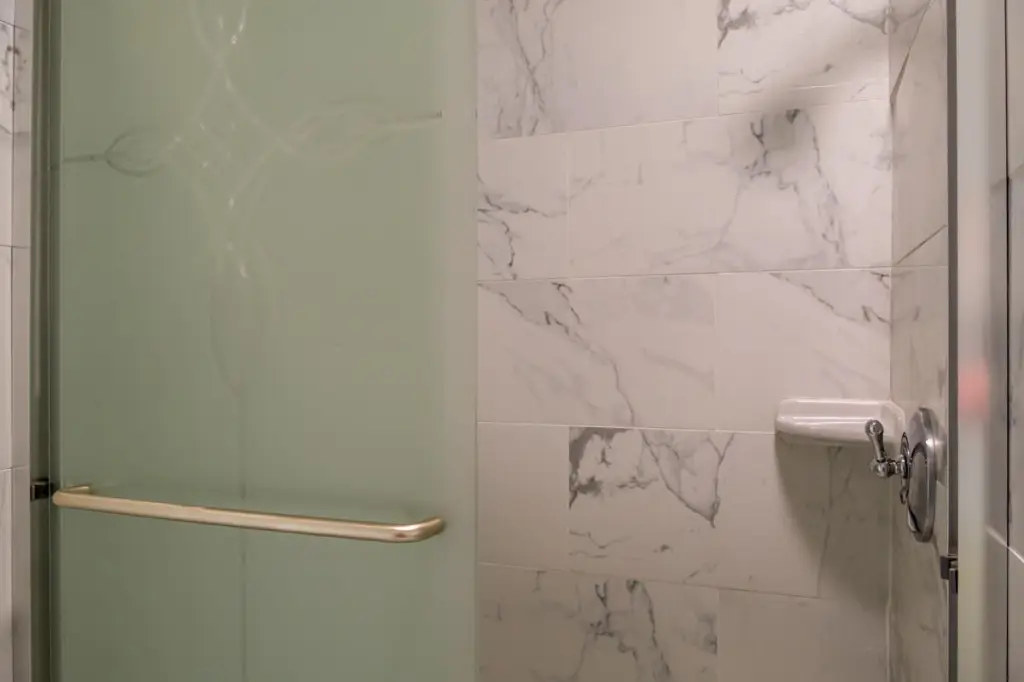
Bathroom 1, Bathroom 2
Parking features
Off Street, On Street
Patio and Porch features
Porch
Interior features
1st Floor Bedroom, Attic
Basement
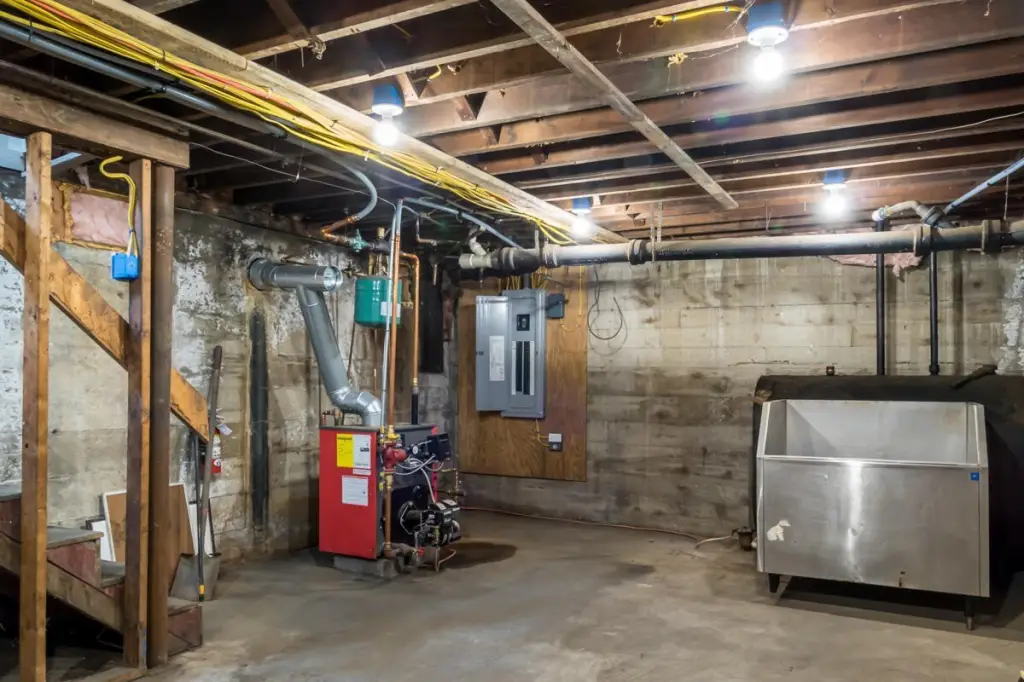
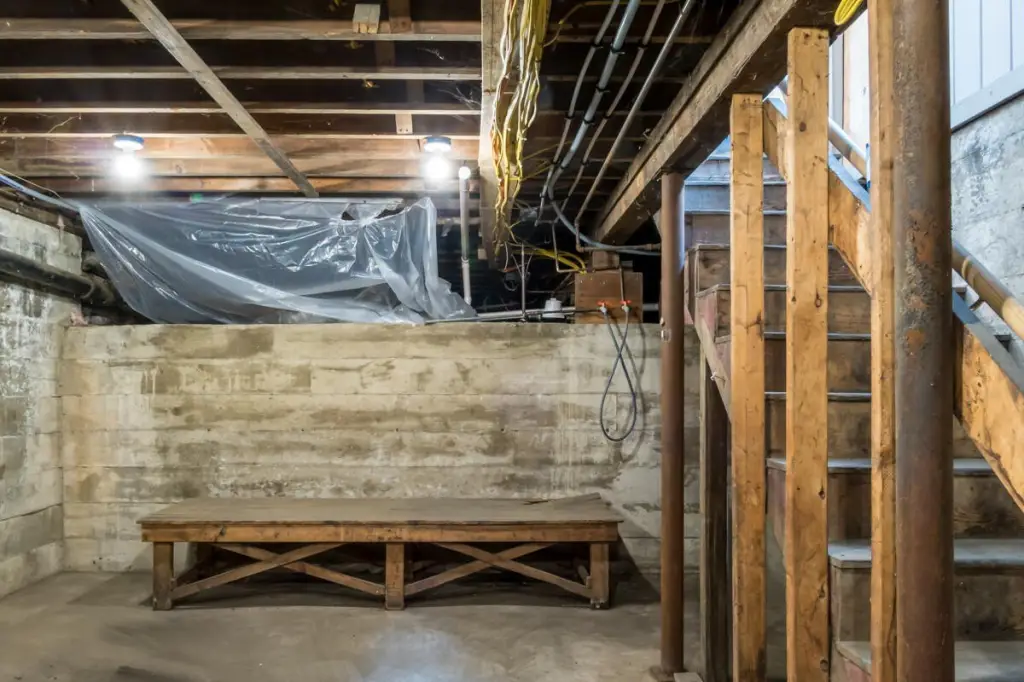
Unfinished, Full, Crawl Space
Lot features
Open, Corner Lot, Level, Intown, Near Shopping, Near Turnpike/ Interstate, Neighborhood, Shopping Mall
Standard status
Active
Size
2,696 SF
Lot size
0.14 Acres
Taxes and HOA fees
Tax Year
2025
Tax Annual Amount
6123
Utilities
Sewer type
Public Sewer
Heating system
Hot Water(Heating), Other (Heating), Oil
Water source
Public
Building Details
Year built
1900
Number of units
2
Flooring type
Laminate, Vinyl
Building materials
Wood Frame, Vinyl Siding
Roof type
Shingle, Flat
Additional Structures
Outbuilding
Listing Agency:
EXP Realty
(888) 439-8743
Listed By:
Brett Davis
(207) 865-9919
Added: Sep 4
Changed: Oct 19
Last Checked: Oct 23 at 9:06AM
MLS# 1679411
Copyright © 2026 Maine Listings. All rights reserved. All information provided by the listing agent/broker is deemed reliable but is not guaranteed and should be independently verified.

Ask AI about this property
Review the available facts, identify missing information and prepare questions for the agent.
Investment Insights
Based on property information with market context.
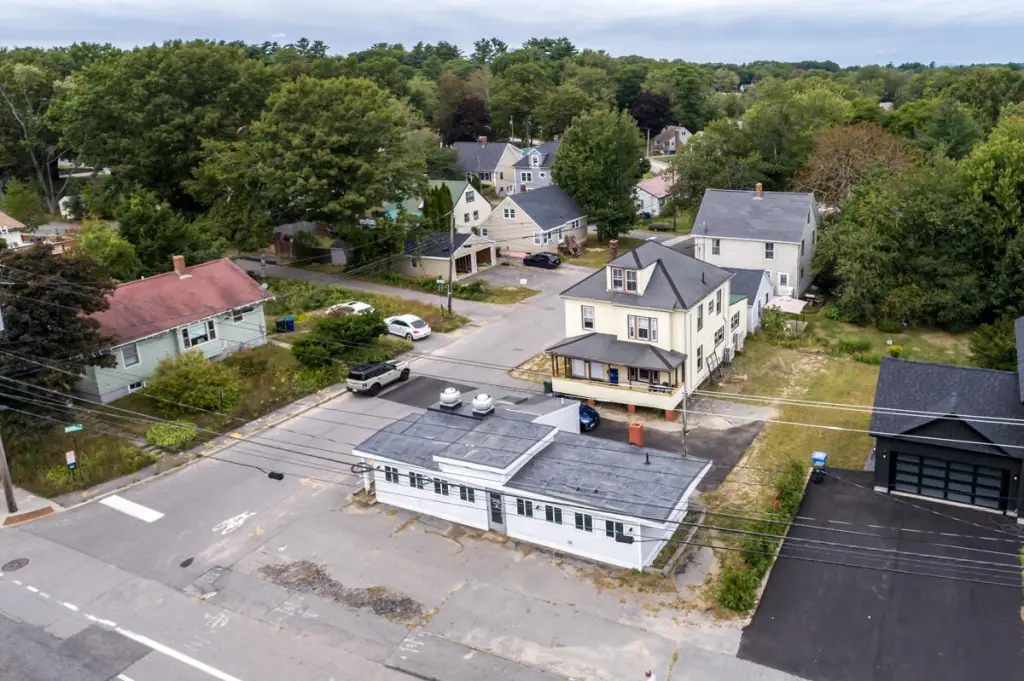
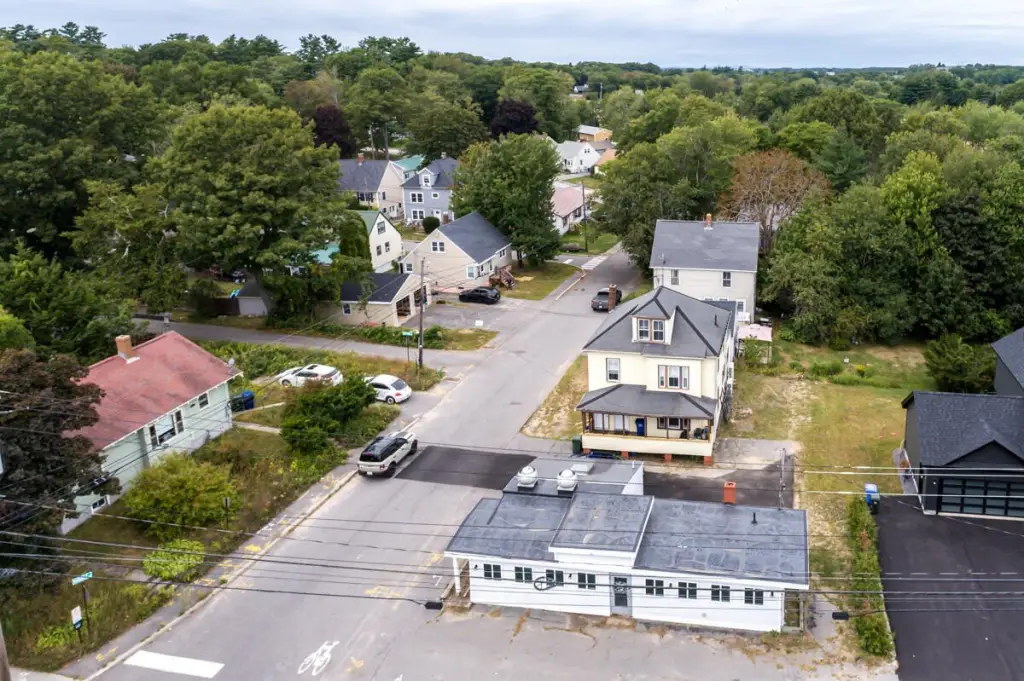
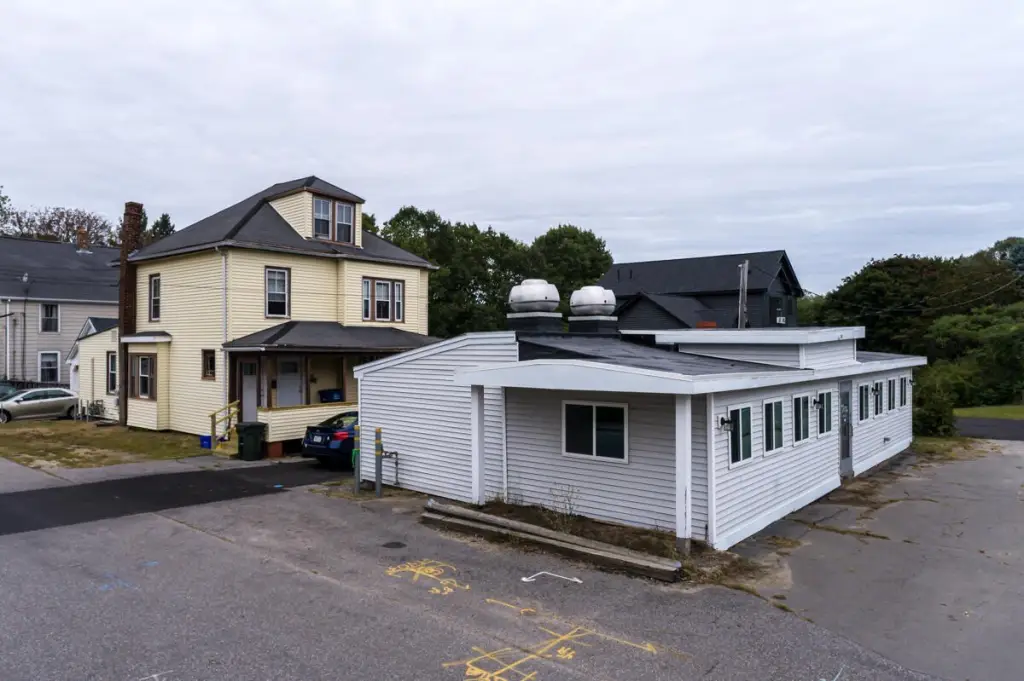
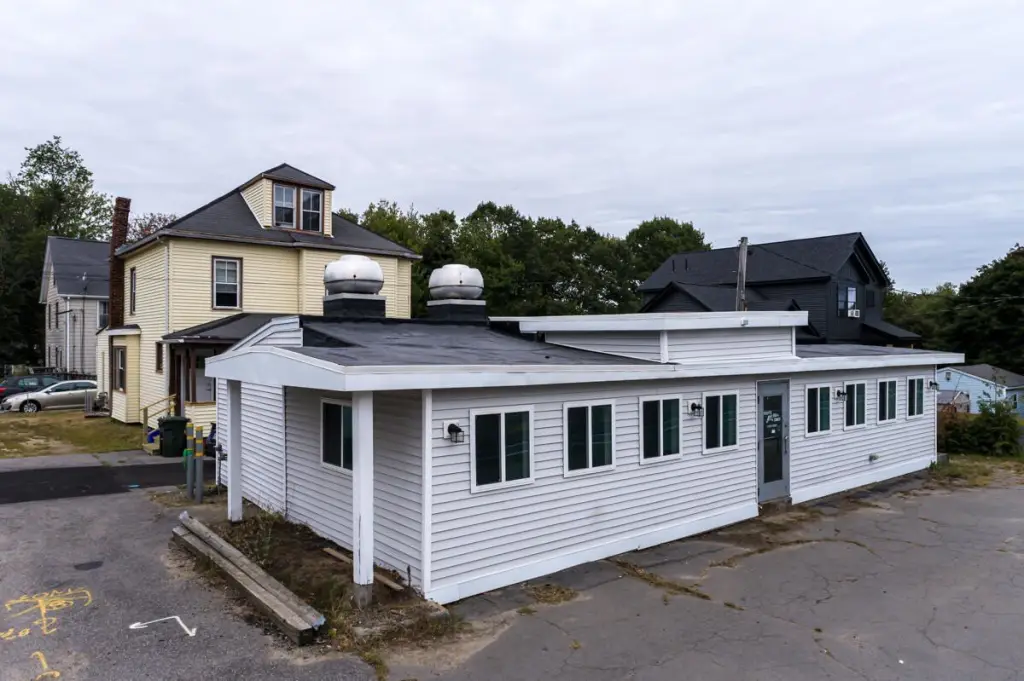
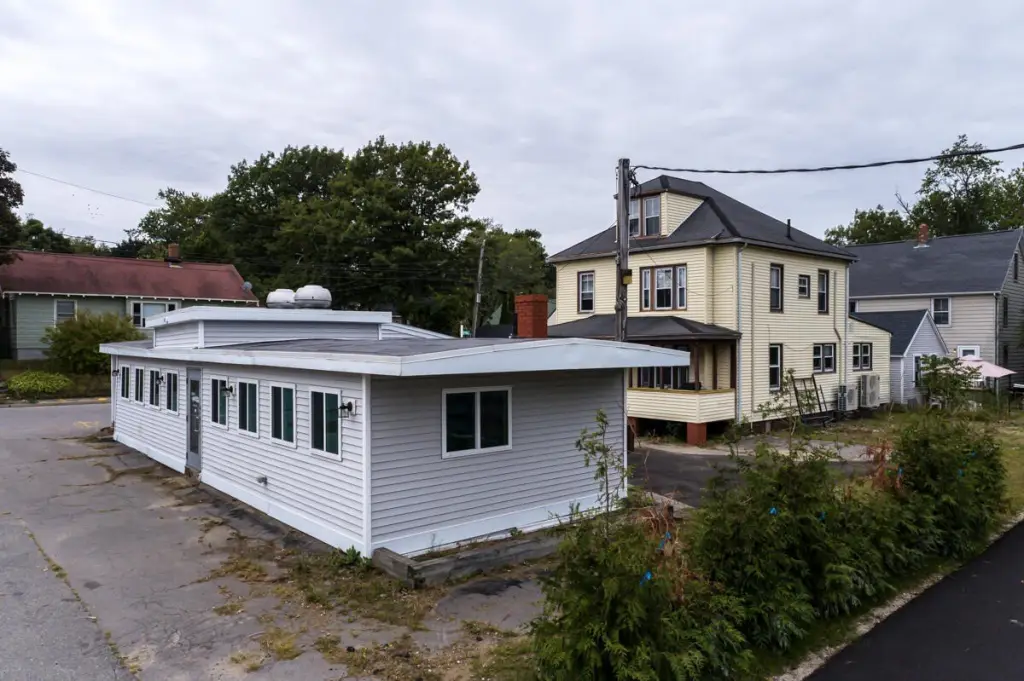
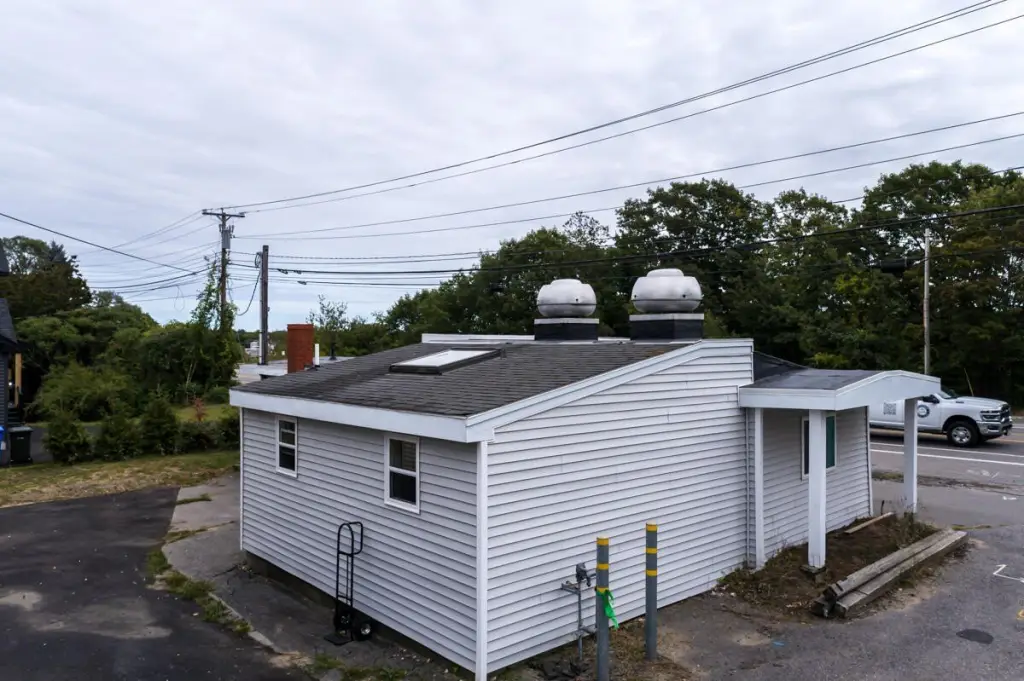
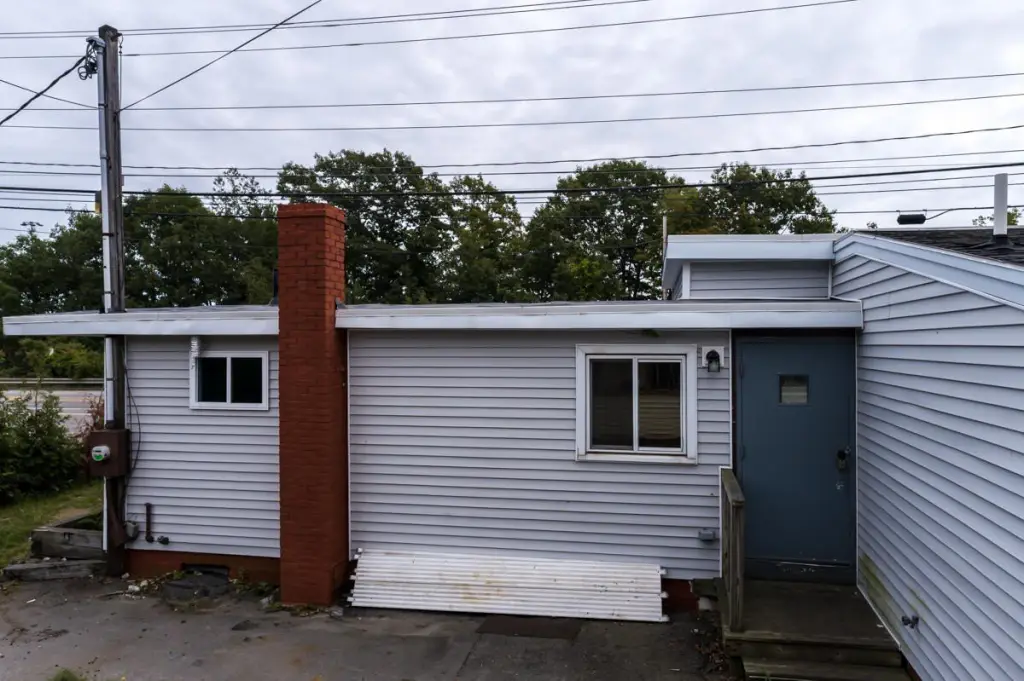
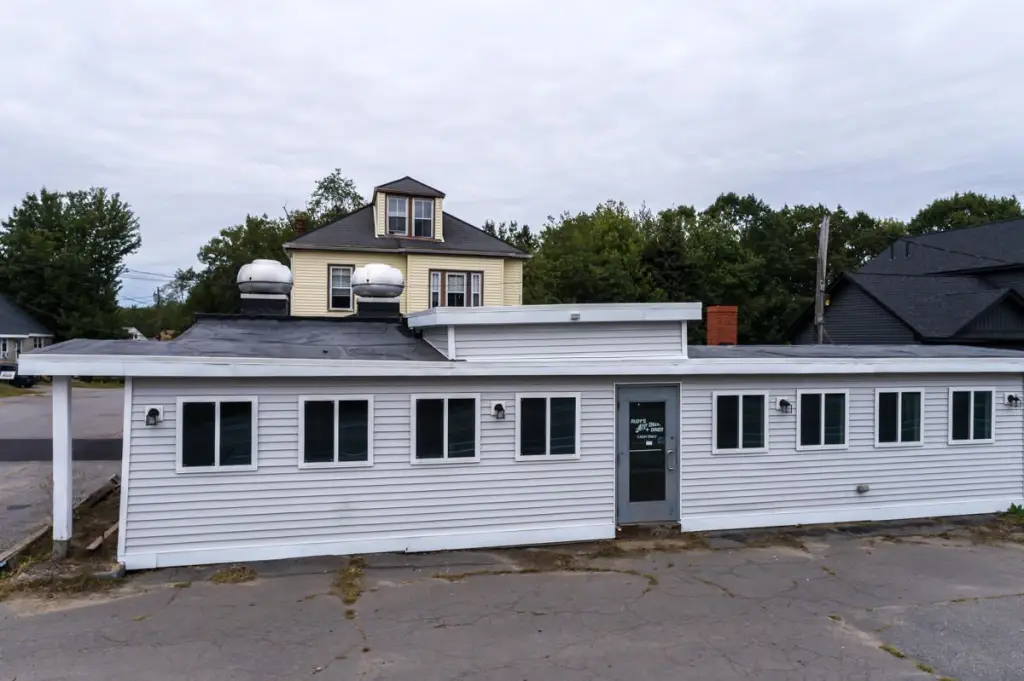
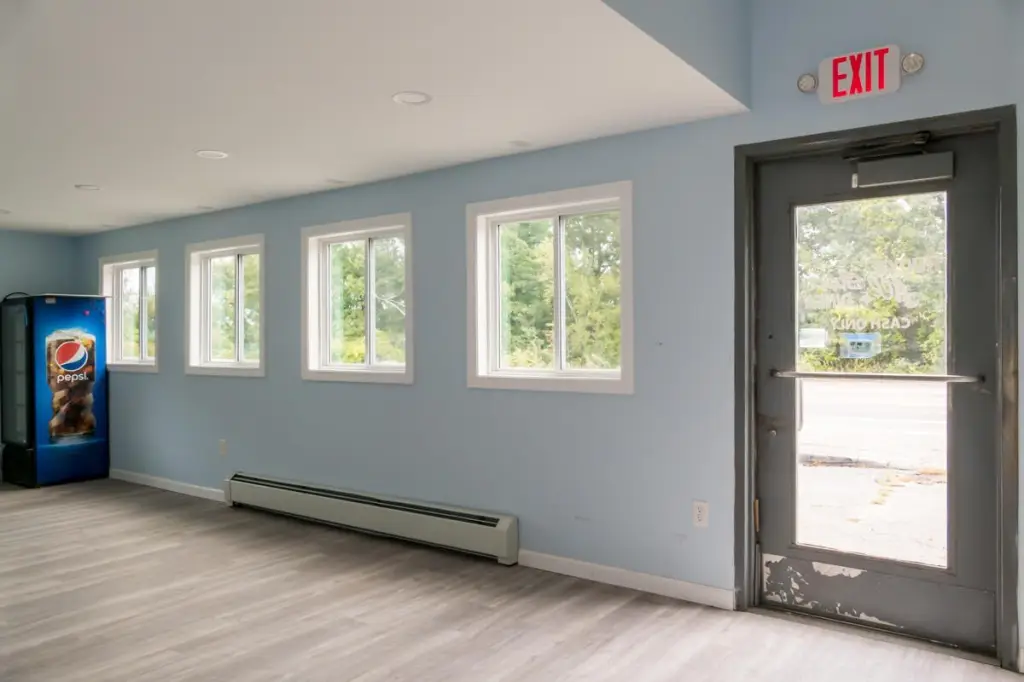
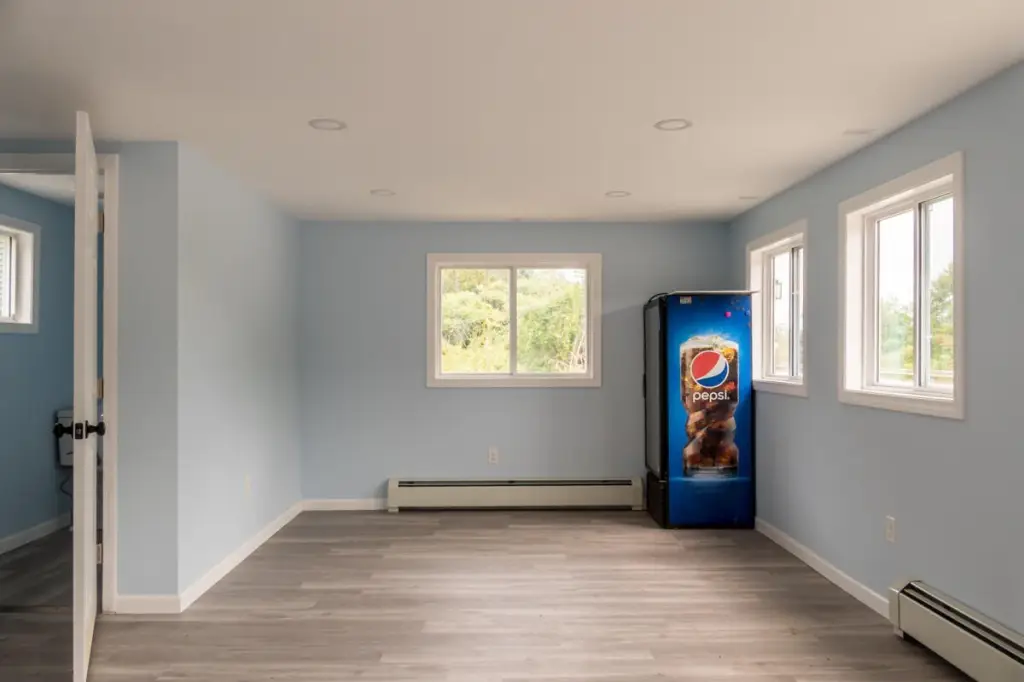
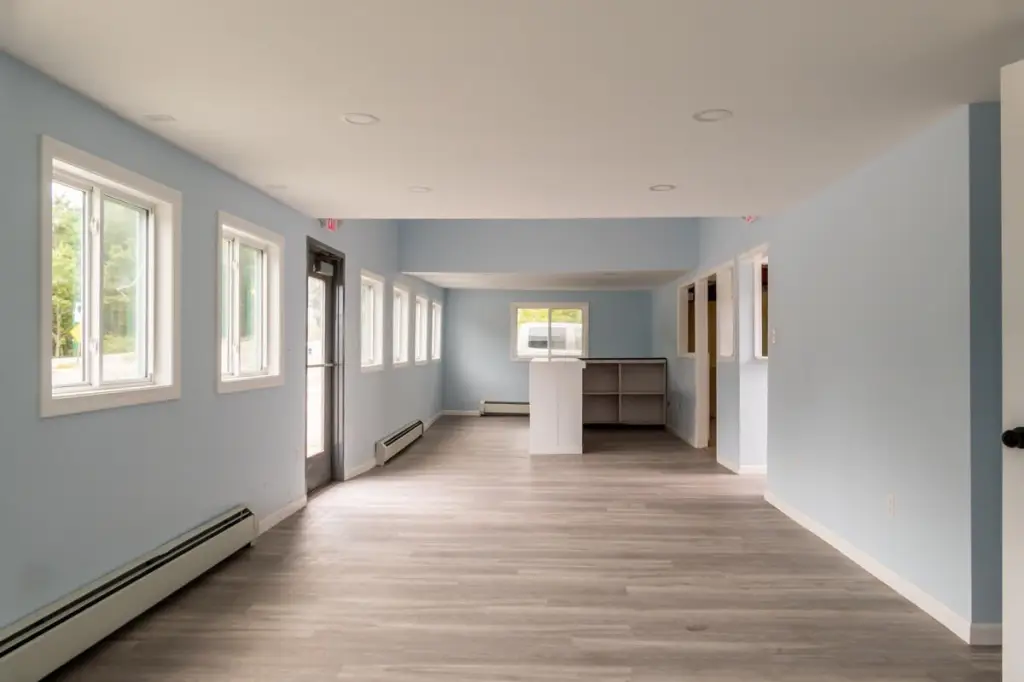
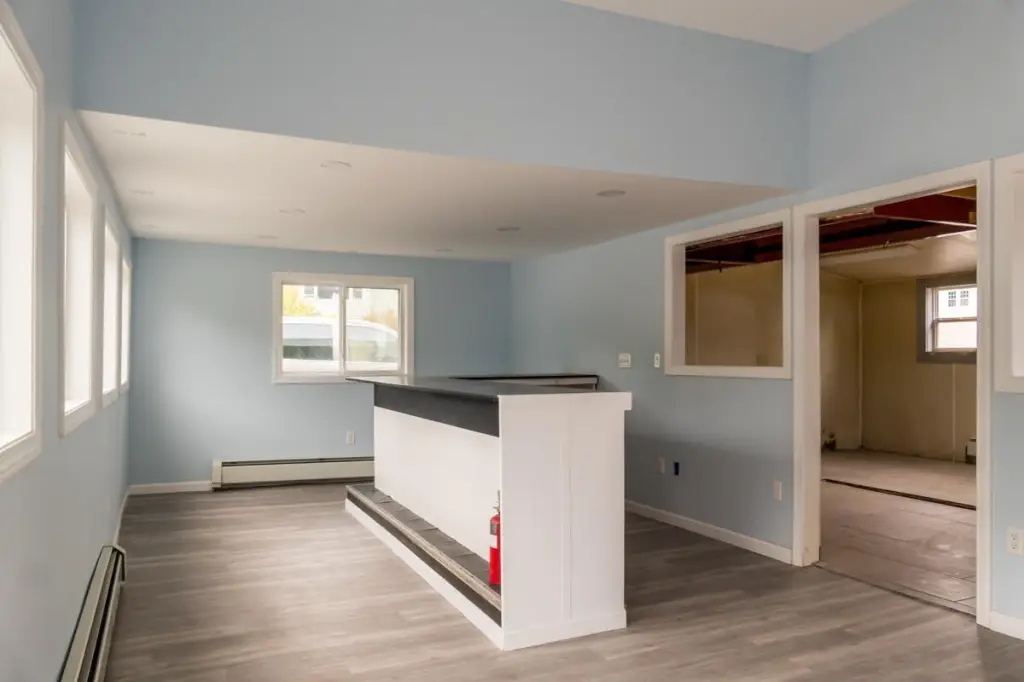
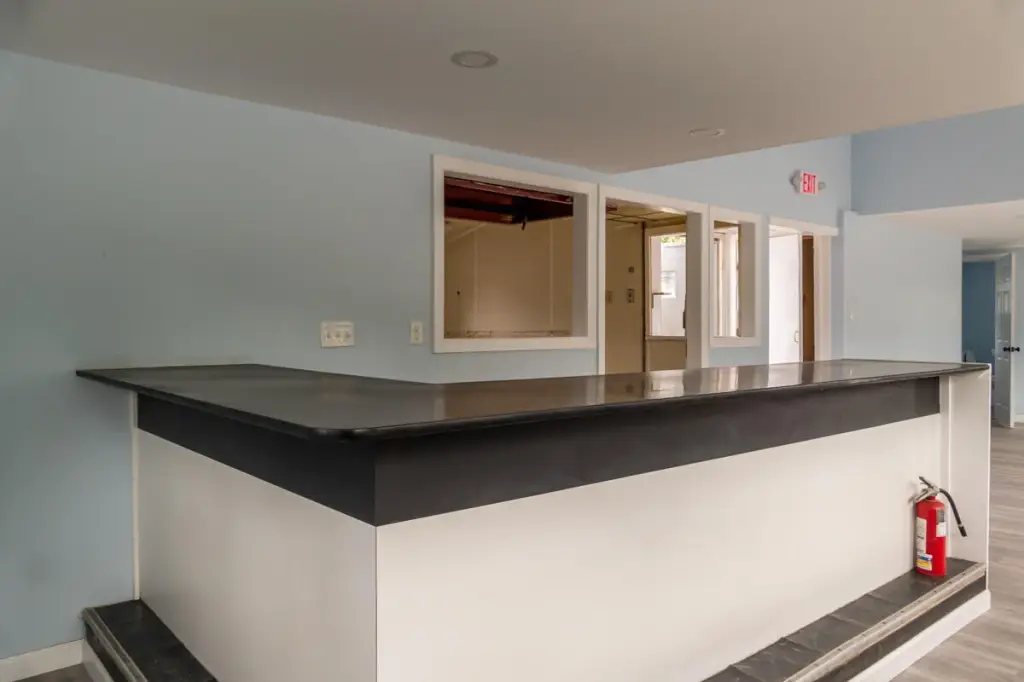
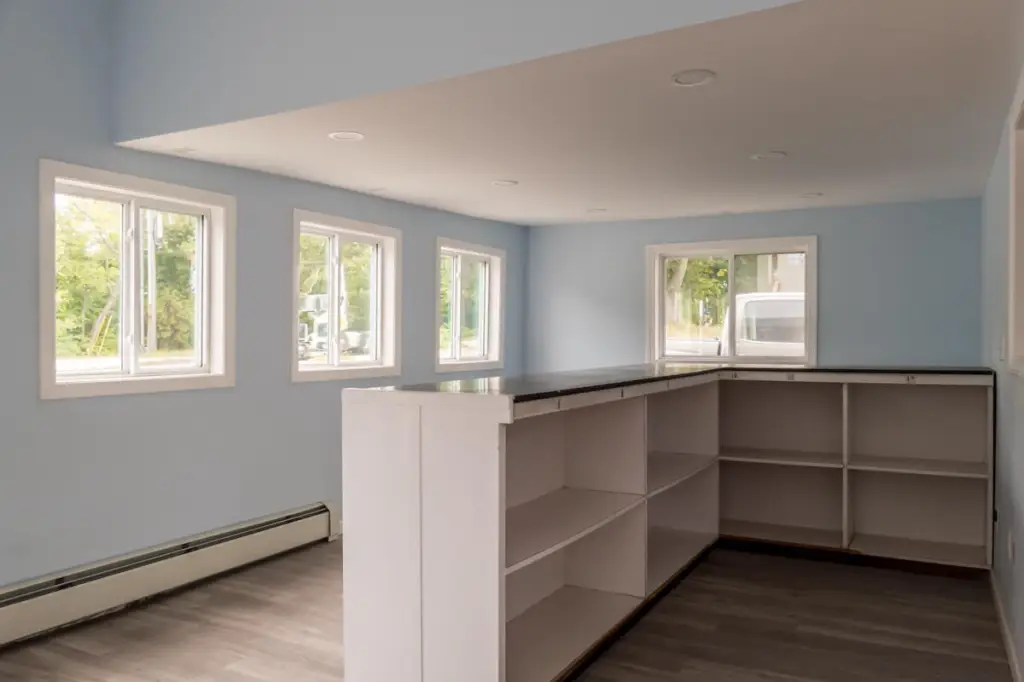
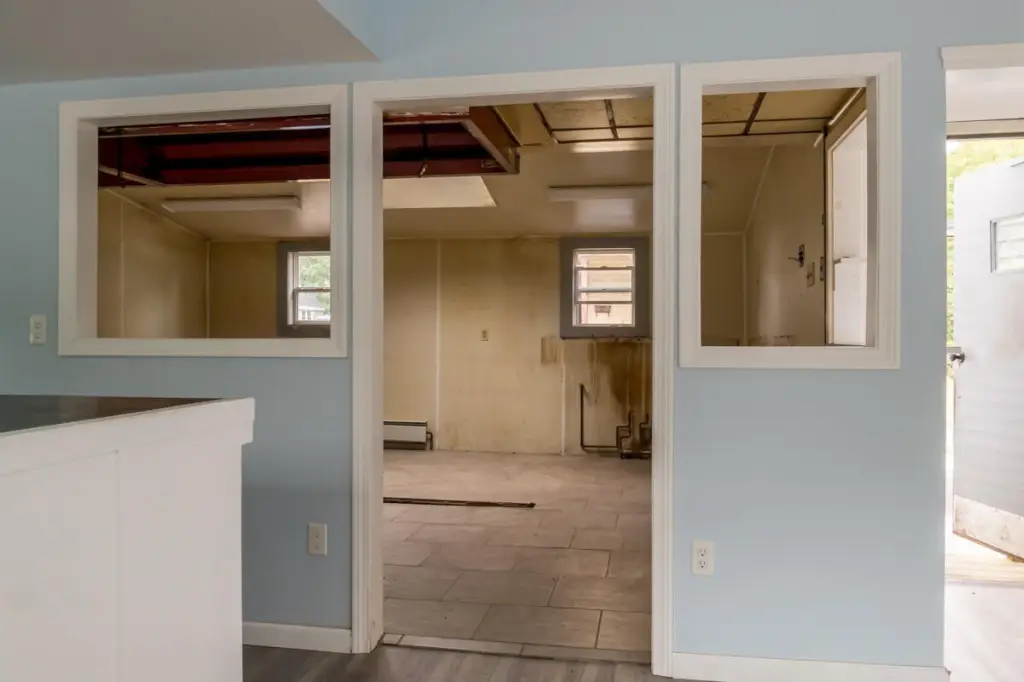
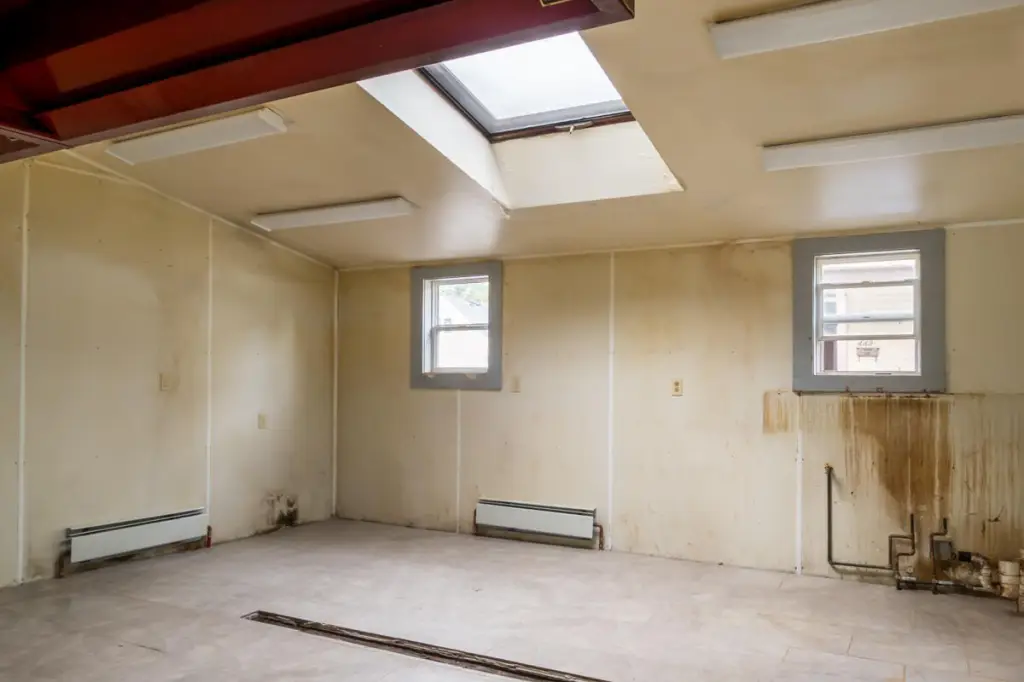
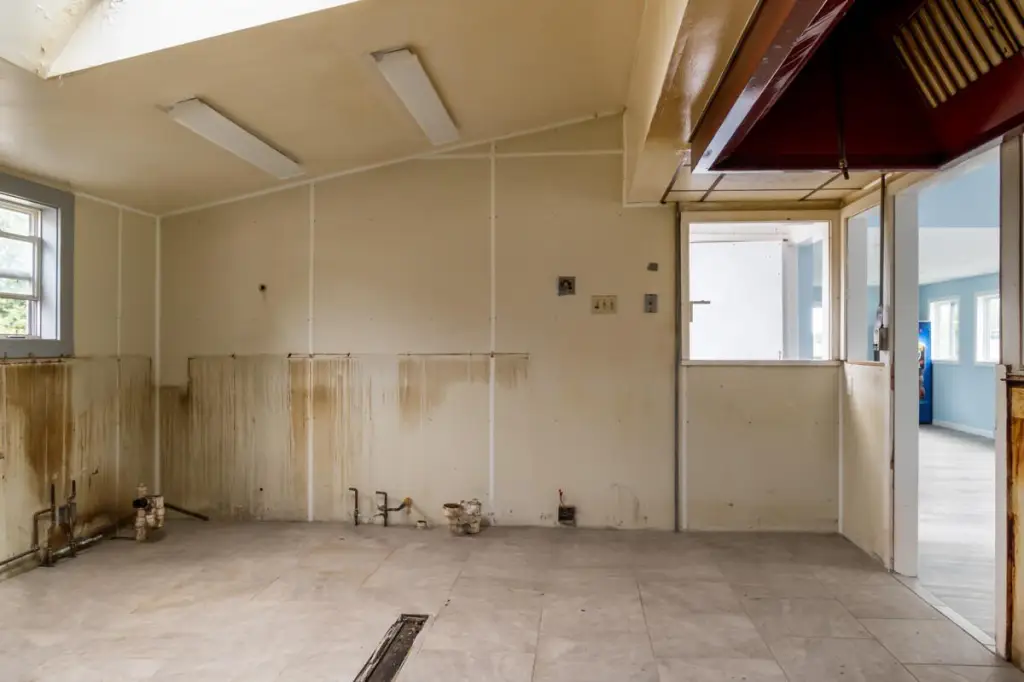
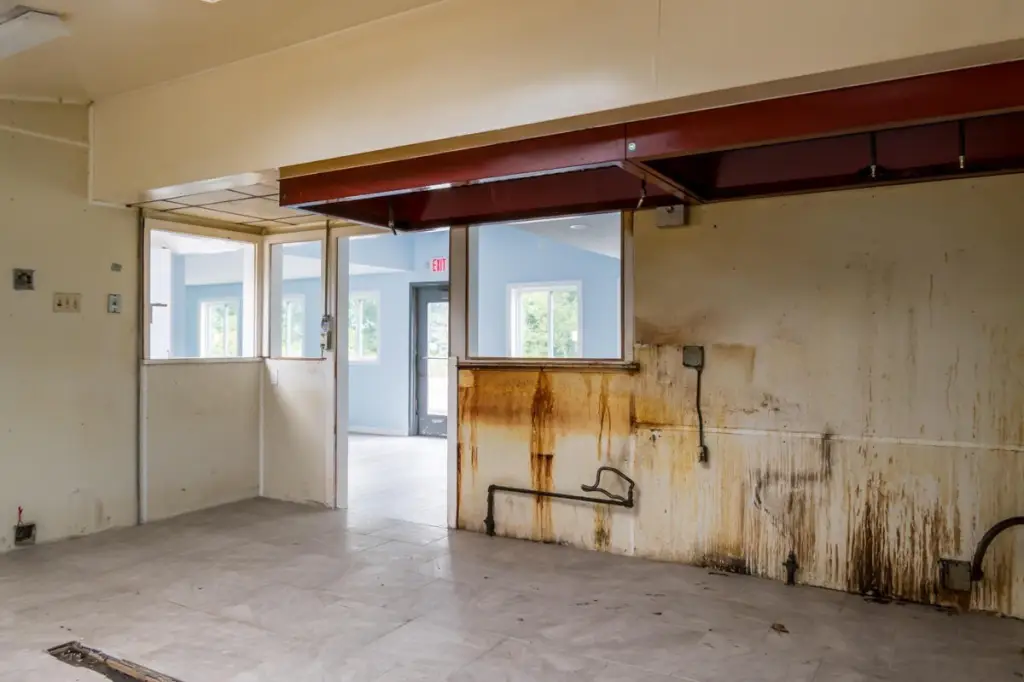
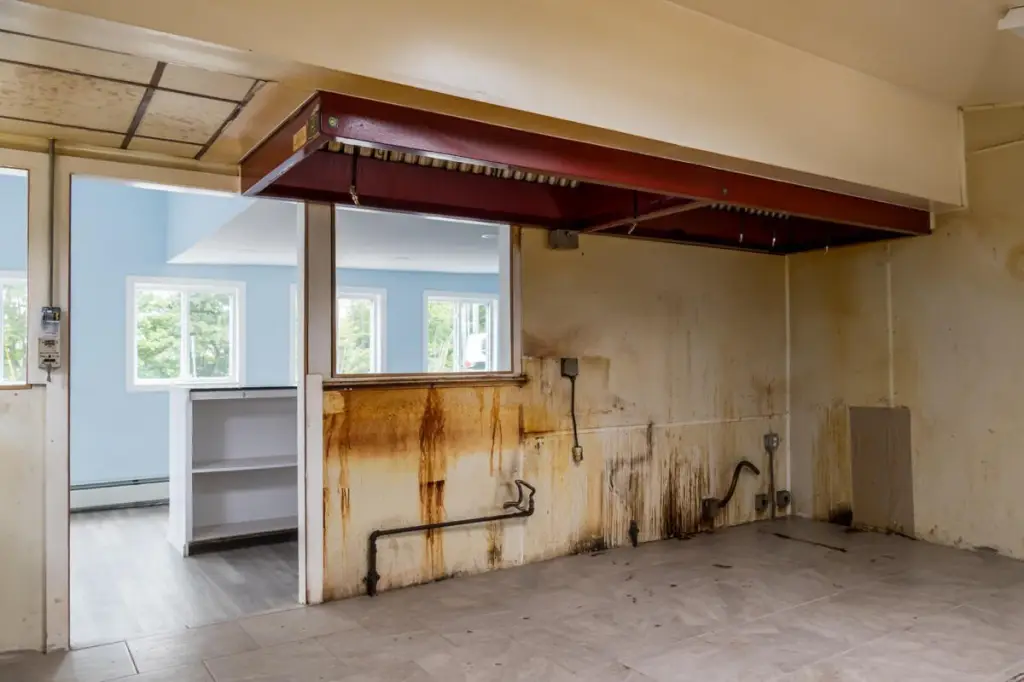
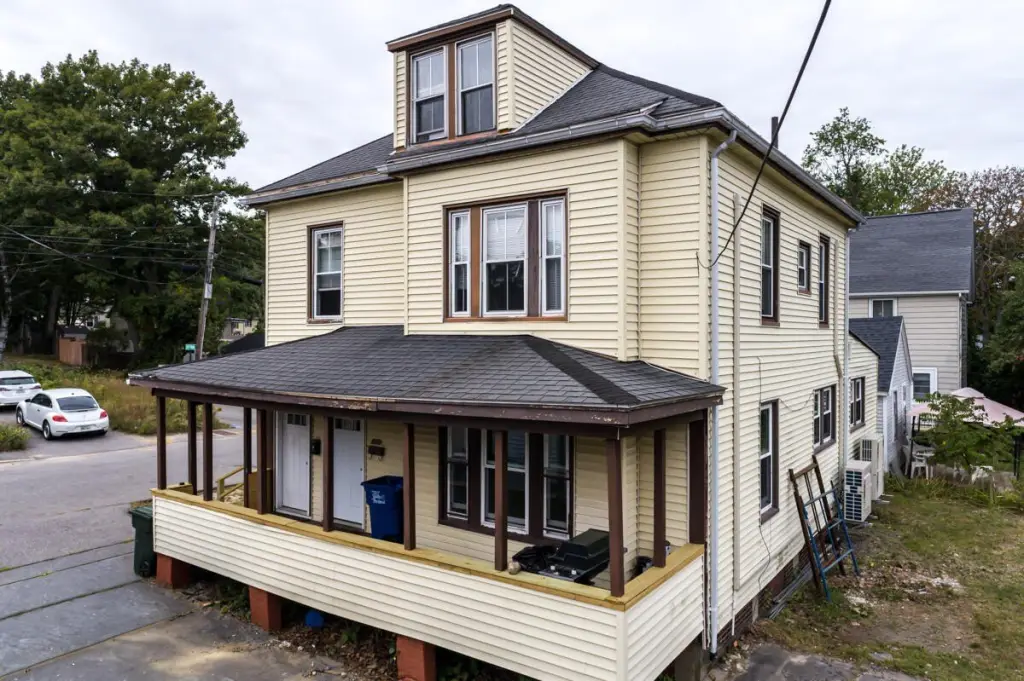
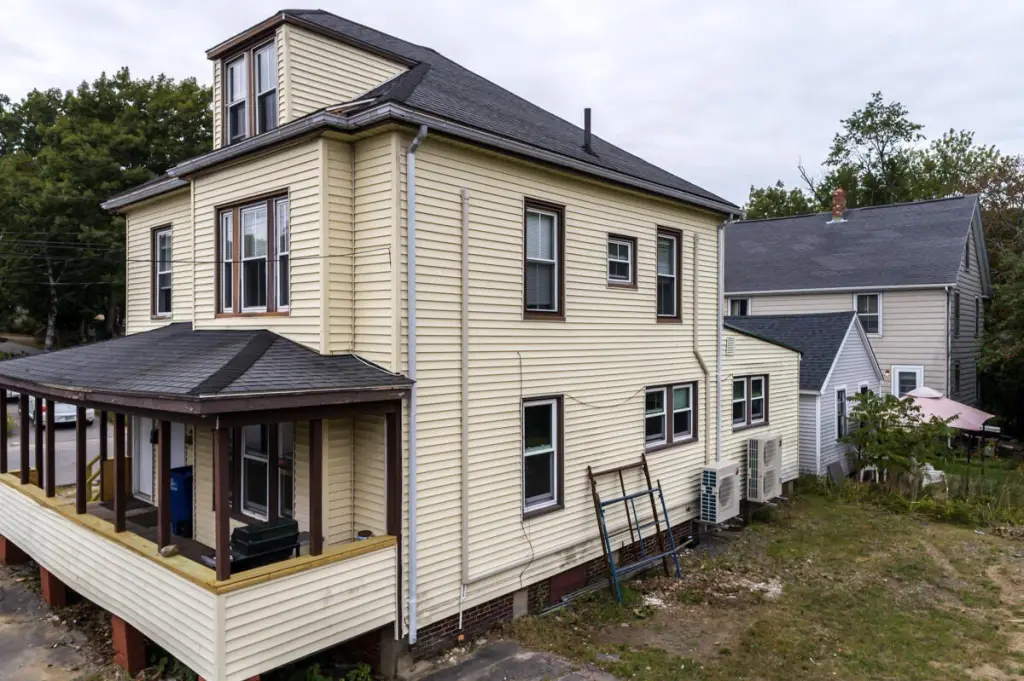
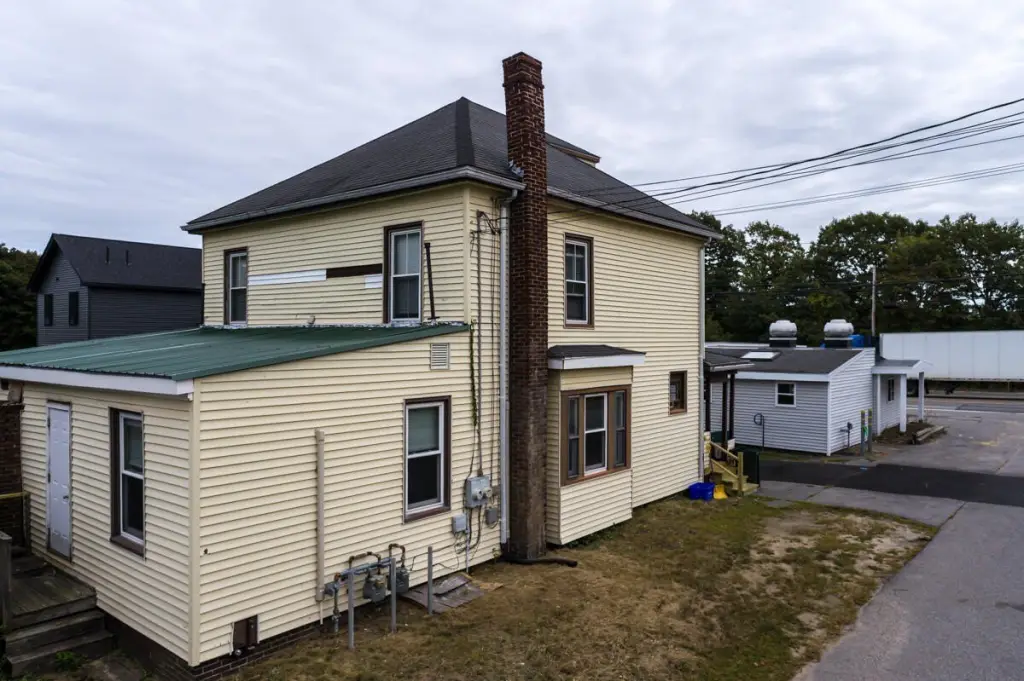
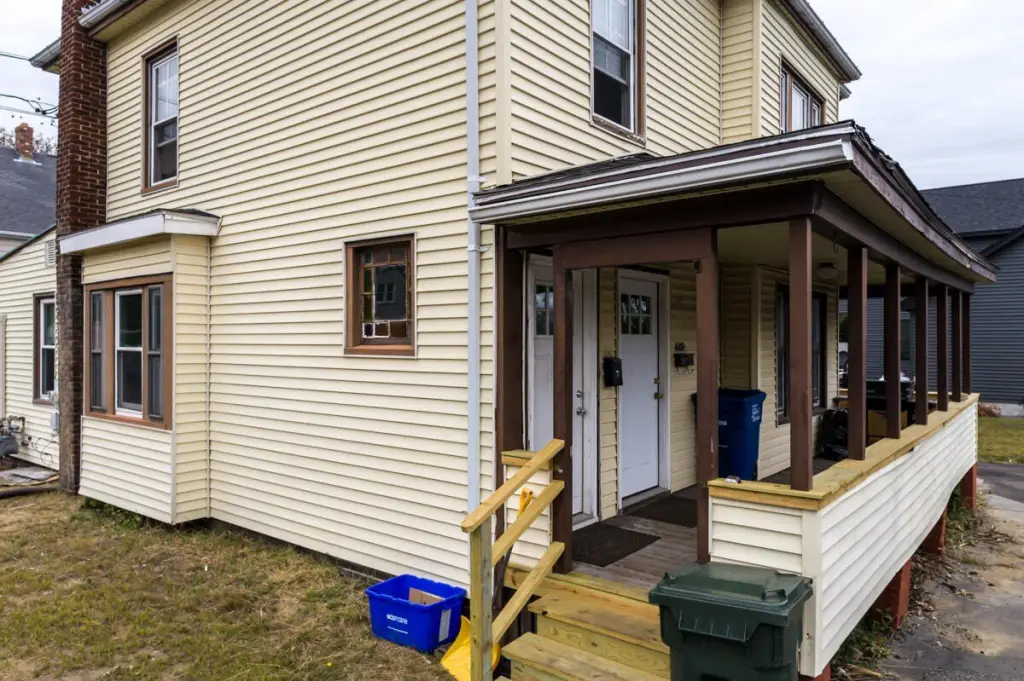
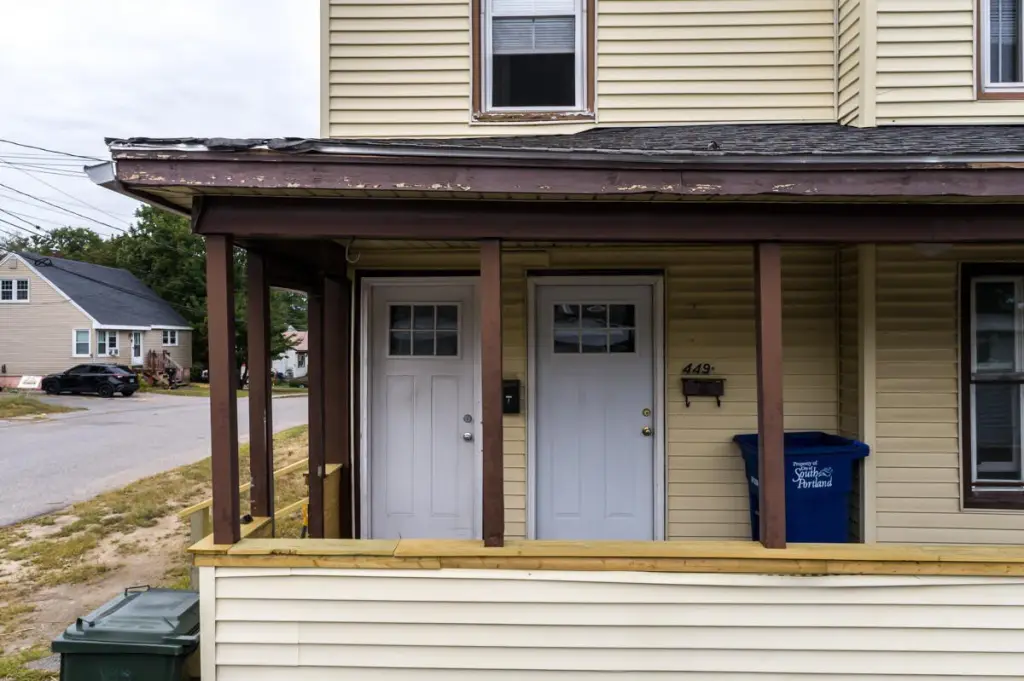
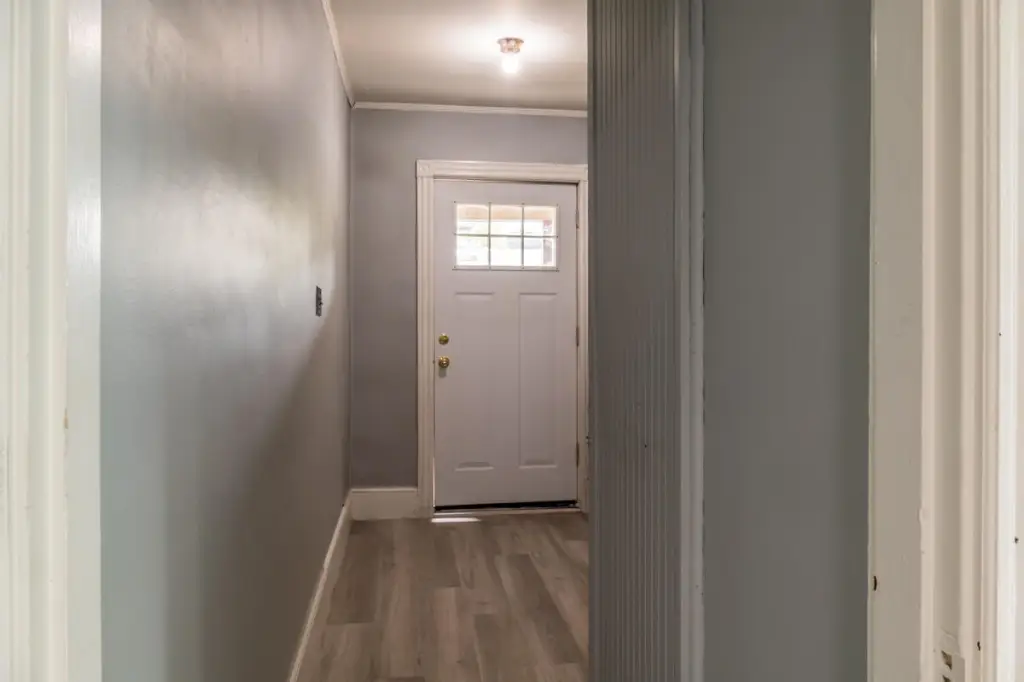
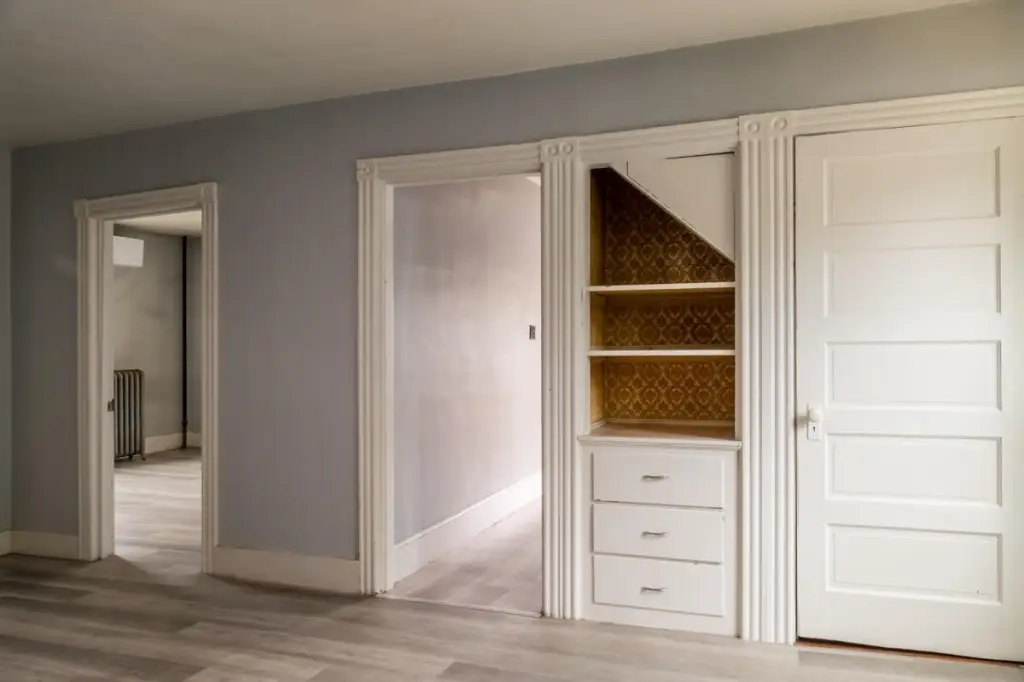
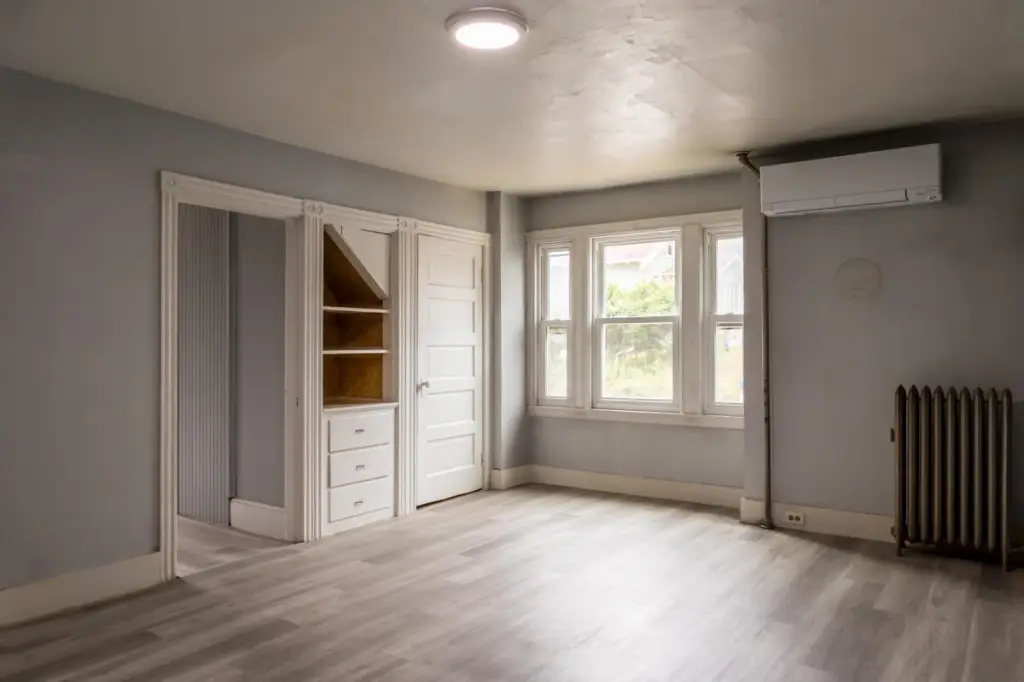
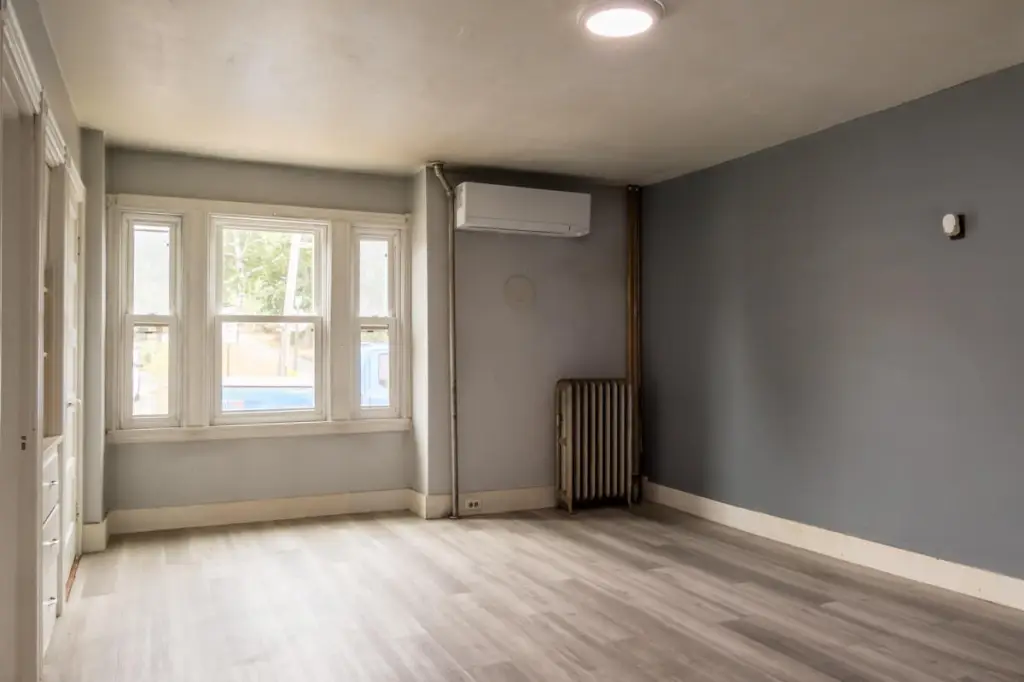
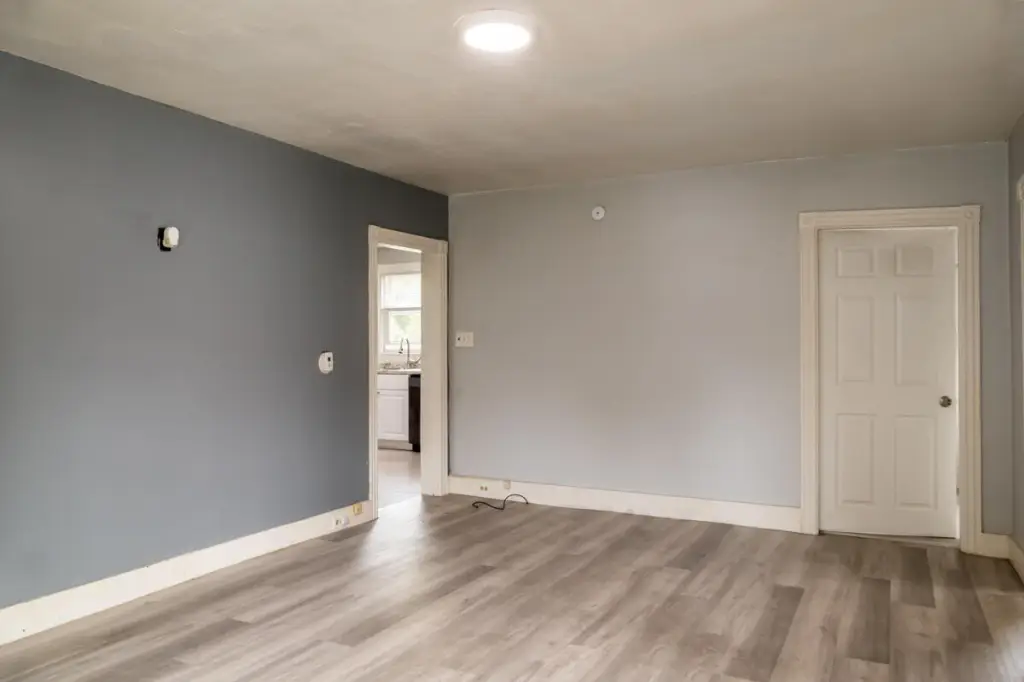
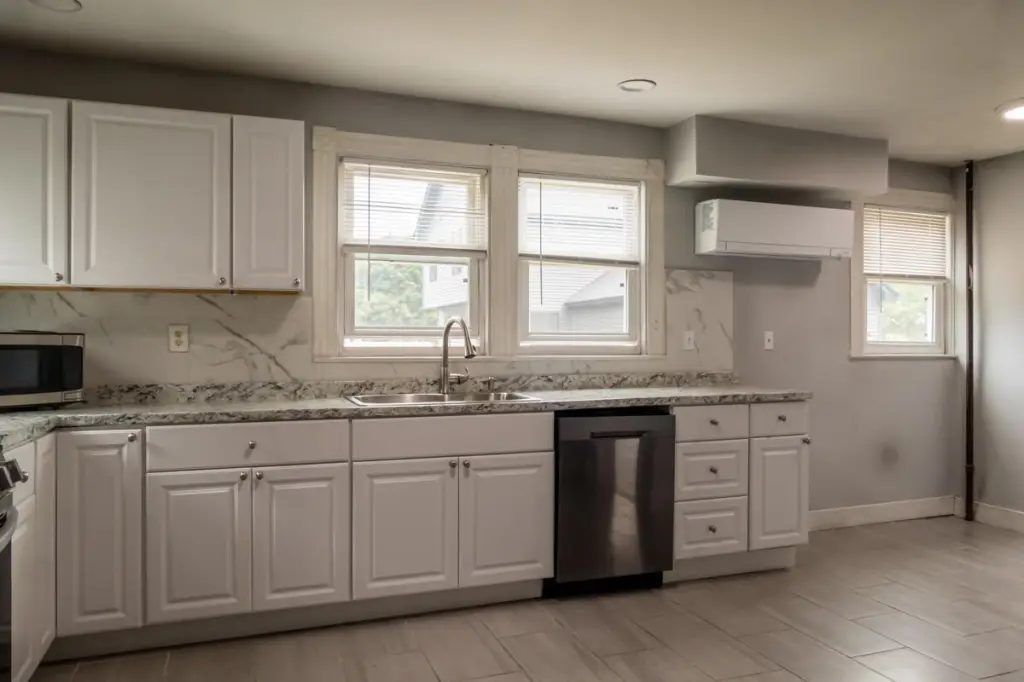
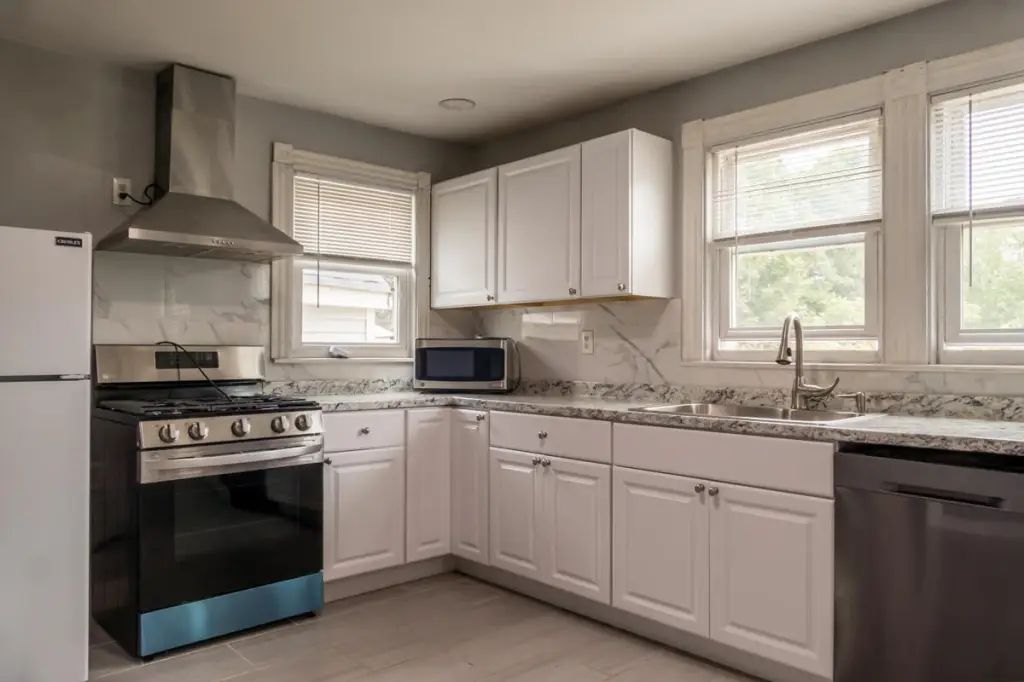
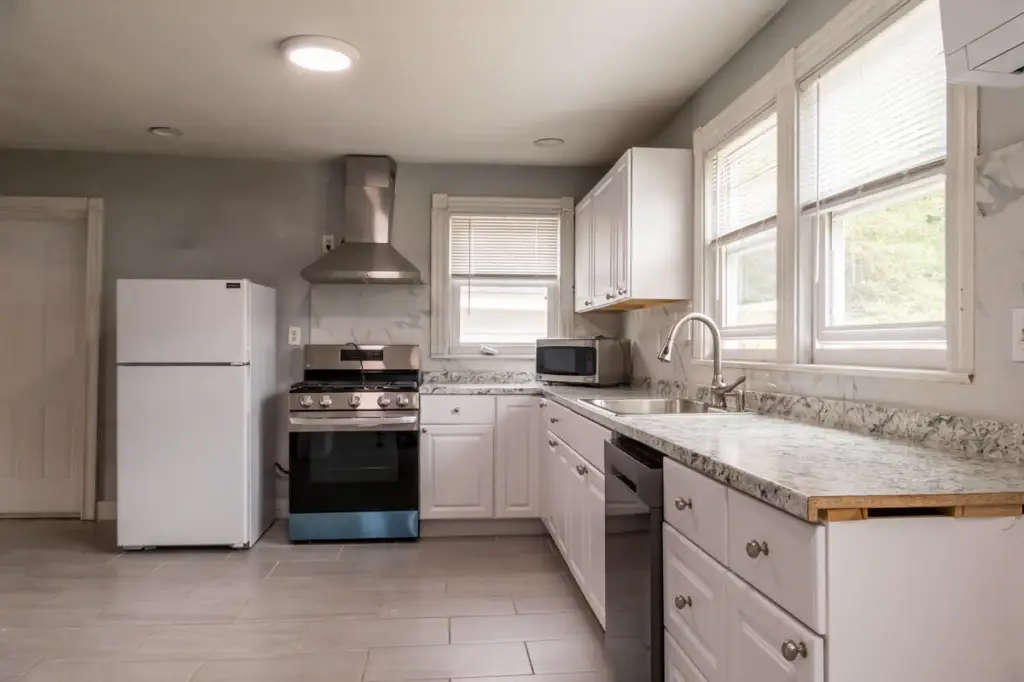
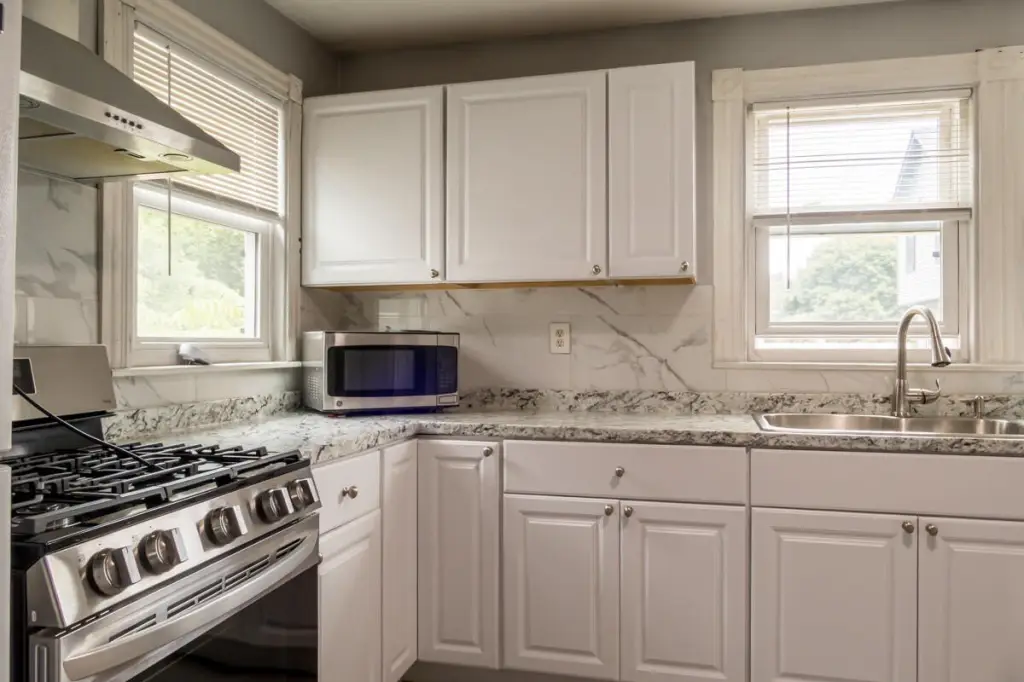
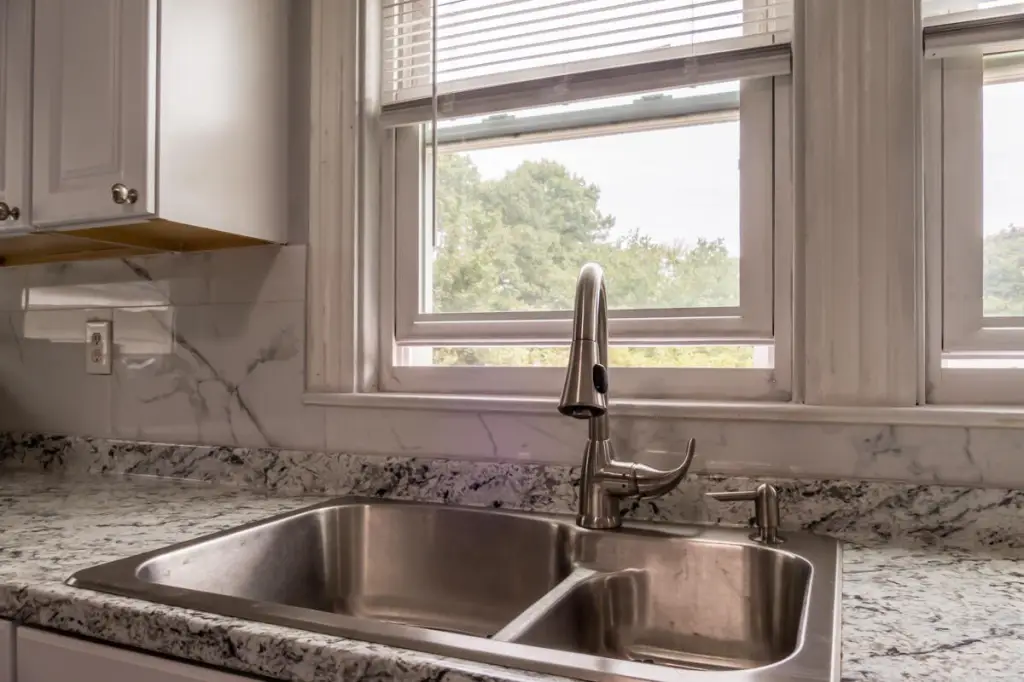
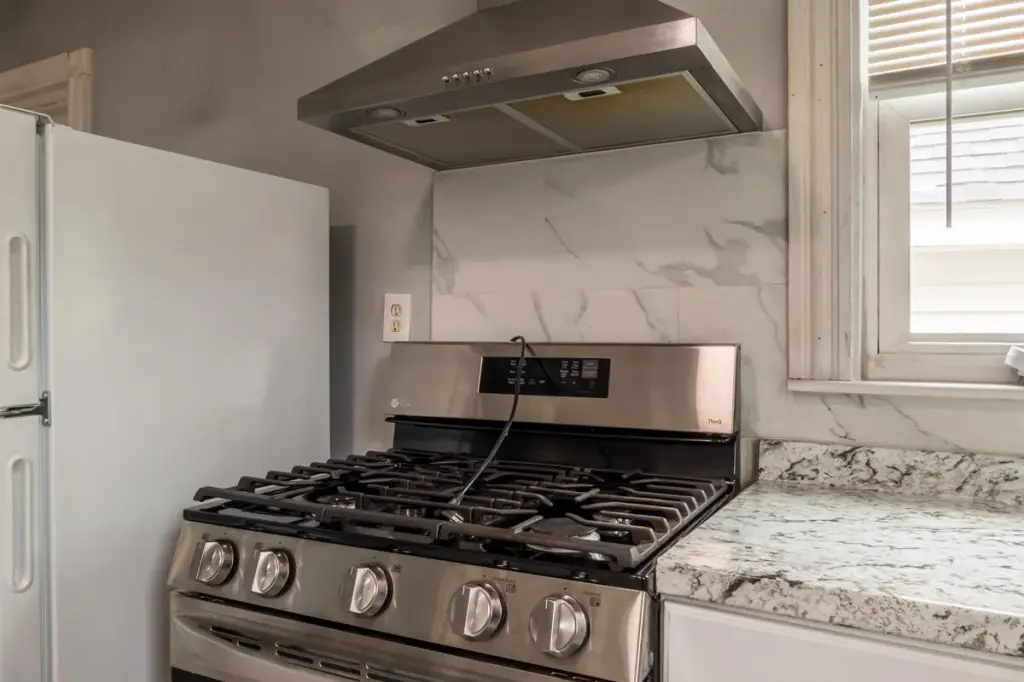
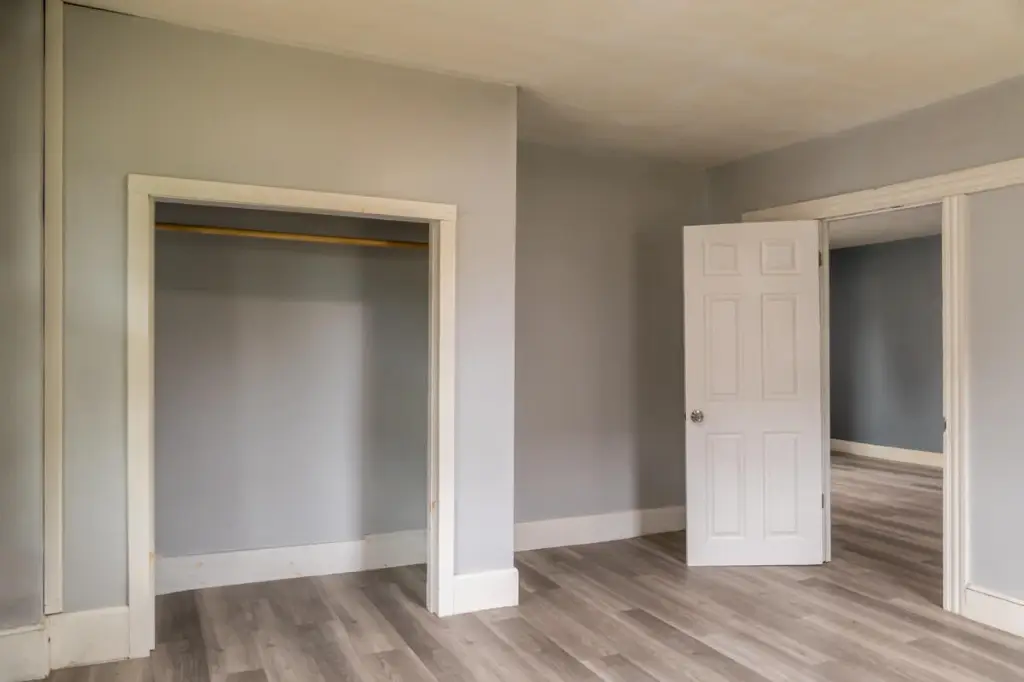
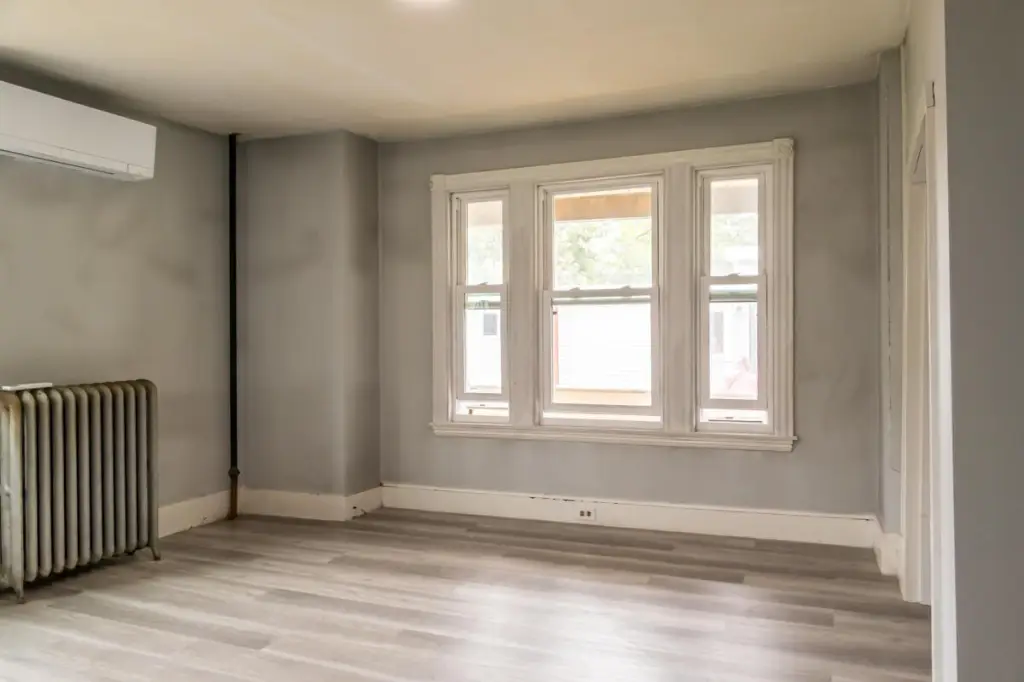
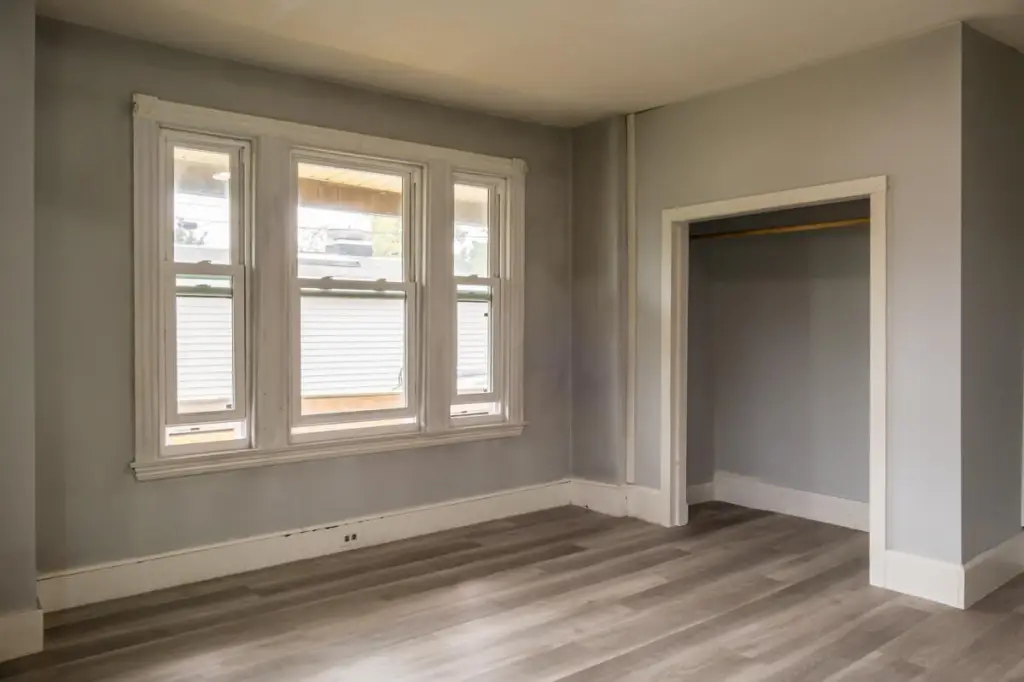
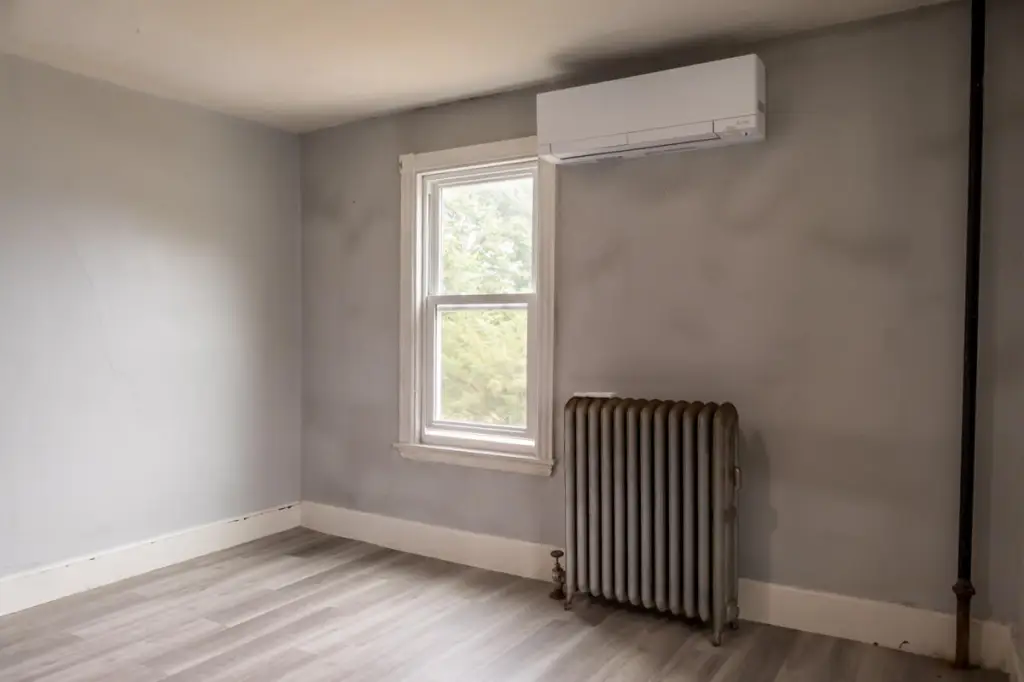
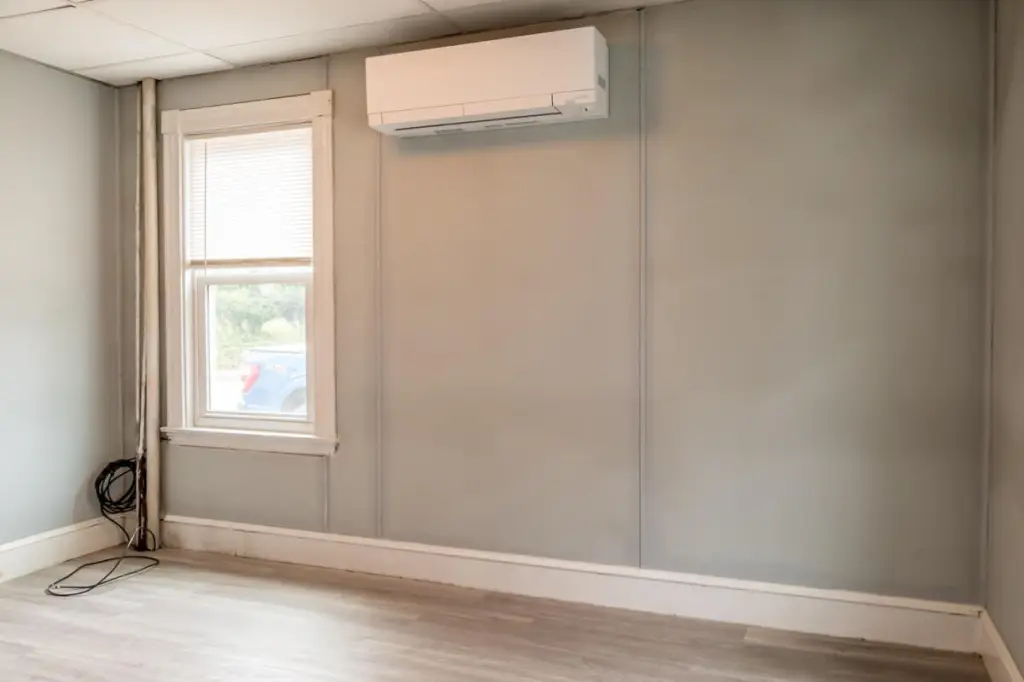
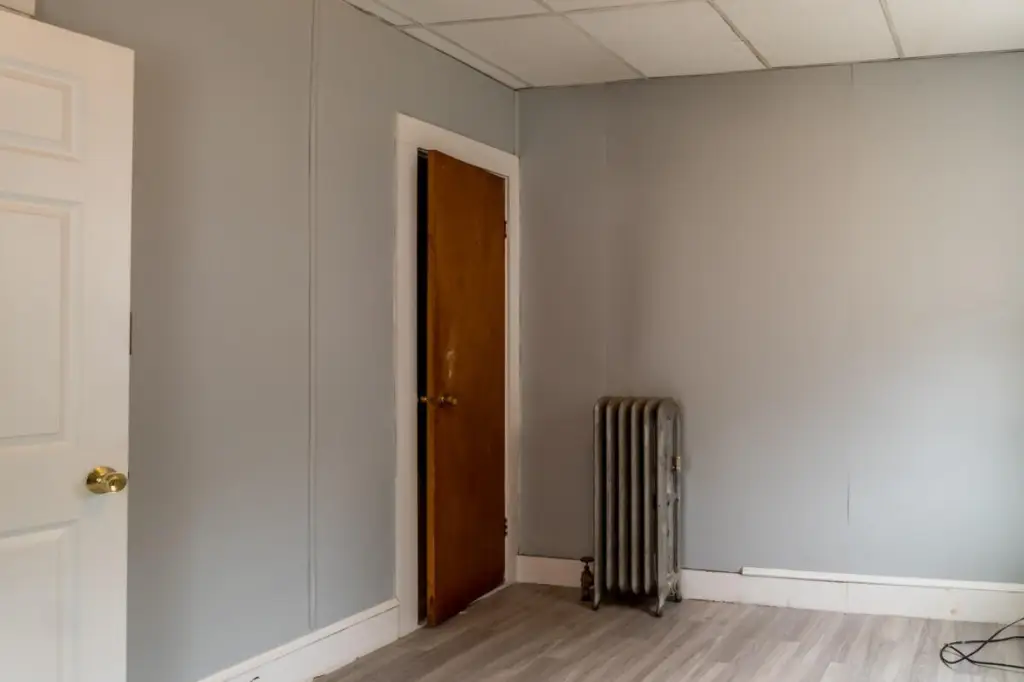
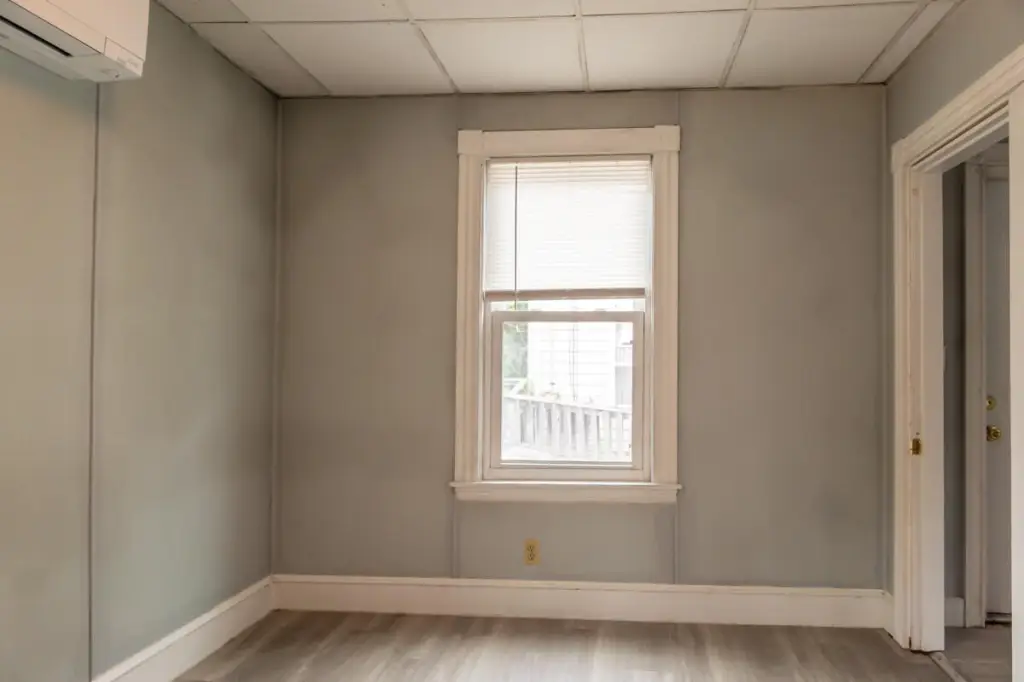
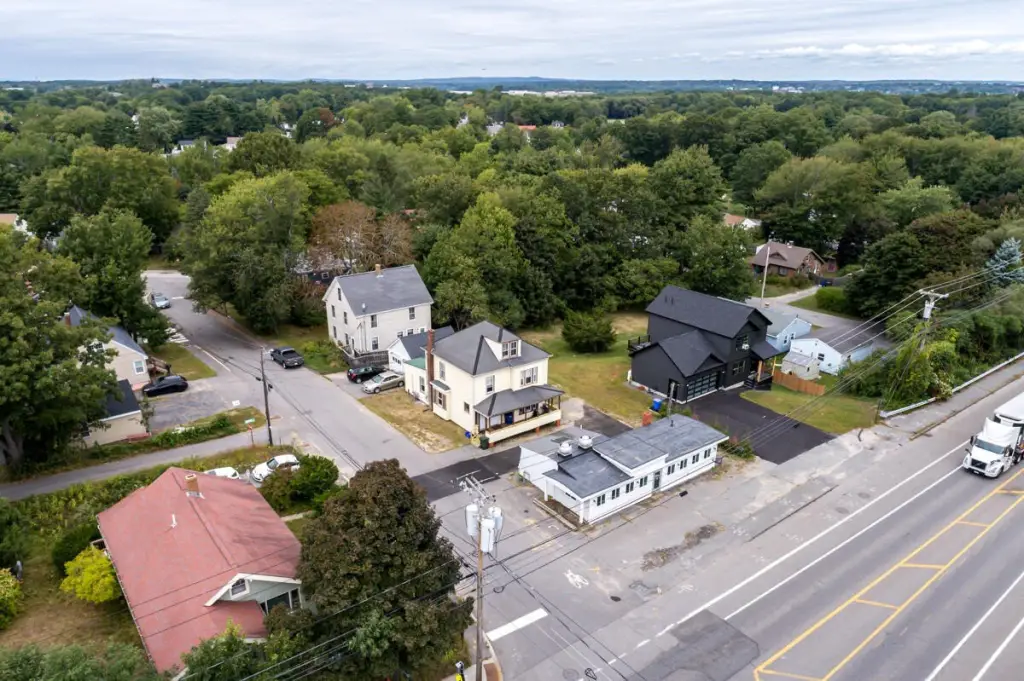
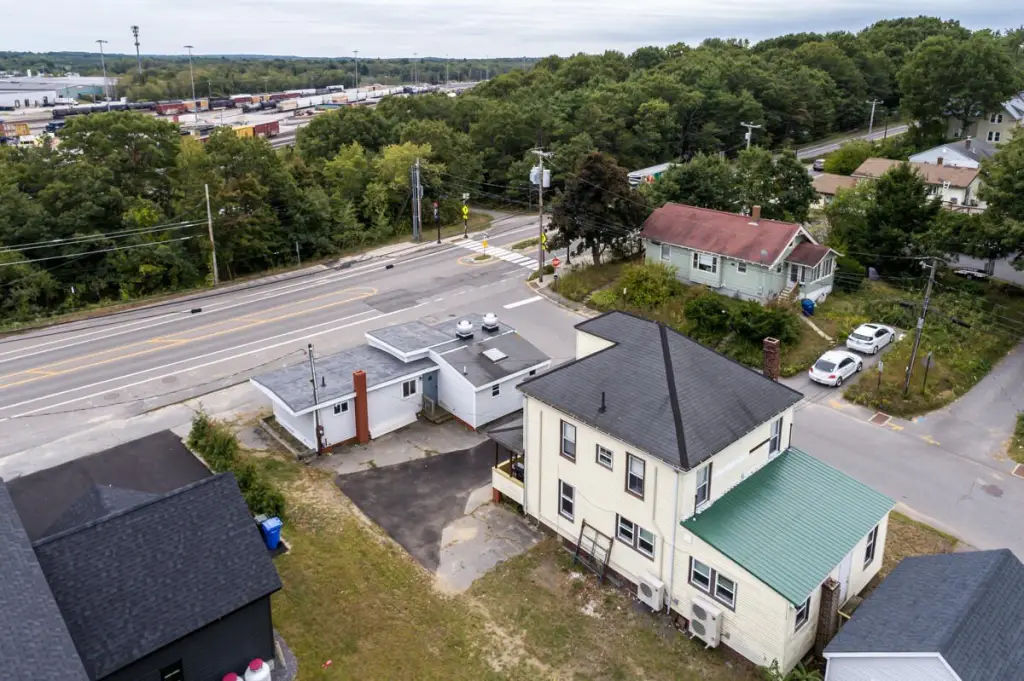
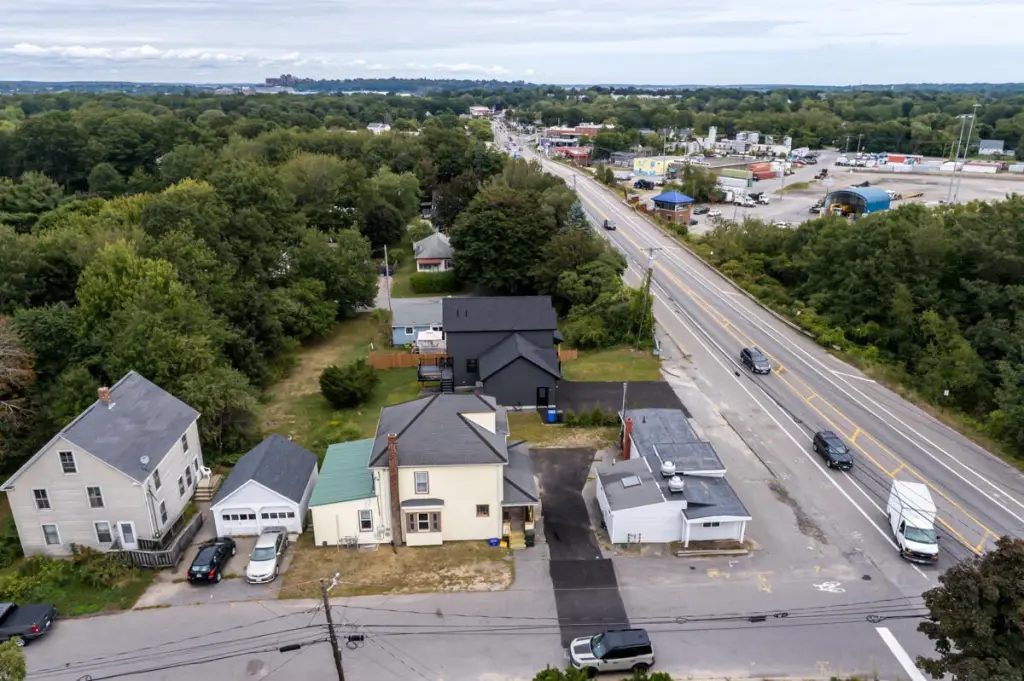
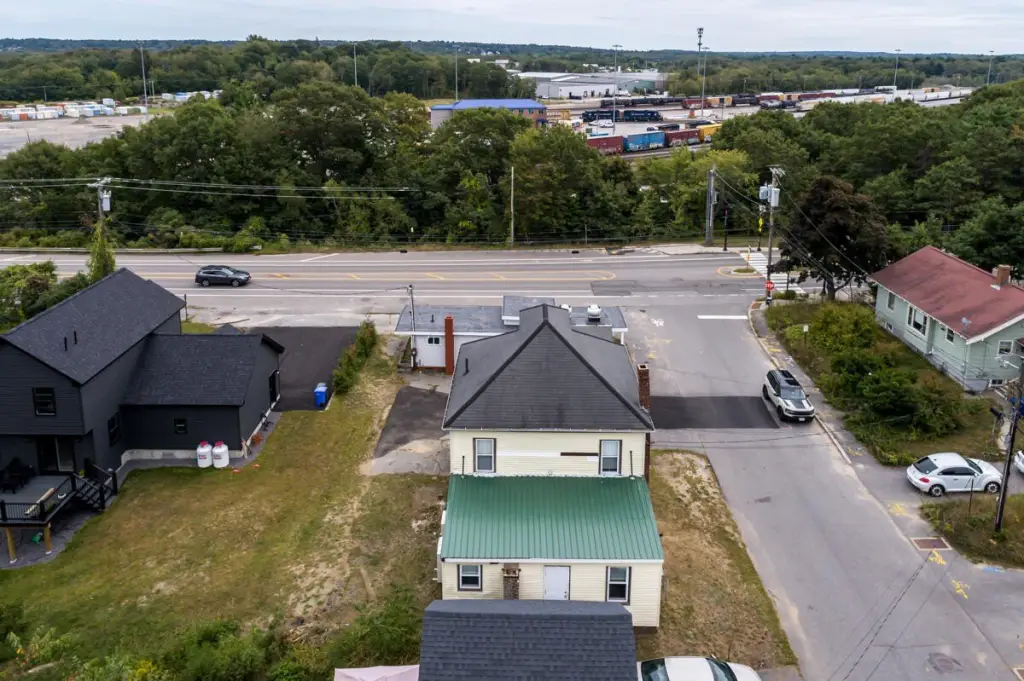
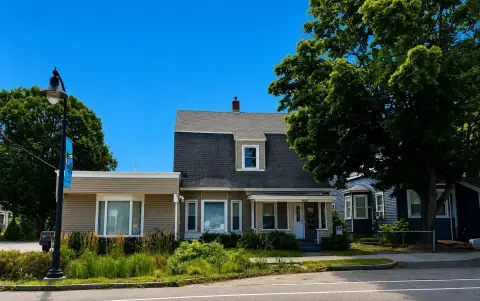
This 2,696-square-foot duplex property includes two residential units within one of two buildings on a 0.14-acre corner lot. The first-floor residence has two bedrooms and recent updates, while the second-floor unit has one bedroom and is currently rented. The adjacent building was formerly used as a restaurant and provides additional enclosed space for redevelopment, subject to applicable zoning, permitting, and code requirements.
Located at 449 Main Street in South Portland, the property has Residential Zone A zoning, public water, and public sewer. Parking is available both on site and along the street. The 1900-built property also includes a porch, attic, wood-frame construction, vinyl siding, and a combination of shingle and flat roofing.
Located at 449 Main Street in South Portland, the property has Residential Zone A zoning, public water, and public sewer. Parking is available both on site and along the street. The 1900-built property also includes a porch, attic, wood-frame construction, vinyl siding, and a combination of shingle and flat roofing.
Key Highlights
- Two residential units in a 2,696‑square‑foot duplex
- Additional building formerly used as a restaurant
- 0.14‑acre corner lot at 449 Main Street
Financial Insights
Estimated NOI and Cap Rate
NOI / Yr
$44,324
Cap Rate
8.88%
Suggested Prices Based on Cap Rates
Cap Rate 5%
$886,480
$886.5K
Cap Rate 7%
$633,200
$633.2K
Cap Rate 9%
$492,489
$492.5K
Market Conditions
NOI Build-Up for 2,696 SF
Gross rent
$85.7K $31.80/SF
− Vacancy
−$5.1K −$1.91/SF
EGI
$80.6K $29.89/SF
− OpEx
−$36.3K −$13.45/SF
NOI
$44.3K $16.44/SF
Area
Cumberland County, ME
Vacancy
6.00%
Lease Rate
$31.80 /SF/Yr
Expense Ratio
45.00%
Simulate Cap Rate and NOI
Suggested Prices Based on Cap Rates
Cap Rate 5%
$886,480
Cap Rate 7%
$633,200
Cap Rate 9%
$492,489
Alternative Uses
Best Use
Multifamily LT 5
$680.6K
$595.5K – $794.0K
NOI $47,642 @ 7.0% cap · market cap 9.55%
Second Best
Apartment 5plus
$633.2K
$554.1K – $738.7K
NOI $44,324 @ 7.0% cap · market cap 8.88%
Theoretical Best
Office A
$741.0K
$648.4K – $864.5K
NOI $51,870 @ 7.0% cap · market cap 10.39%
Zoning and permitted uses should be independently verified with authorities.
How Realmo checks its estimates
Property Analytics
Contact the owner directly
Get the owner's phone numbers and email
Open Analytics
Location Intelligence
Trade Area within ½ mile
458
Businesses Nearby
Explore this area
Business Placement
Demographics for 04106, ME
26,641
Population
12,849
Households
2.1
Avg Household Size
41
Median Age
49%
College-Educated
95%
High-School Grad
12.2 sq mi
ZIP Area
2,184
Density / Sq Mi
$83,744
Median Household Income
$47,818
Median Earnings
$1,642
Median Rent
$403,500
Median Home Value
Check the figures for this property
Cap Rate, Value Estimation, Potential NOI and more
View Realmo Analytics
Market
Vacancy Rate% for Multifamily in Northeast region




Frequently Asked Questions
What type of property is this?
Duplex - Corner-lot property with two residential units, a second building, and both off-street and on-street parking.
Where is this duplex located?
The property is located at 449 Main Street South Portland, ME.
What is the asking price?
The asking price for this property is $499,000.
What are key features of this property?
This property features: Two residential units in a 2,696‑square‑foot duplex; Additional building formerly used as a restaurant; 0.14‑acre corner lot at 449 Main Street


