Fully Renovated Duplex With Rear
For Sale
$269,900
1339 W Rush Street, Philadelphia, PA 19132
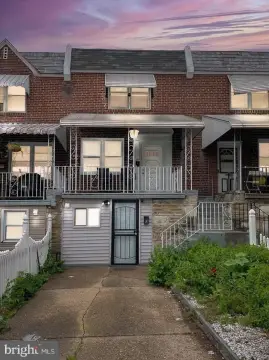
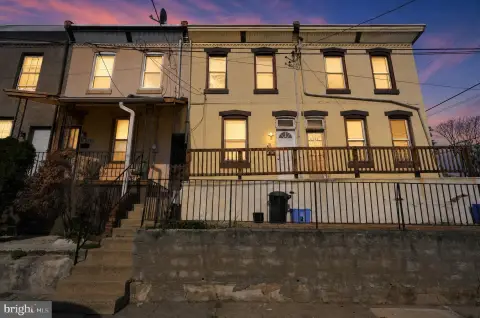
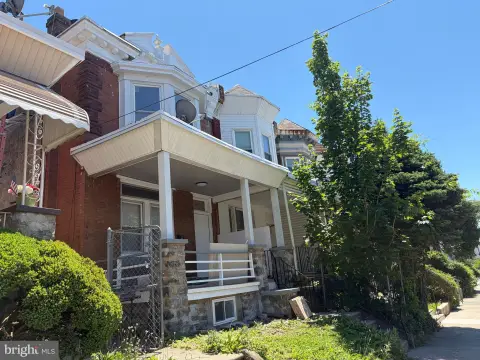
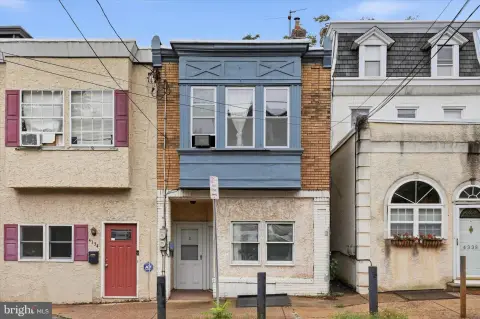
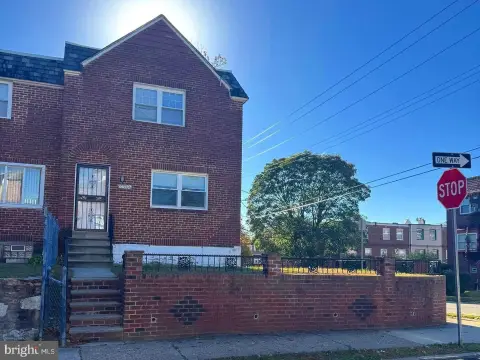
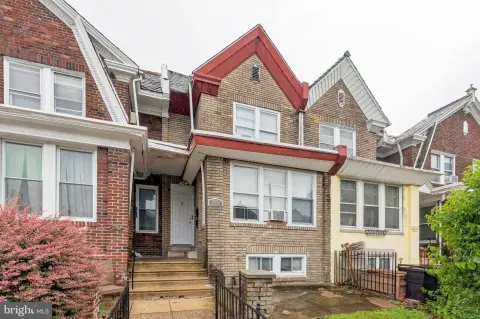
Turn-key duplex with renovated 1-bedroom and 2-bedroom units and a low-maintenance rear yard for flexible ownership.
Property Size1,200 SF
Price / SF$224.92
Days on Market363
Property Features for 1339 W Rush Street
General Information
Standard status
Active
Size
1,200 SF
Property subtype
Multi-Family
Zoning
RM1
Additional Details
Business Included
Yes
Highway Access
Yes
Multifamily Units
2
Taxes and HOA fees
Annual Taxes
$1,329
Amenities
Unfinished
Electric
Yes
No
Assessor
No Pool
Public
O30
15.00 x 52.00
0.02
Concrete Perimeter
19000.00
Building Details
Building Size
1,200 SF
Year Built
1925
Stories
2
Tenancy
Multi
Listing Agency:
Penn One Realty
(856) 222-0077
Listed By:
Amanda Strain
(610) 679-0127
Source:
Thetristaterealestategroup
Added: Oct 13, 2025
Changed: Oct 1
Last Checked: Oct 9 at 5:51PM
Displayed information is deemed reliable but is not guaranteed and should be independently verified. All listing content including descriptions, pricing, images are the copyrighted material of Penn One Realty
Investment Insights
Based on property information with market context.
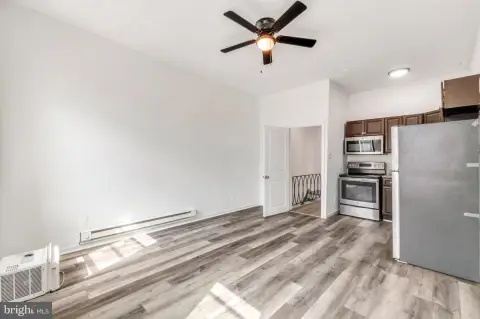
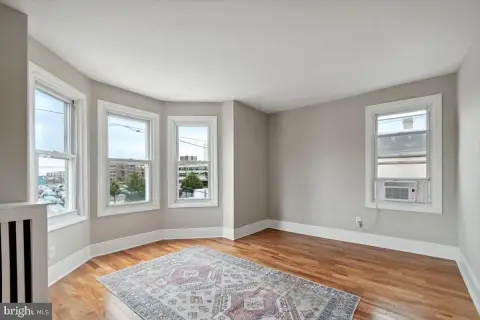
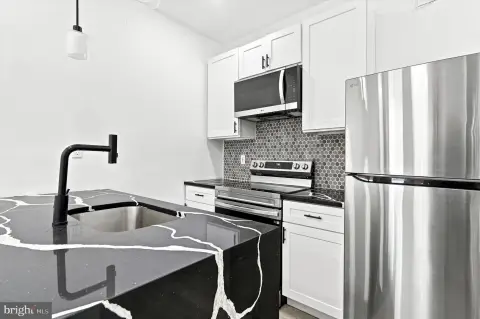
1339 W Rush Street is a fully renovated duplex configured as two separate living units. The first-floor unit offers one bedroom and one bathroom with an open-concept layout, luxury vinyl plank flooring, and a new kitchen featuring stainless steel appliances, quartz countertops, and custom cabinetry. The upstairs unit provides two bedrooms and one bathroom with comparable high-end finishes and modern design throughout. The property has been renewed top to bottom, including new electric, plumbing, HVAC, windows, kitchens, and baths, creating a turn-key setup suitable for a range of buyers.
The duplex is located on a quiet residential block with convenient access to major highways and public transportation. It is also described as being near Temple Hospital and Center City, which may support tenant and occupant accessibility.
With two distinct units, this duplex can fit investors seeking a straightforward rental structure, owner-occupants who plan to live in one unit and rent the other, or multi-generational households looking for separate spaces. The low-maintenance rear yard adds outdoor utility without creating extensive upkeep.
The duplex is located on a quiet residential block with convenient access to major highways and public transportation. It is also described as being near Temple Hospital and Center City, which may support tenant and occupant accessibility.
With two distinct units, this duplex can fit investors seeking a straightforward rental structure, owner-occupants who plan to live in one unit and rent the other, or multi-generational households looking for separate spaces. The low-maintenance rear yard adds outdoor utility without creating extensive upkeep.
Key Highlights
- Fully renovated duplex built in 1925 with two separate units: 1BR/1BA on the first floor and 2BR/1BA on the second floor
- Renovations include new electric, plumbing, HVAC, windows, kitchens, and baths in both units
- Central air (Y/N: Yes) with electric heating (Heating Fuel: Electric) and electric hot water
Financial Insights
Estimated NOI and Cap Rate
NOI / Yr
$20,478
Cap Rate
7.59%
Suggested Prices Based on Cap Rates
Cap Rate 5%
$409,560
$409.6K
Cap Rate 7%
$292,543
$292.5K
Cap Rate 9%
$227,533
$227.5K
Market Conditions
NOI Build-Up for 1,200 SF
Gross rent
$31.0K $25.80/SF
− Vacancy
−$1.7K −$1.42/SF
EGI
$29.3K $24.38/SF
− OpEx
−$8.8K −$7.31/SF
NOI
$20.5K $17.06/SF
Area
Philadelphia, PA
Vacancy
5.51%
Lease Rate
$25.80 /SF/Yr
Expense Ratio
30.00%
Simulate Cap Rate and NOI
Suggested Prices Based on Cap Rates
Cap Rate 5%
$409,560
Cap Rate 7%
$292,543
Cap Rate 9%
$227,533
Alternative Uses
Best Use
Multifamily LT 5
$292.5K
$256.0K – $341.3K
NOI $20,478 @ 7.0% cap · market cap 7.59%
Second Best
Apartment 5plus
$269.6K
$235.9K – $314.6K
NOI $18,875 @ 7.0% cap · market cap 6.99%
Theoretical Best
—
—
same as Best Use
Zoning and permitted uses should be independently verified with authorities.
Property Analytics
Unlock full access to Insights
Subscribe to Realmo Intelligence
Open Analytics
Current Use
Lease Details
2
Residential units
Multi-tenant
Tenancy
Turnkey business
Opportunity
Yes
Highway access
Location Intelligence
Trade Area within ½ mile
1,930
Businesses Nearby
Explore this area
Business Placement
Demographics for 19132, PA
33,926
Population
17,402
Households
1.9
Avg Household Size
37
Median Age
13%
College-Educated
83%
High-School Grad
2.2 sq mi
ZIP Area
15,421
Density / Sq Mi
$30,974
Median Household Income
$30,300
Median Earnings
$1,055
Median Rent
$73,000
Median Home Value
Check the figures for this property
Cap Rate, Value Estimation, Potential NOI and more
View Realmo Analytics
Market
Vacancy Rate% for Multifamily in Northeast region

Questions? Ask Rey
Realmo’s AI knows this listing — price, zoning, demand, history. Ask anything.

Frequently Asked Questions
What type of property is this?
Duplex - Turn-key duplex with renovated 1-bedroom and 2-bedroom units and a low-maintenance rear yard for flexible ownership.
Where is this duplex located?
The property is located at 1339 W Rush Street Philadelphia, PA.
What is the asking price?
The asking price for this property is $269,900.
What are key features of this property?
This property features: Fully renovated duplex built in 1925 with two separate units: 1BR/1BA on the first floor and 2BR/1BA on the second floor; Renovations include new electric, plumbing, HVAC, windows, kitchens, and baths in both units; Central air (Y/N: Yes) with electric heating (Heating Fuel: Electric) and electric hot water