Flex Space with Porte
For Sale
$1,300,000
Pending
708 SW 2ND AVENUE, Ocala, FL 34471
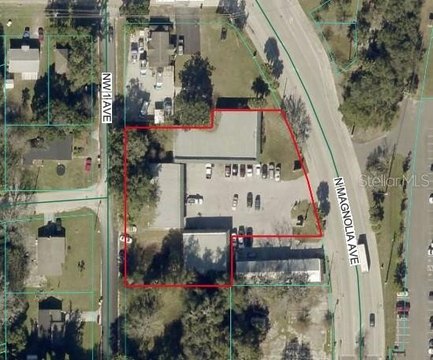
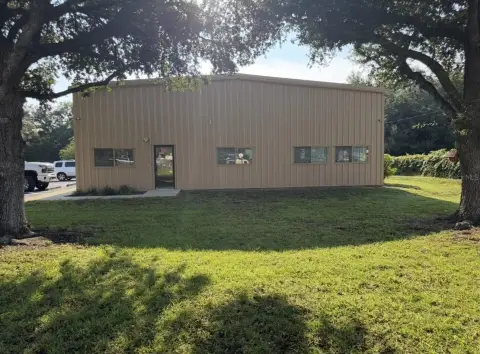
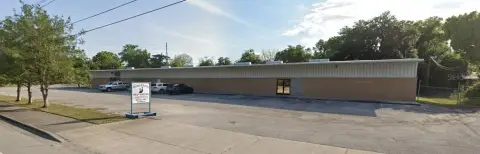
Adaptable commercial building with climate-controlled and ventilated areas, FBC zoning, and dedicated on-site parking.
Property Size6,120 SF
Lot Size0.56 Acres
Days on Market551
Property Features for 708 SW 2ND AVENUE
General Information
Standard status
Pending
Size
6,120 SF
Total Parking Spaces
17
Lot size
0.56 Acres
Property subtype
Commercial/Industrial
Zoning
FBC
Additional Details
Furnished
Yes
Taxes and HOA fees
Annual Taxes
$13,507
Amenities
climate-controlled spaces
ventilated spaces
porte chochere
Building Details
Year Built
2006
Buildings
1
Building Size
6,120 SF
Listing Agency:
NAI HERITAGE, LLC
Listed By:
Randal Buss · License #3105657
(352) 482-0777
Source:
Exitrealty
Added: Apr 17, 2025
Changed: Sep 29
Last Checked: Sep 29 at 8:08AM
Displayed information is deemed reliable but is not guaranteed and should be independently verified. All listing content including descriptions, pricing, images are the copyrighted material of NAI HERITAGE, LLC

Ask AI about this property
Review the available facts, identify missing information and prepare questions for the agent.
Investment Insights
Based on property information with market context.
This 2006 flex property contains a 6,120-square-foot special-purpose building on 0.56 acres. The interior combines climate-controlled rooms with ventilated areas, creating a varied configuration that supports industrial and other operational uses. The sale includes the real estate, fixtures, furniture, and equipment associated with an existing cremation service that is consolidating operations.
The property is located near downtown at 708 SW 2nd Avenue in Ocala, Florida, with access to two parking lots providing 17 spaces. A drive-through porte cochere adds covered vehicle access to the building. The site is zoned FBC. The seller may vacate within 45 days, or within 90 days if the buyer requests removal of the fixtures and furniture before closing. A pre-need portfolio is also available separately.
The property is located near downtown at 708 SW 2nd Avenue in Ocala, Florida, with access to two parking lots providing 17 spaces. A drive-through porte cochere adds covered vehicle access to the building. The site is zoned FBC. The seller may vacate within 45 days, or within 90 days if the buyer requests removal of the fixtures and furniture before closing. A pre-need portfolio is also available separately.
Key Highlights
- 6,120‑square‑foot building on 0.56 acres
- FBC‑zoned flex property near downtown Ocala
- Mix of climate‑controlled and ventilated spaces
Financial Insights
Estimated NOI and Cap Rate
NOI / Yr
$87,091
Cap Rate
6.70%
Suggested Prices Based on Cap Rates
Cap Rate 5%
$1,741,820
$1.7M
Cap Rate 7%
$1,244,157
$1.2M
Cap Rate 9%
$967,678
$967.7K
Market Conditions
NOI Build-Up for 7,592 SF
Gross rent
$130.3K $17.16/SF
− Vacancy
−$5.9K −$0.77/SF
EGI
$124.4K $16.39/SF
− OpEx
−$37.3K −$4.92/SF
NOI
$87.1K $11.47/SF
Area
Marion County, FL
Vacancy
4.50%
Lease Rate
$17.16 /SF/Yr
Expense Ratio
30.00%
Simulate Cap Rate and NOI
Suggested Prices Based on Cap Rates
Cap Rate 5%
$1,741,820
Cap Rate 7%
$1,244,157
Cap Rate 9%
$967,678
Alternative Uses
Best Use
Industrial
$1.24M
$1.09M – $1.45M
NOI $87,091 @ 7.0% cap · market cap 6.70%
Second Best
Flex RnD
$897.0K
$784.9K – $1.05M
NOI $62,788 @ 7.0% cap · market cap 4.83%
Theoretical Best
Office A
$4.15M
$3.63M – $4.84M
NOI $290,206 @ 7.0% cap · market cap 22.32%
Zoning and permitted uses should be independently verified with authorities.
How Realmo checks its estimates
Property Analytics
Unlock full access to Insights
Subscribe to Realmo Intelligence
Open Analytics
Current Use
Location Intelligence
Trade Area within ½ mile
2,782
Businesses Nearby
Well-served
Demand for This Use
Explore this area
Business Placement
Demographics for 34471, FL
27,632
Population
12,071
Households
2.3
Avg Household Size
43
Median Age
36%
College-Educated
93%
High-School Grad
19.8 sq mi
ZIP Area
1,396
Density / Sq Mi
$60,283
Median Household Income
$37,565
Median Earnings
$1,225
Median Rent
$292,200
Median Home Value
Check the figures for this property
Cap Rate, Value Estimation, Potential NOI and more
View Realmo Analytics
Market
Vacancy Rate% for Industrial in South region






Similar Off Market Nearby
- cdt catering&more LLC — 815 SW 10th Ave, Ocala, FL 34471
- Ocala Conch Man / Conch and More — 1606 W Silver Springs Blvd, Ocala, FL 34475
- Ocalaqueen352 — Ocala, FL 34483
Frequently Asked Questions
What type of property is this?
Flex space - Adaptable commercial building with climate-controlled and ventilated areas, FBC zoning, and dedicated on-site parking.
Where is this flex space located?
The property is located at 708 SW 2ND AVENUE Ocala, FL.
What is the asking price?
The asking price for this property is $1,300,000.
What are key features of this property?
This property features: 6,120‑square‑foot building on 0.56 acres; FBC‑zoned flex property near downtown Ocala; Mix of climate‑controlled and ventilated spaces


