Six-Unit Mixed-Use
For Sale
$879,000
260-264 Main Street, Highland Falls, NY 10928
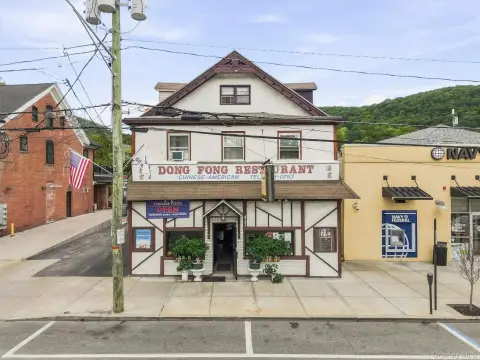
Two renovated buildings combine studio commercial spaces with upstairs and basement apartments in a designated historic district.
Property Size2,520 SF
Price / SF$348.81
Days on Market1402
Property Features for 260-264 Main Street
General Information
Standard status
Active
Size
2,520 SF
Property subtype
Multi Family
Units
Unit Mix
1 x 3BR, 2 x 1BR, 1 x 2BR
Multifamily Units
4
Additional Details
Road Access
Yes
Taxes and HOA fees
Annual Taxes
$9,211
Amenities
patios
decking
fencing
No, No, Public Parking
Historic District, Historic District, Square Feet
Public
2520
2+ Common Walls
Square Feet
No
Brick, Frame, Stone
Public Parking, Historic District
Building Details
Year Built
1960
Buildings
2
Listing Agency:
William Raveis-New York, LLC
Listed By:
Leandra Bradley · License #10401325699
(914) 276-0900
Source:
Compass
Added: Dec 14, 2022
Changed: Oct 10
Last Checked: Oct 16 at 10:51AM
Displayed information is deemed reliable but is not guaranteed and should be independently verified. All listing content including descriptions, pricing, images are the copyrighted material of William Raveis-New York, LLC

Ask AI about this property
Review the available facts, identify missing information and prepare questions for the agent.
Investment Insights
Based on property information with market context.
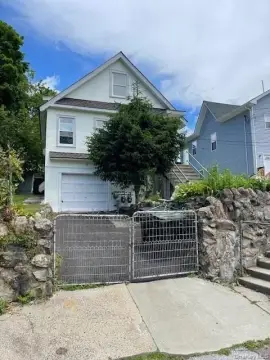
This mixed-use property comprises two buildings totaling 2,520 square feet and six units. The 260 Main Street building includes a studio, a three-bedroom apartment above, and a one-bedroom basement apartment. At 264 Main Street, the layout includes another studio, a two-bedroom upper-level apartment, and a second one-bedroom basement apartment. The studios and lower apartments have undergone recent renovations.
Outdoor improvements include patios, decking, and fencing. The buildings feature brick, frame, and stone construction, with public parking noted as an exterior feature. Both structures date to 1960 and are located within the historic district on Main Street in Highland Falls. Electric water heaters are included among the property features.
Outdoor improvements include patios, decking, and fencing. The buildings feature brick, frame, and stone construction, with public parking noted as an exterior feature. Both structures date to 1960 and are located within the historic district on Main Street in Highland Falls. Electric water heaters are included among the property features.
Key Highlights
- Six‑unit mixed‑use property across 2 buildings
- 2,520 square feet of total building area
- 260 Main Street includes a studio, 3‑bedroom apartment, and 1‑bedroom basement apartment
Financial Insights
Estimated NOI and Cap Rate
NOI / Yr
$47,138
Cap Rate
5.36%
Suggested Prices Based on Cap Rates
Cap Rate 5%
$942,760
$942.8K
Cap Rate 7%
$673,400
$673.4K
Cap Rate 9%
$523,756
$523.8K
Market Conditions
NOI Build-Up for 2,520 SF
Gross rent
$88.9K $35.28/SF
− Vacancy
−$3.2K −$1.27/SF
EGI
$85.7K $34.01/SF
− OpEx
−$38.6K −$15.30/SF
NOI
$47.1K $18.71/SF
Area
Orange County, NY
Vacancy
3.60%
Lease Rate
$35.28 /SF/Yr
Expense Ratio
45.00%
Simulate Cap Rate and NOI
Suggested Prices Based on Cap Rates
Cap Rate 5%
$942,760
Cap Rate 7%
$673,400
Cap Rate 9%
$523,756
Alternative Uses
Best Use
Apartment 5plus
$673.4K
$589.2K – $785.6K
NOI $47,138 @ 7.0% cap · market cap 5.36%
Second Best
Mixed Use
$313.5K
$274.3K – $365.7K
NOI $21,943 @ 7.0% cap · market cap 2.50%
Theoretical Best
Office A
$853.5K
$746.8K – $995.8K
NOI $59,745 @ 7.0% cap · market cap 6.80%
Zoning and permitted uses should be independently verified with authorities.
How Realmo checks its estimates
Property Analytics
Current Use
Lease Details
4
Residential units
Yes
Paved road access
Location Intelligence
Trade Area within ½ mile
328
Businesses Nearby
Explore this area
Business Placement
Demographics for 10928, NY
4,637
Population
2,442
Households
1.9
Avg Household Size
40
Median Age
33%
College-Educated
88%
High-School Grad
8.4 sq mi
ZIP Area
552
Density / Sq Mi
$96,106
Median Household Income
$53,338
Median Earnings
$1,717
Median Rent
$307,800
Median Home Value
Market
Vacancy Rate% for Multifamily in Northeast region


Frequently Asked Questions
What type of property is this?
Mixed-use property - Two renovated buildings combine studio commercial spaces with upstairs and basement apartments in a designated historic district.
Where is this mixed-use property located?
The property is located at 260-264 Main Street Highland Falls, NY.
What is the asking price?
The asking price for this property is $879,000.
What are key features of this property?
This property features: Six‑unit mixed‑use property across 2 buildings; 2,520 square feet of total building area; 260 Main Street includes a studio, 3‑bedroom apartment, and 1‑bedroom basement apartment


