Multifamily Property With Group
For Sale
Under Contract
$1,300,000
1326 - 1330 S 4th Street W, Missoula, MT 59801
CommercialSale, Missoula, MT
Property SizeContact for details
Lot Size0.43 Acres
Days on Market161
Property Features for 1326 - 1330 S 4th Street W
General Information
Property type
Commercial Sale
Property subtype
Other
Zoning
Multi-Family
Zoning description
U-R4
Lot features
Level
Directions
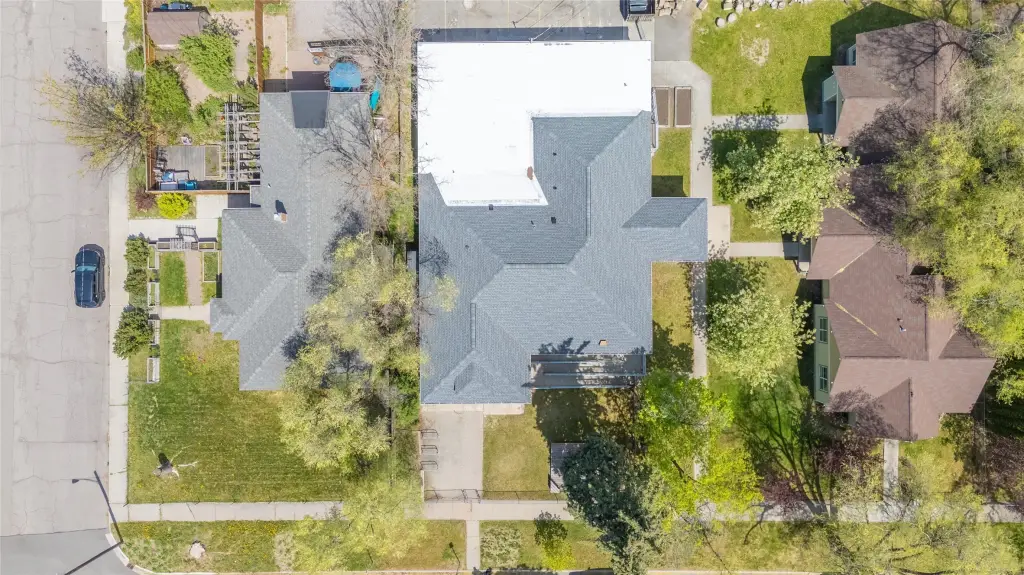
North Side of 4th Street, Between Russell and Orange Street.
Standard status
Active Under Contract
APN
04220021325020000
Lot size
0.43 Acres
Taxes and HOA fees
Tax Year
2025
Tax Description
Knowles Addition #2, S21, T13N, R18W, Block 61, Lots 8B & Lots 9 & 10
Tax Annual Amount
61
Legal Description
Knowles Addition #2, S21, T13N, R18W, Block 61, Lots 8B & Lots 9 & 10
Utilities
Sewer type
Public Sewer
Water source
Public
Amenities
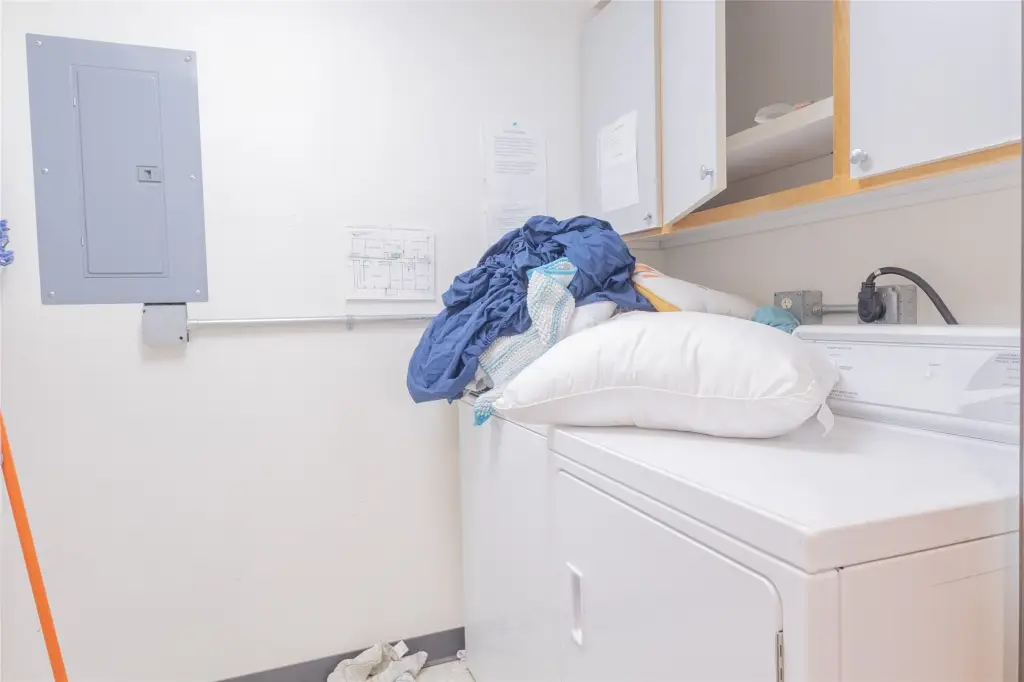
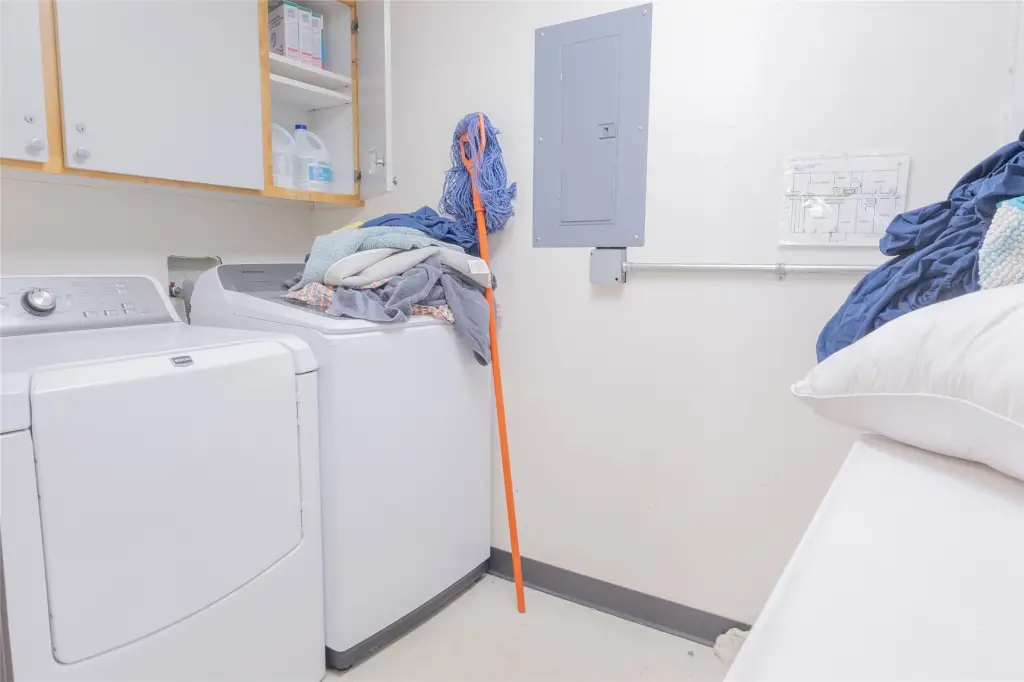
laundry room
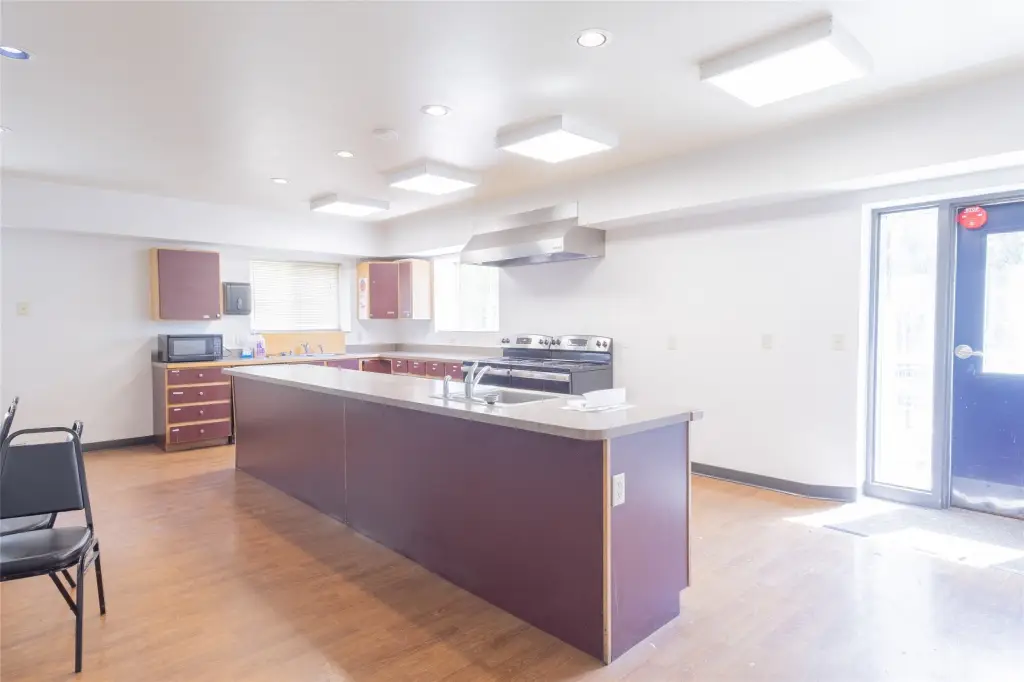
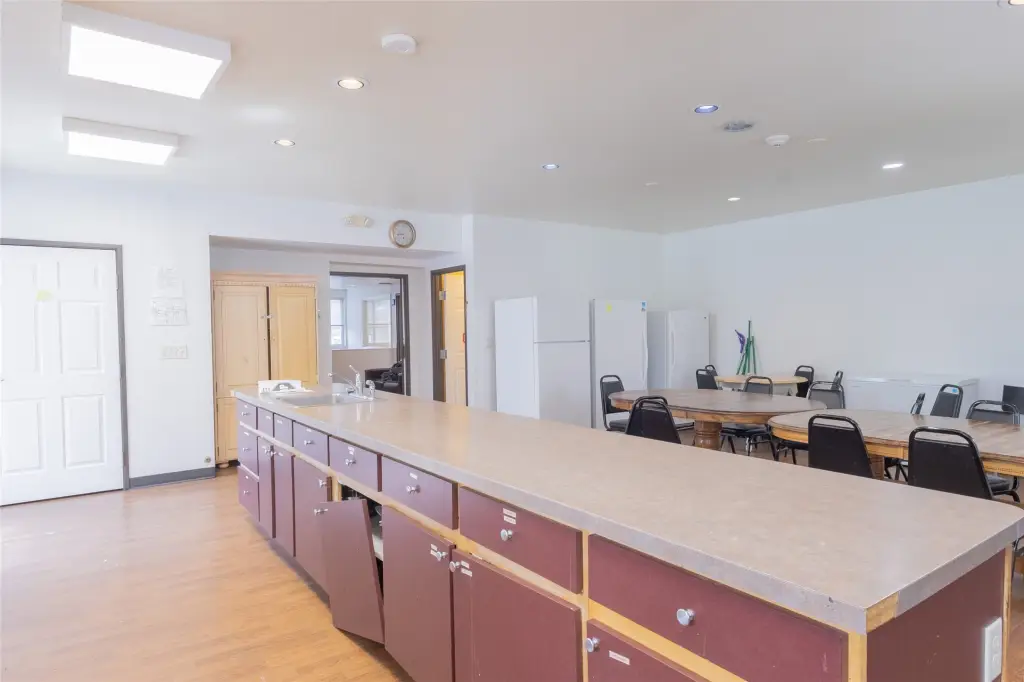
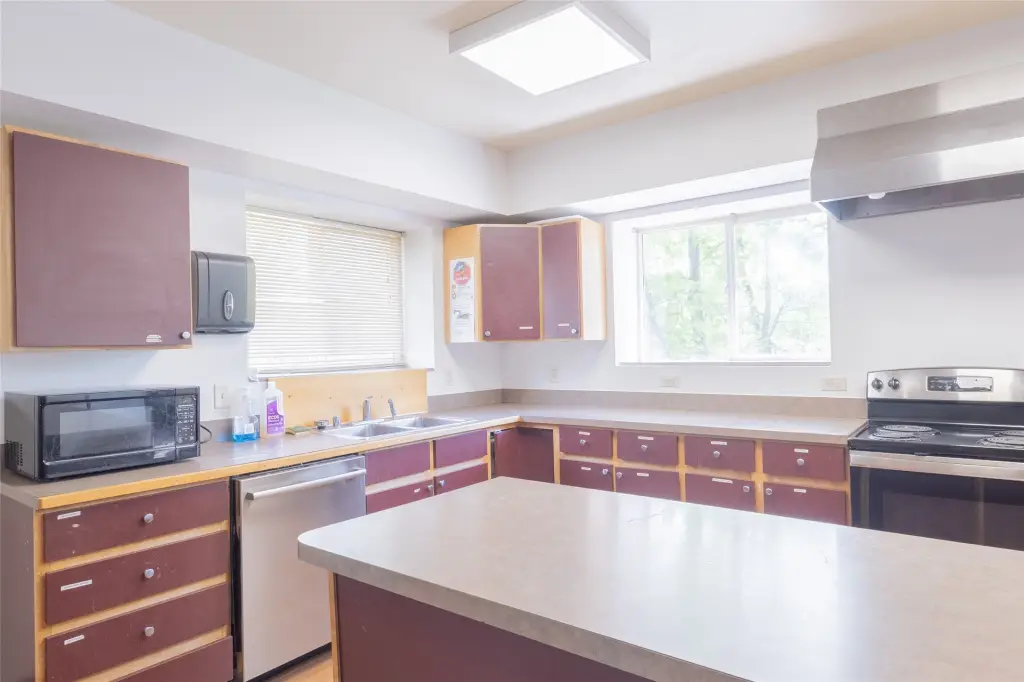
community kitchen
Building Details
Year built
1930
Number of units
4
Listing Agency:
EXIT Realty Missoula
(406) 721-1010
Listed By:
Kevin R Bailey · License #RRE-BRO-LIC-54097
(406) 544-5164
Added: May 4
Changed: Sep 24
Last Checked: Oct 11 at 1:06PM
MLS# 30069526
Copyright © 2026 Montana Regional MLS. All rights reserved. All information provided by the listing agent/broker is deemed reliable but is not guaranteed and should be independently verified.
Investment Insights
Based on property information with market context.
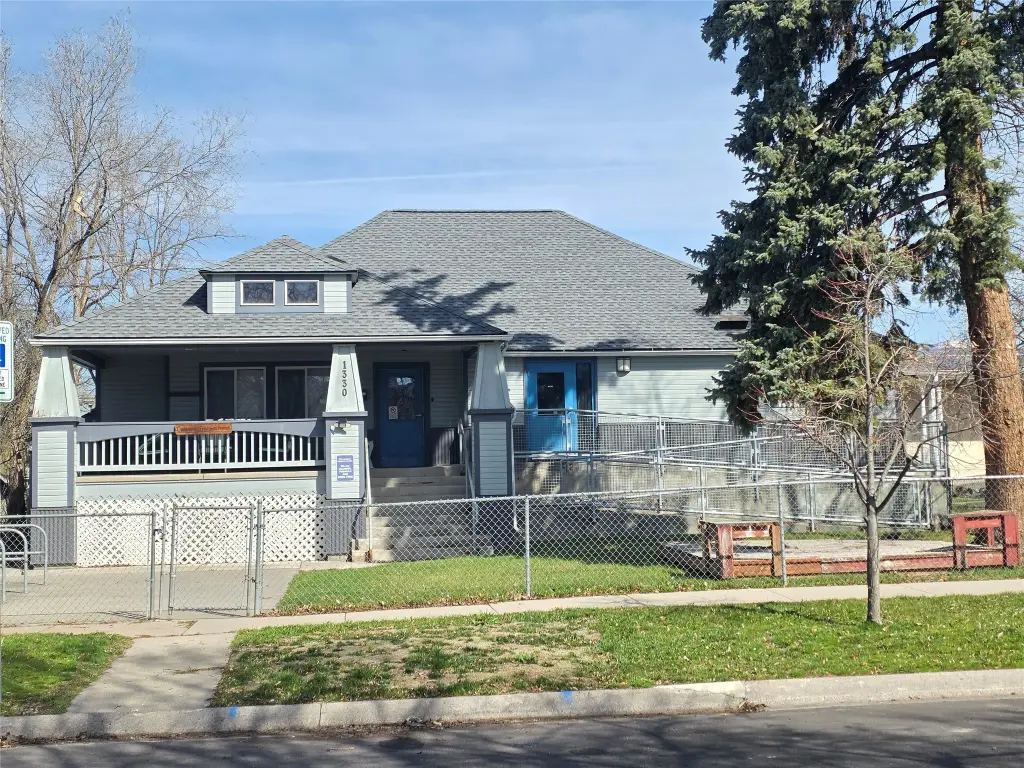
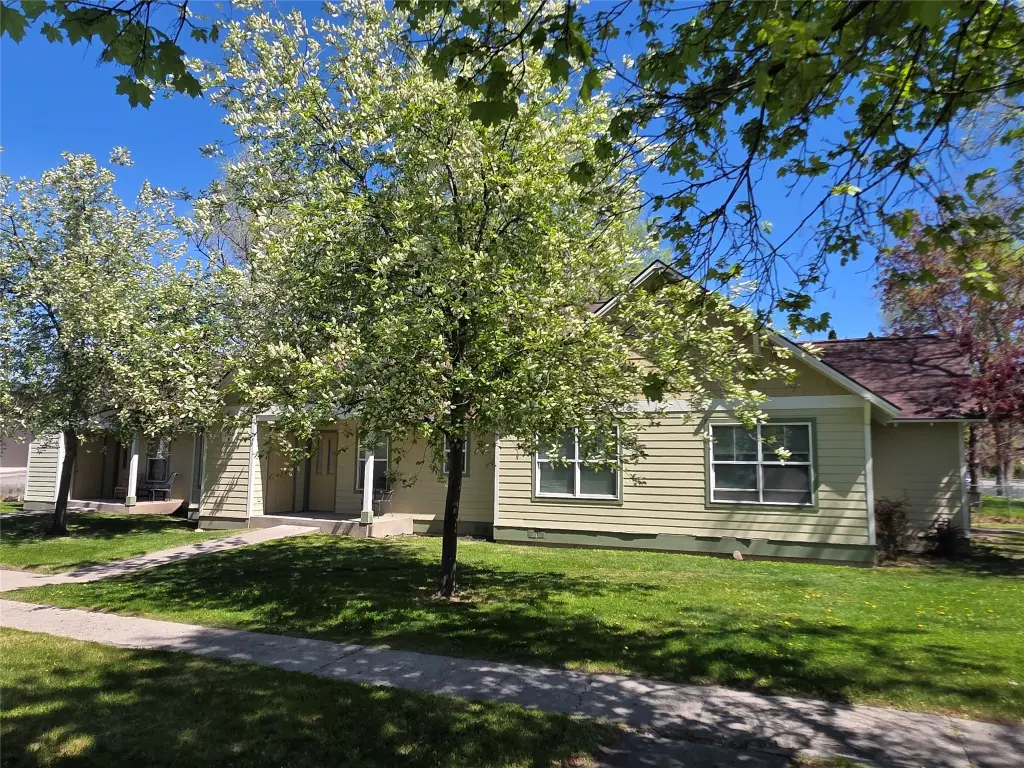
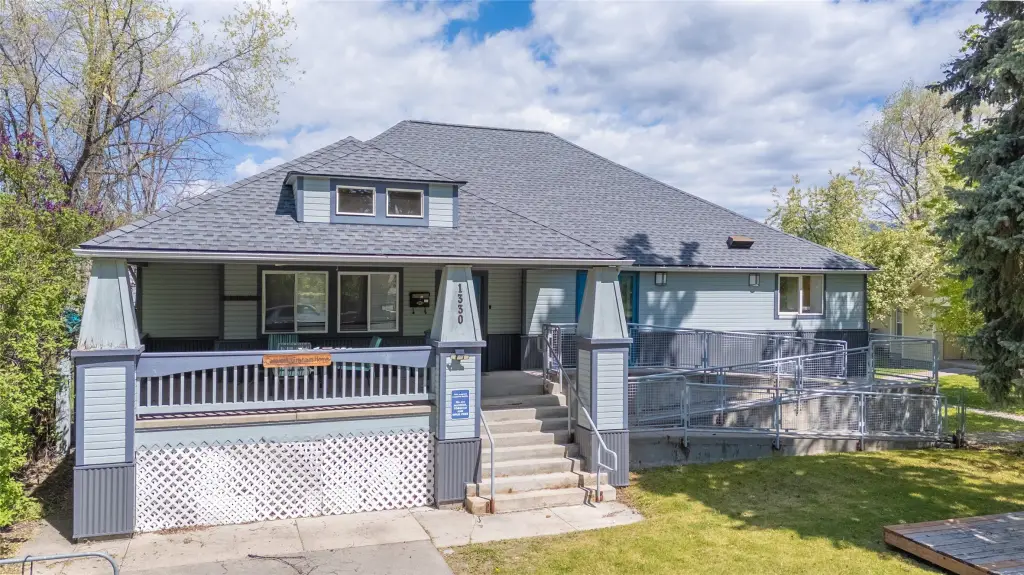
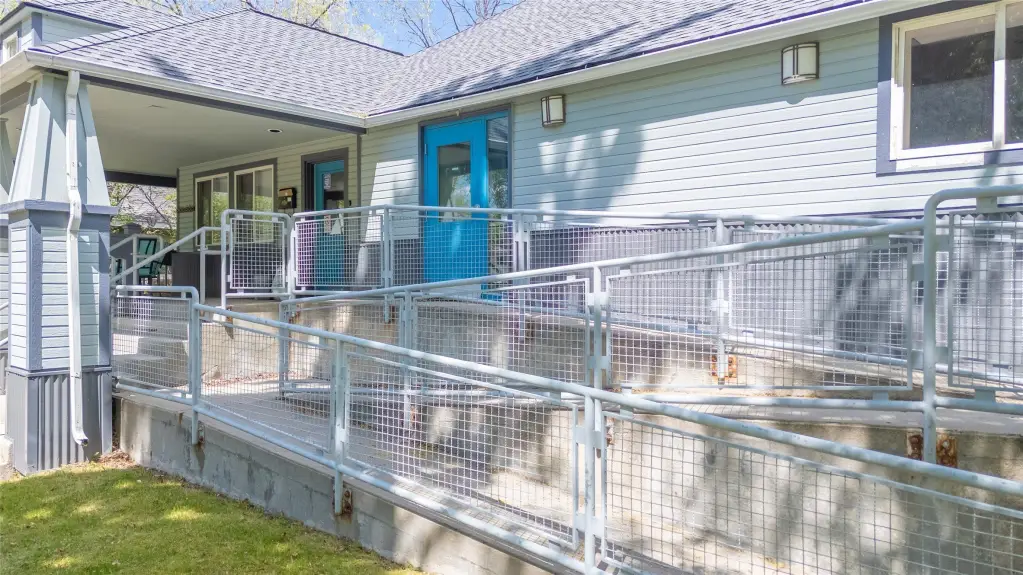
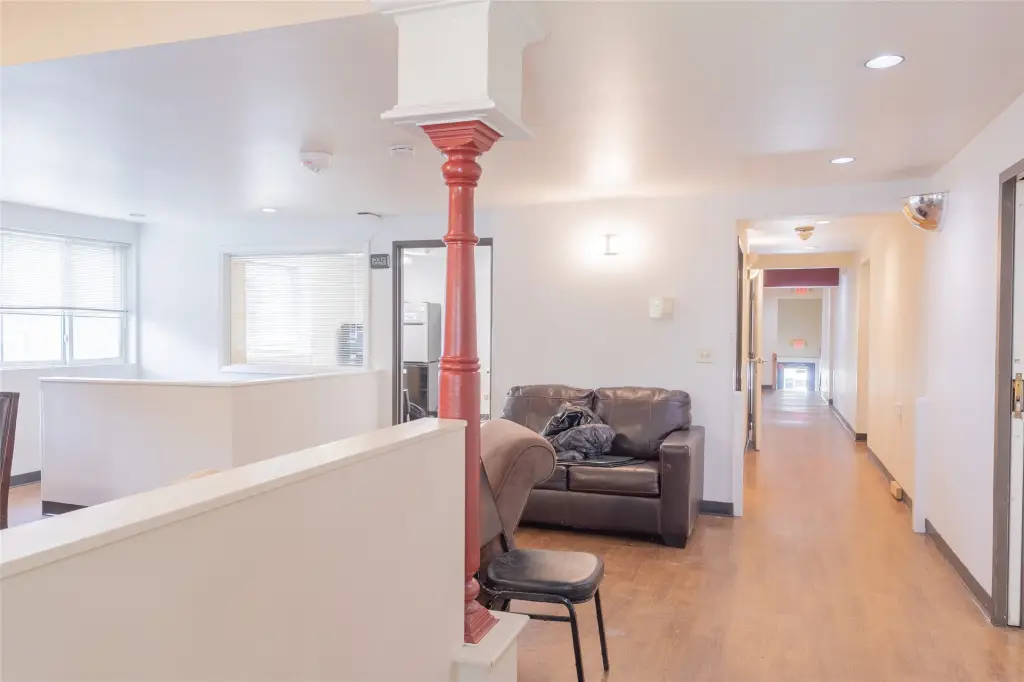
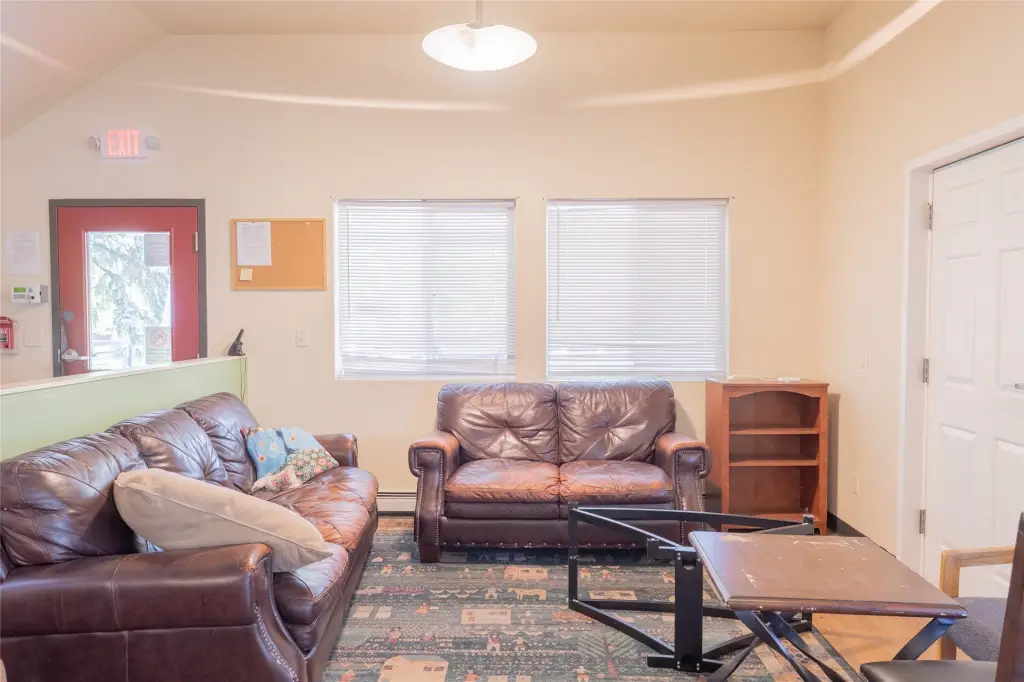
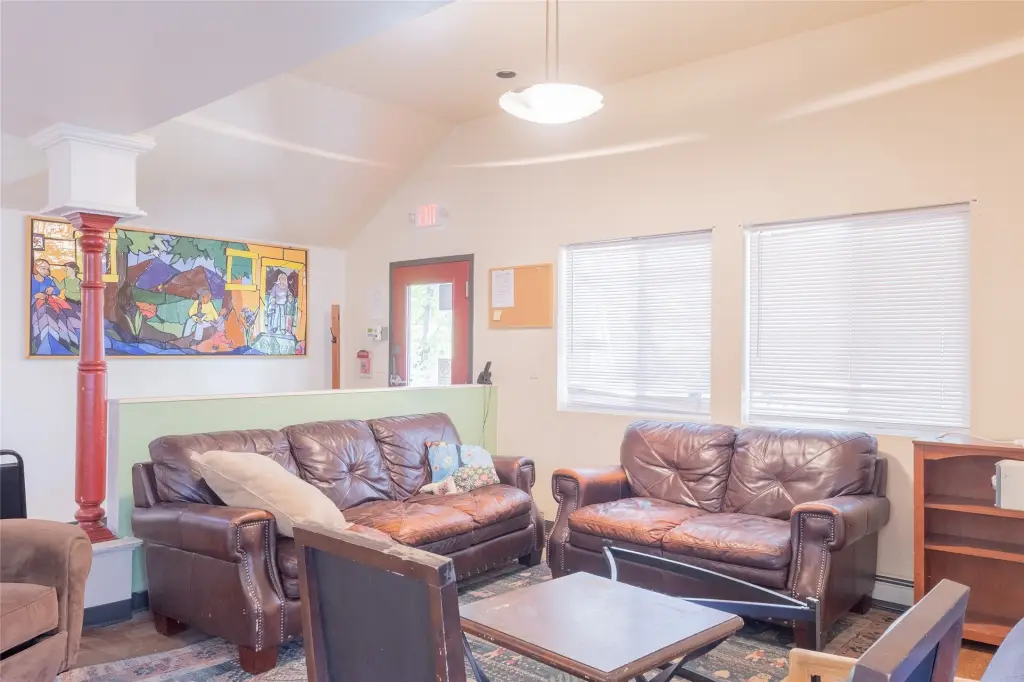
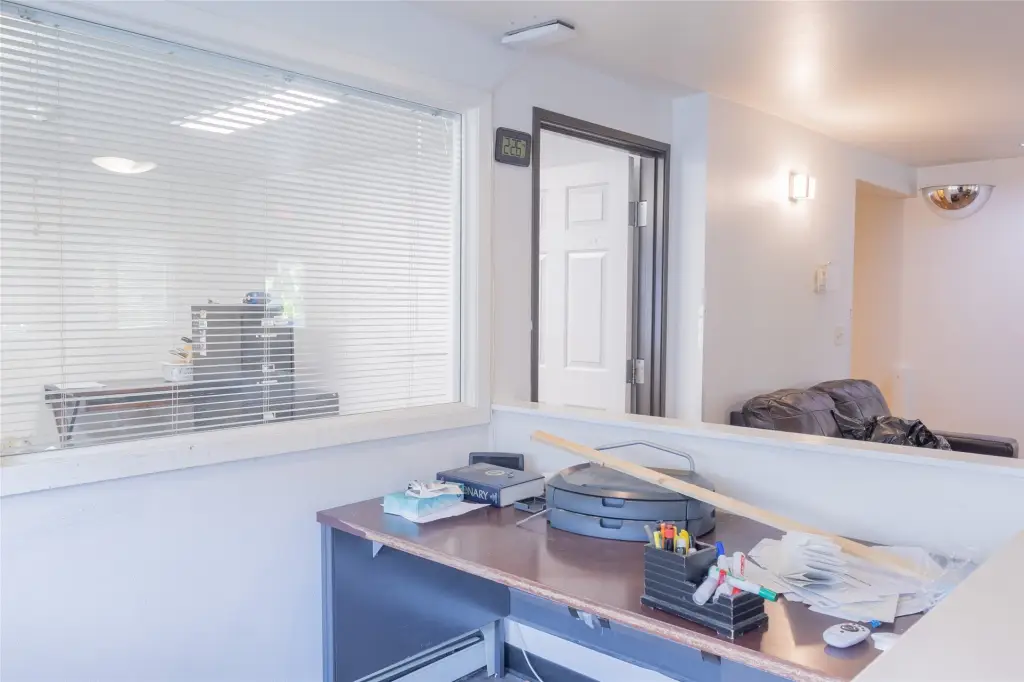
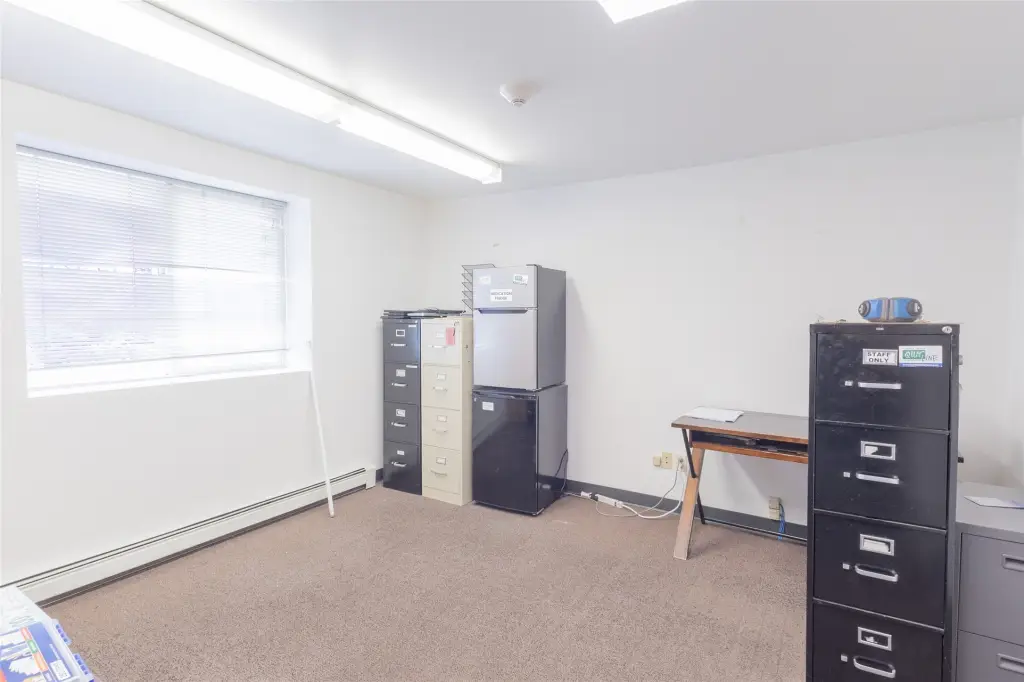
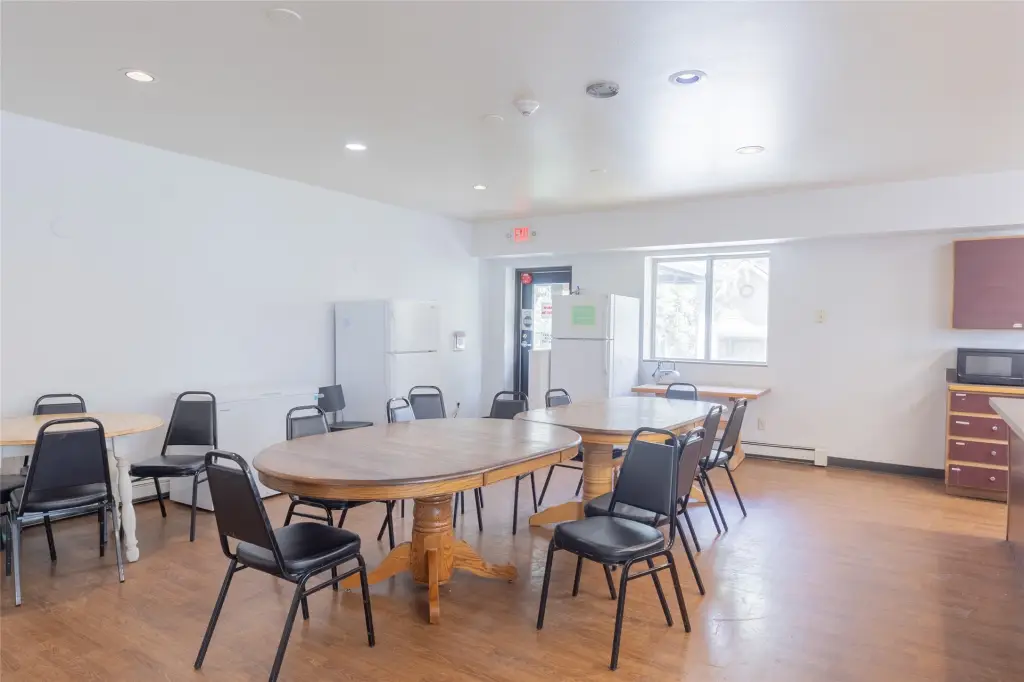
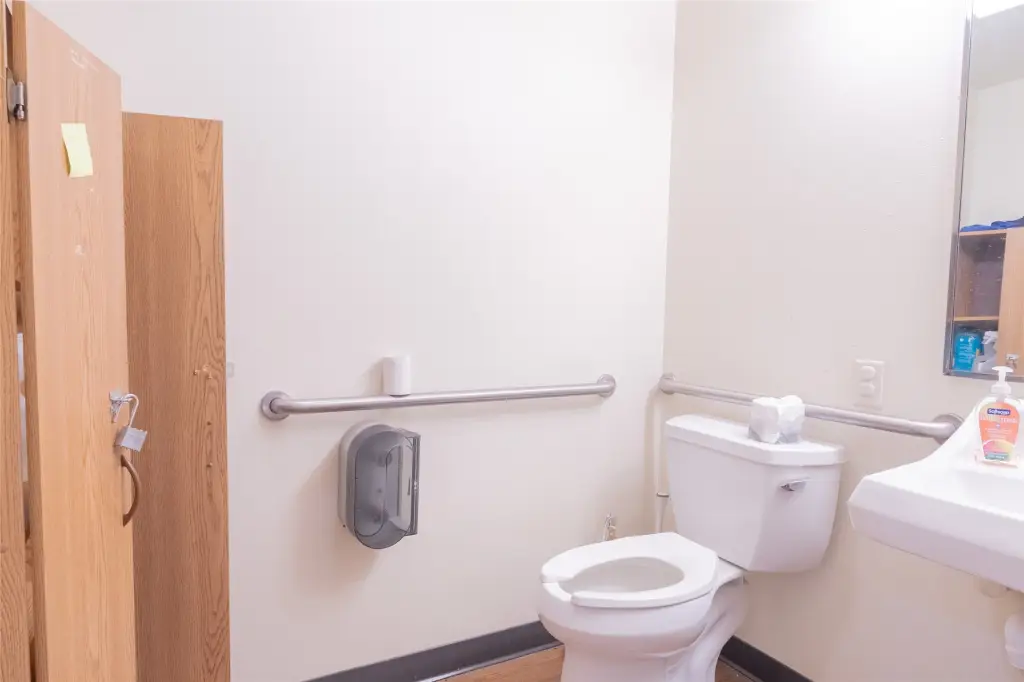
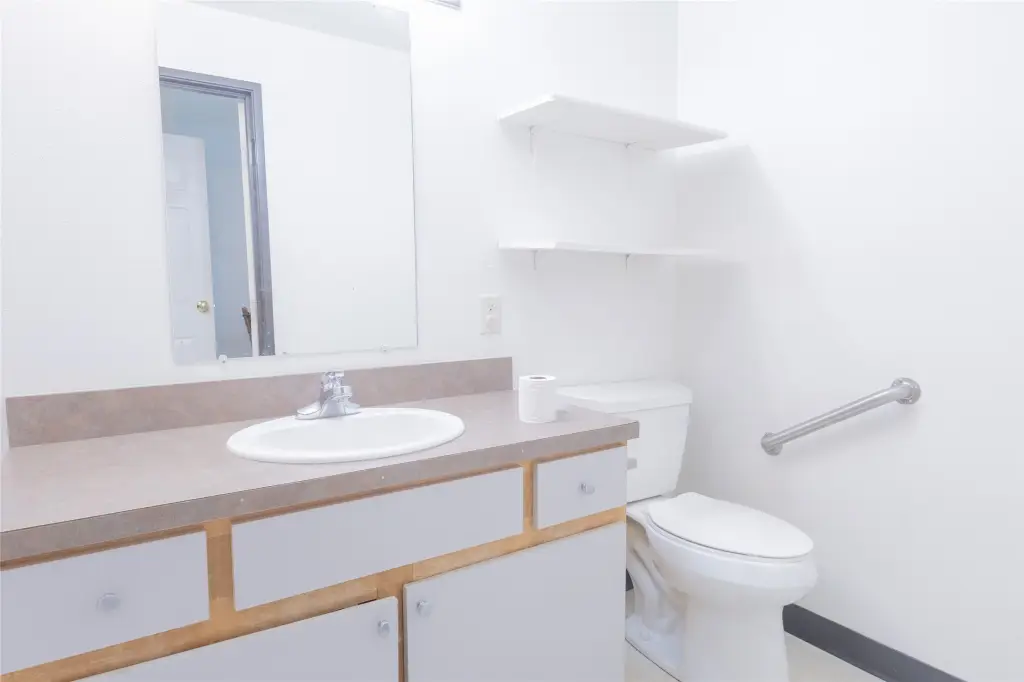
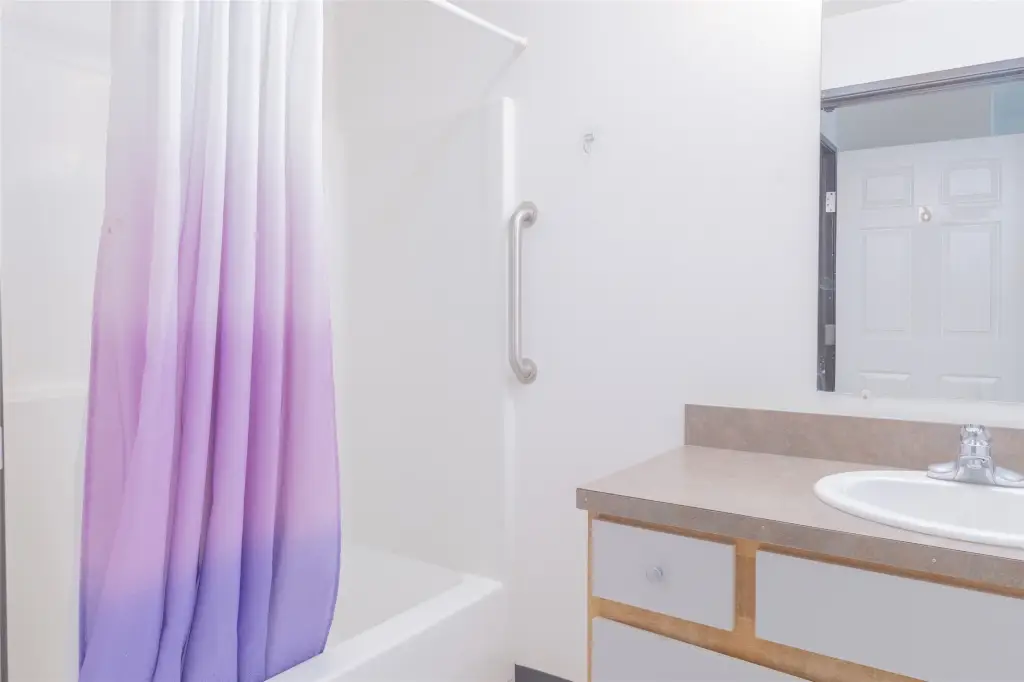
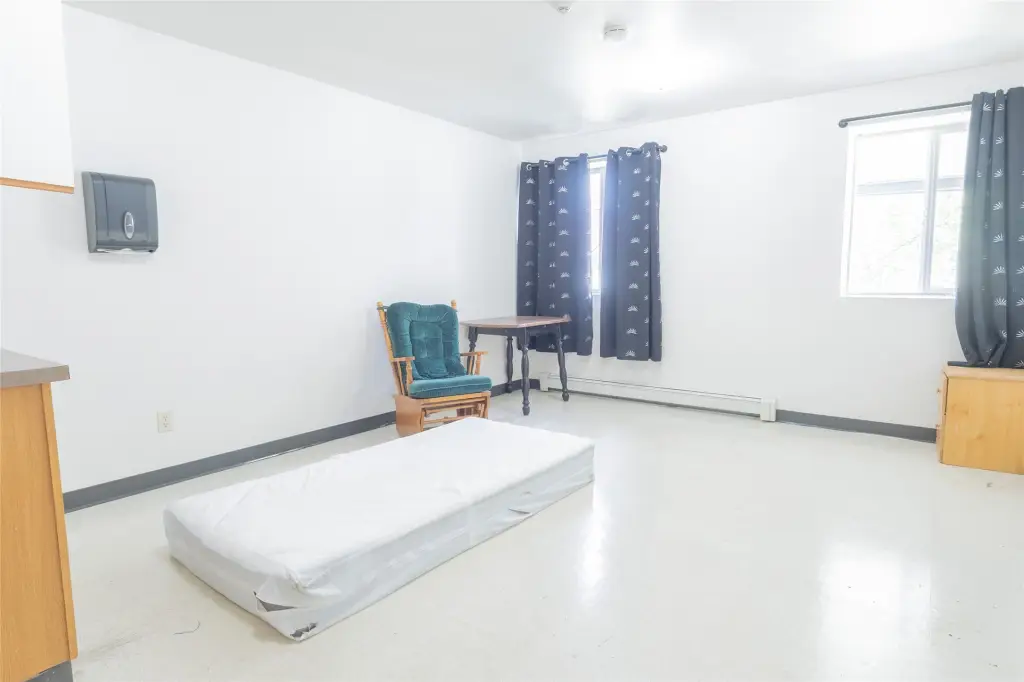
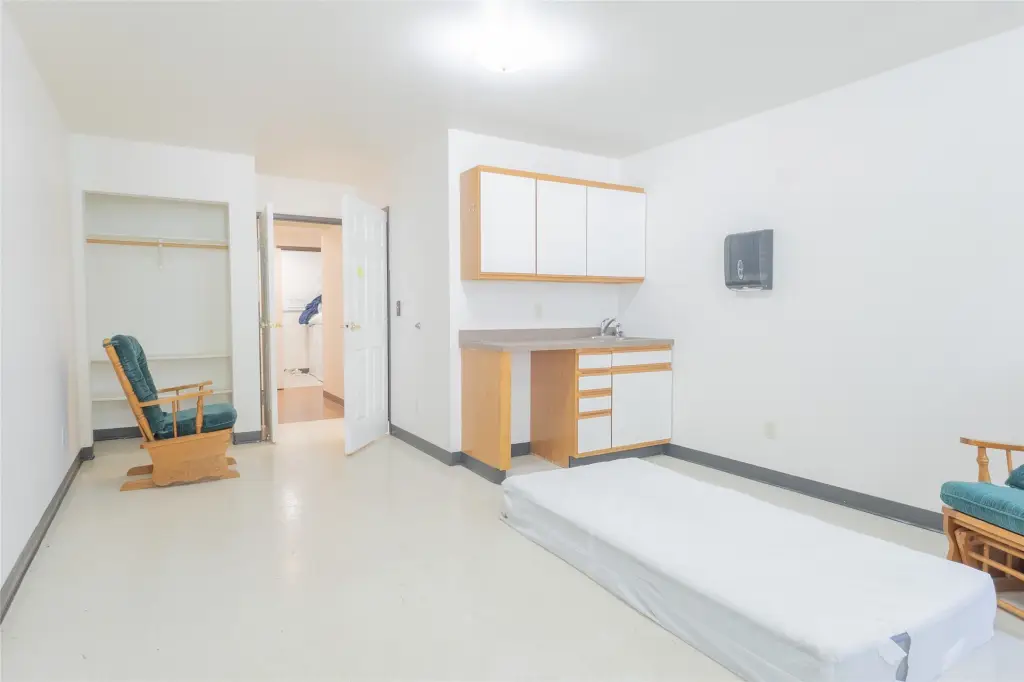
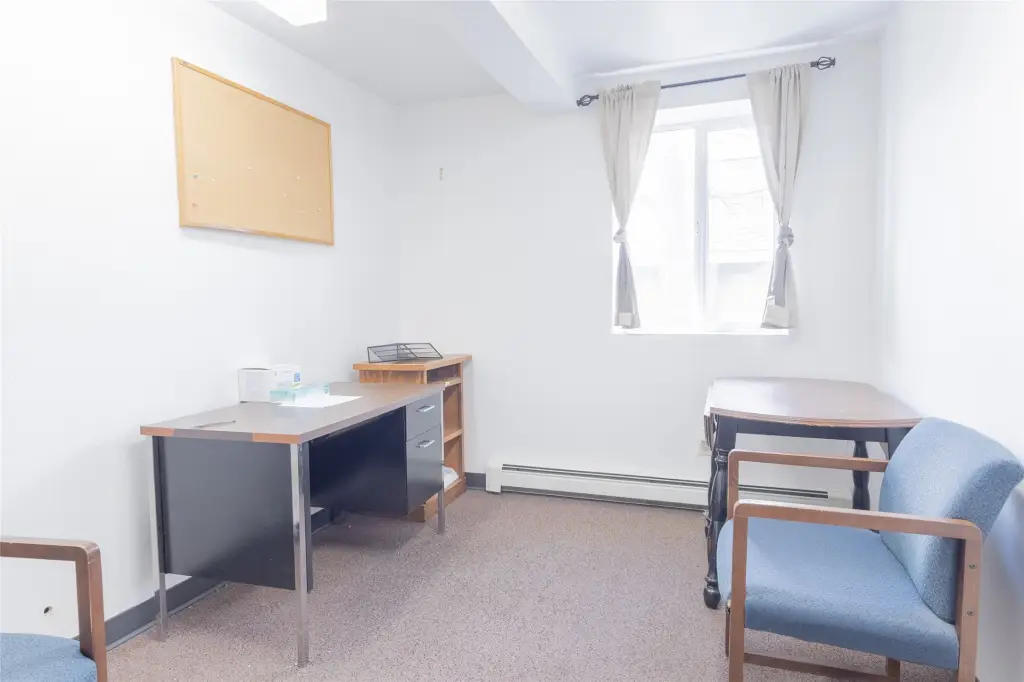
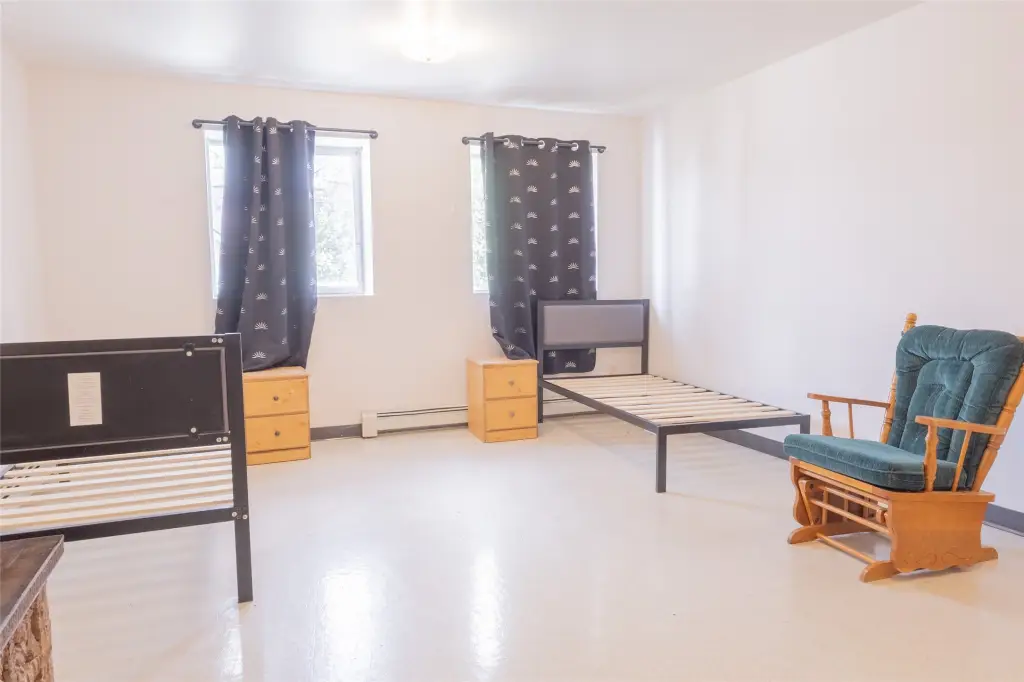
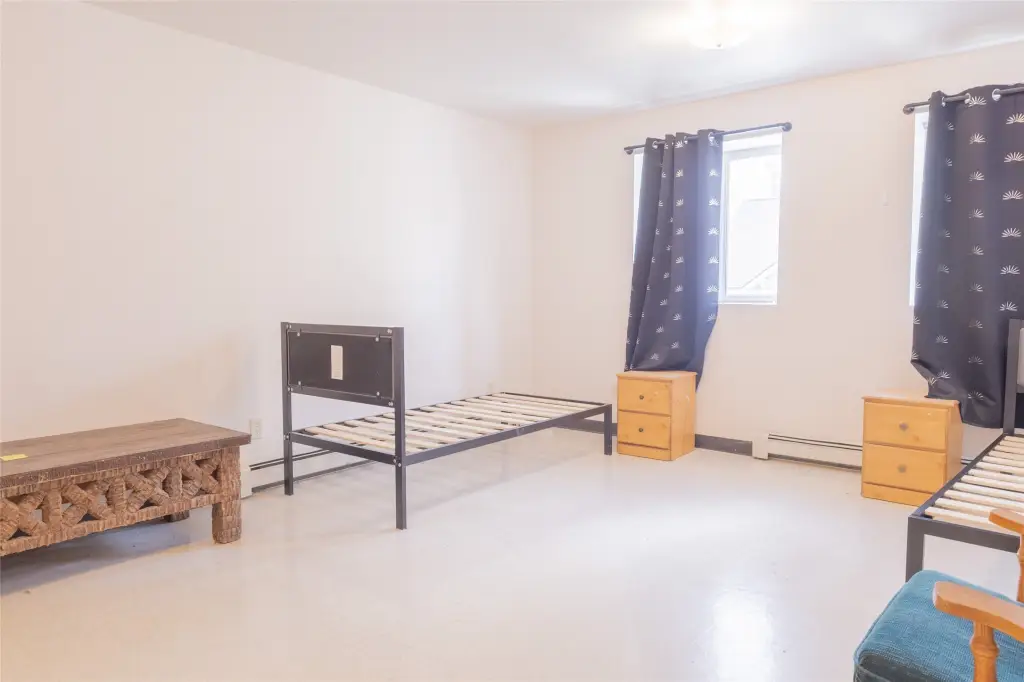
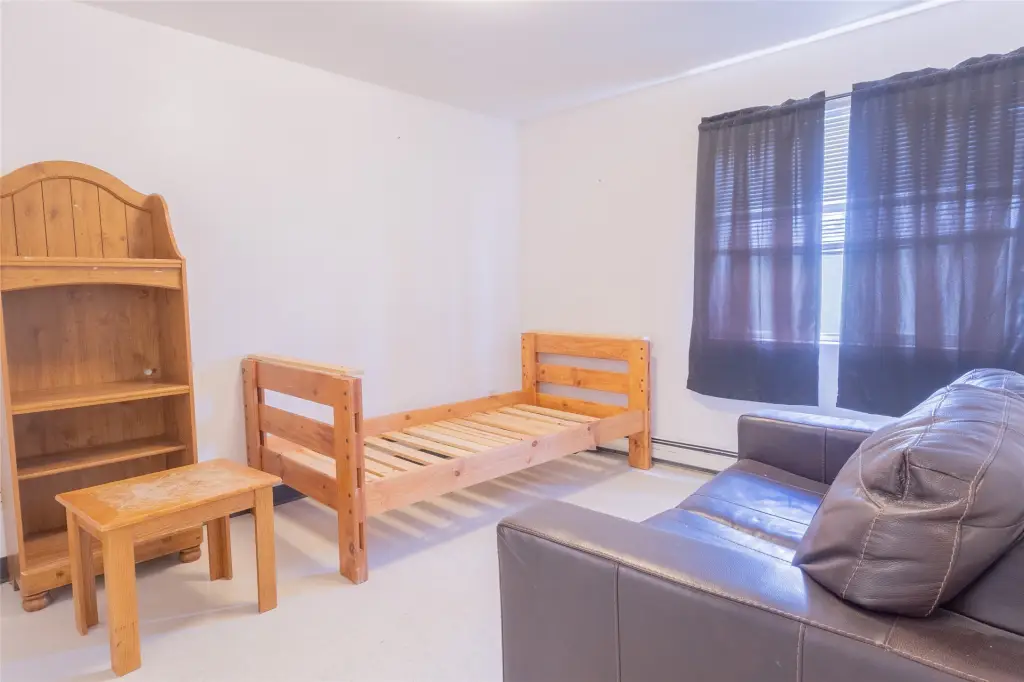
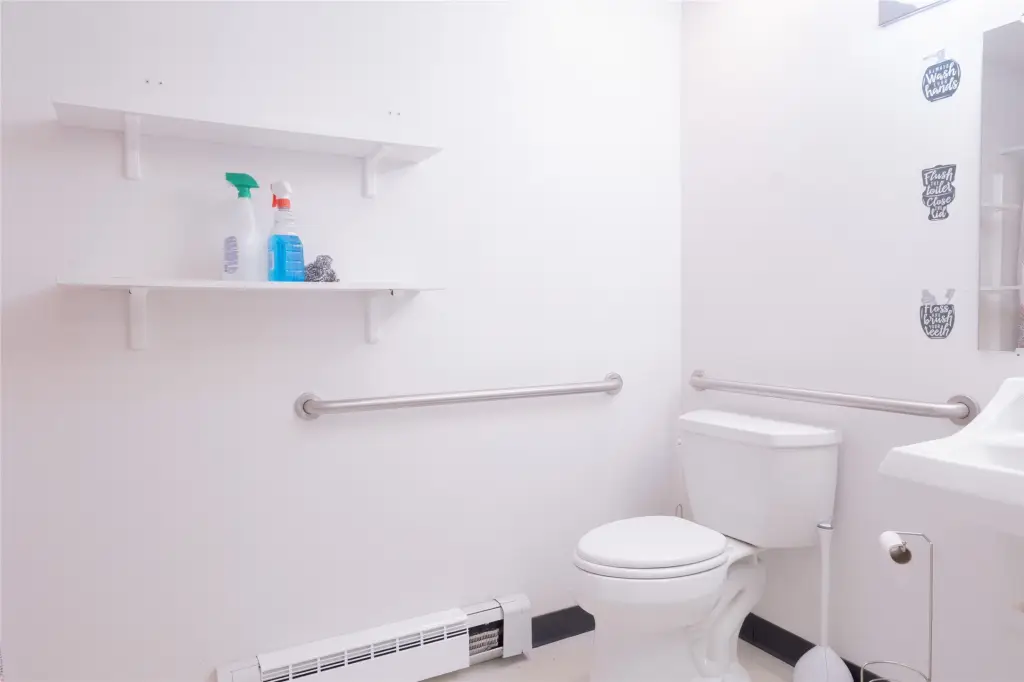
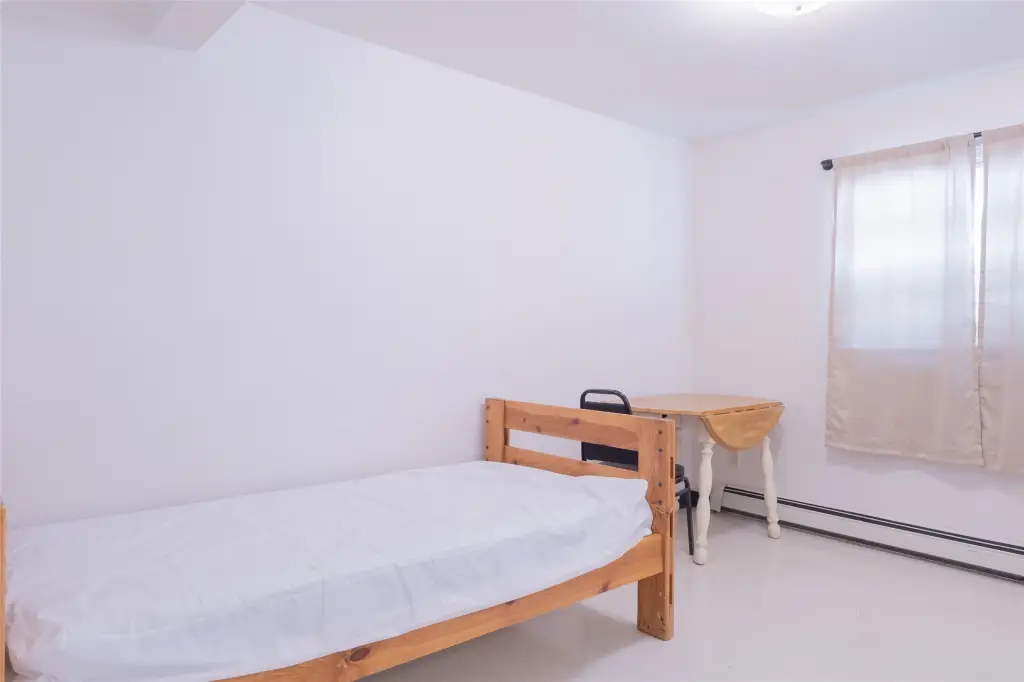
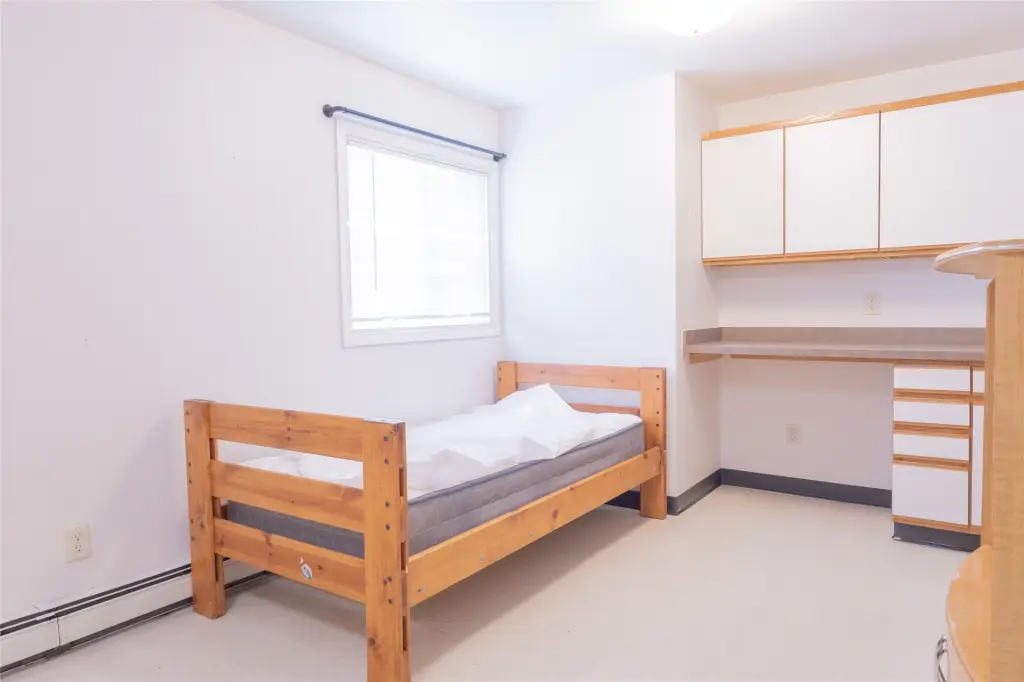
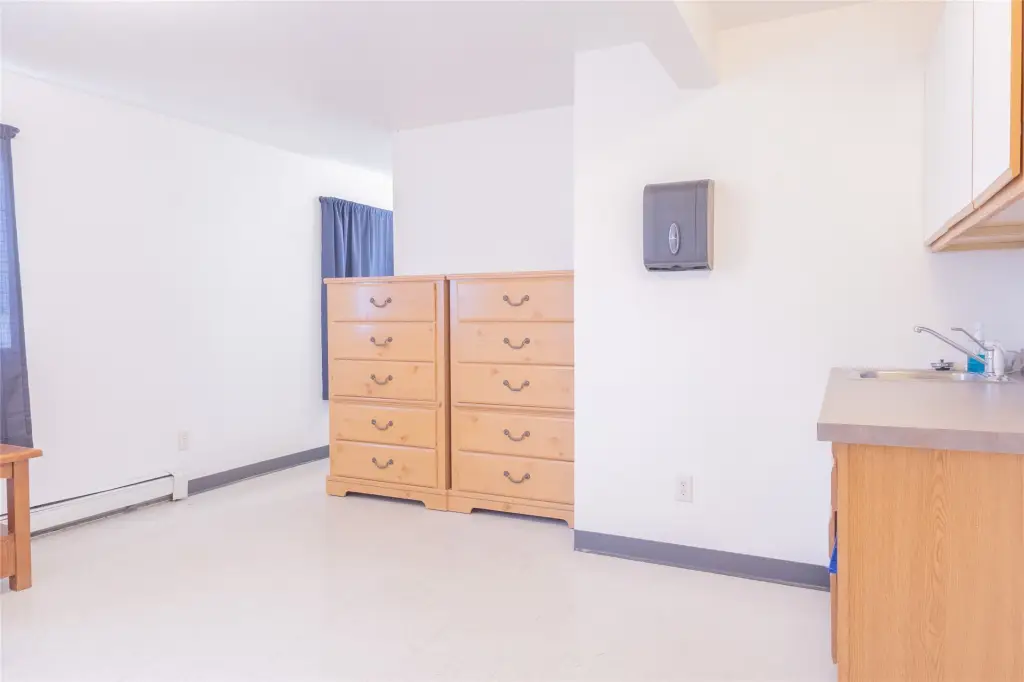
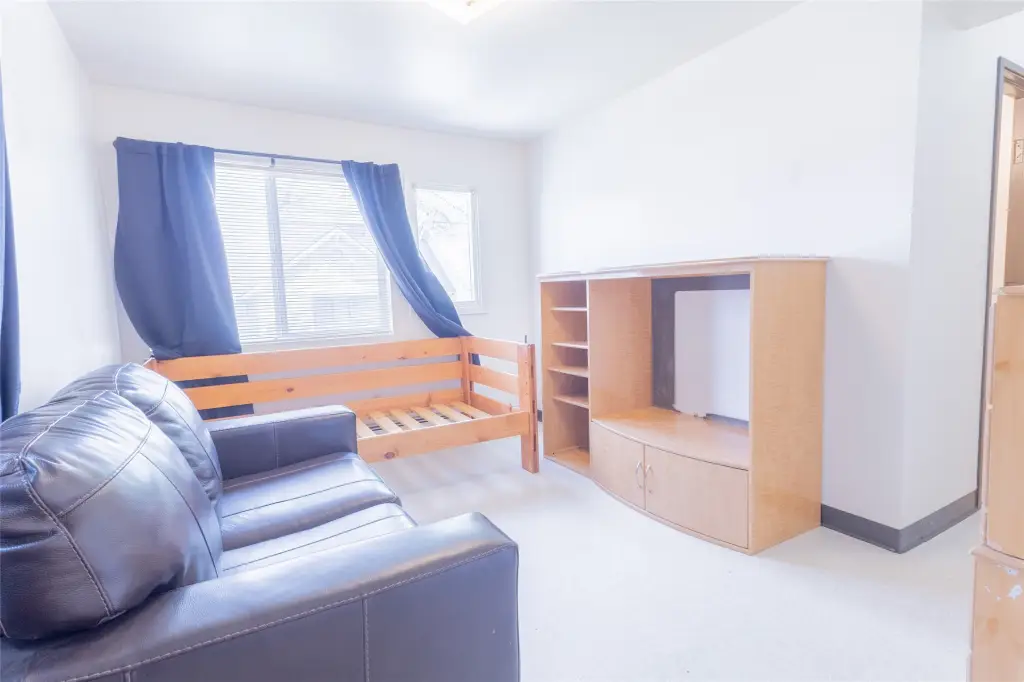
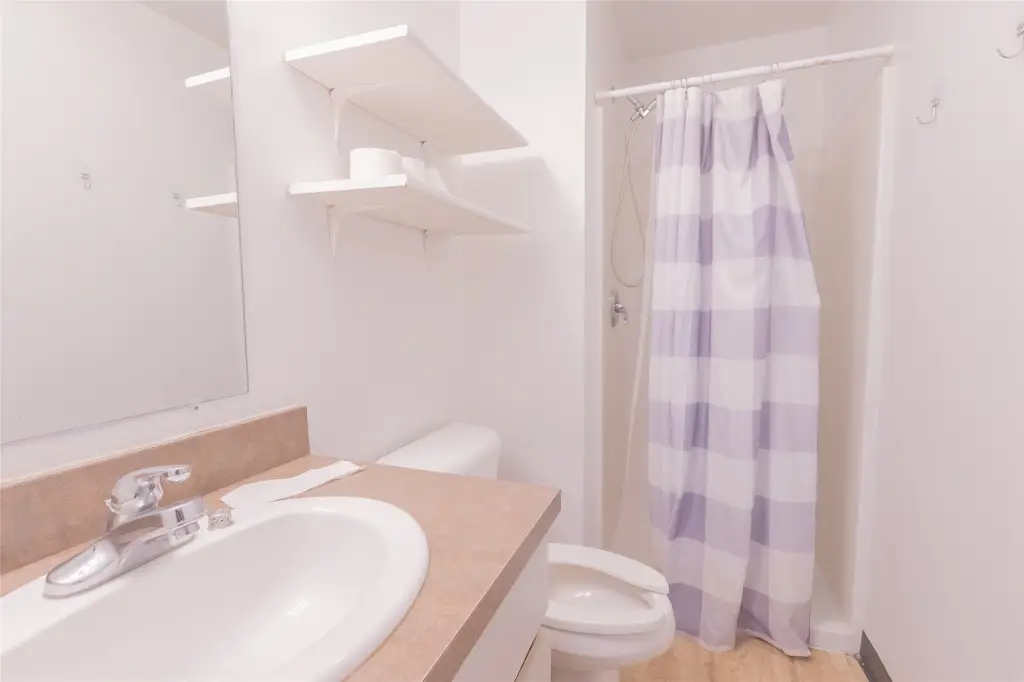
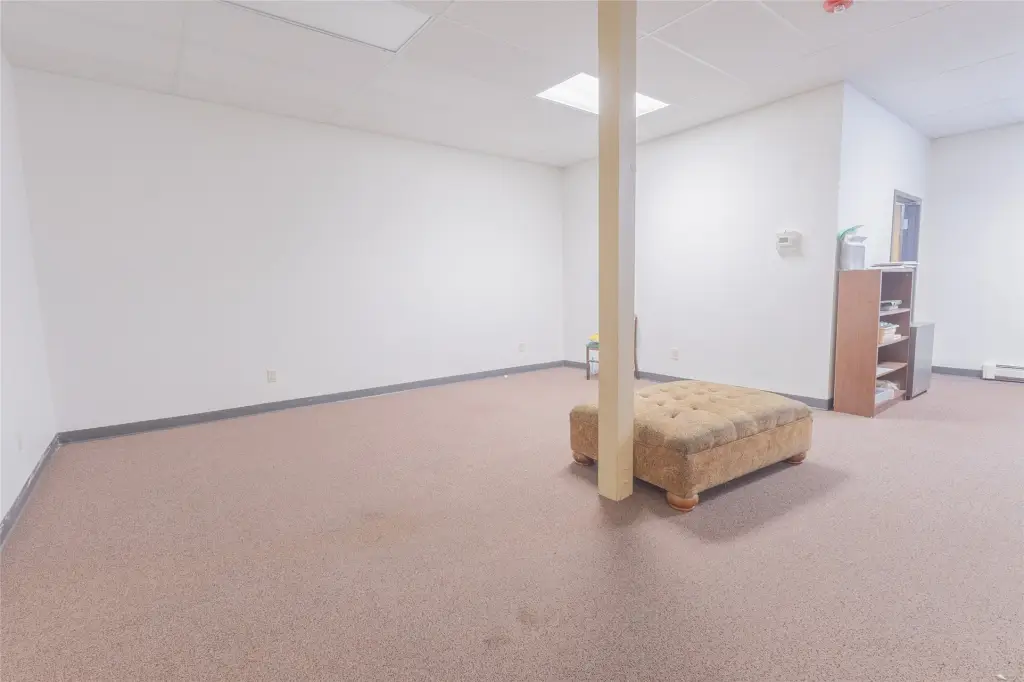
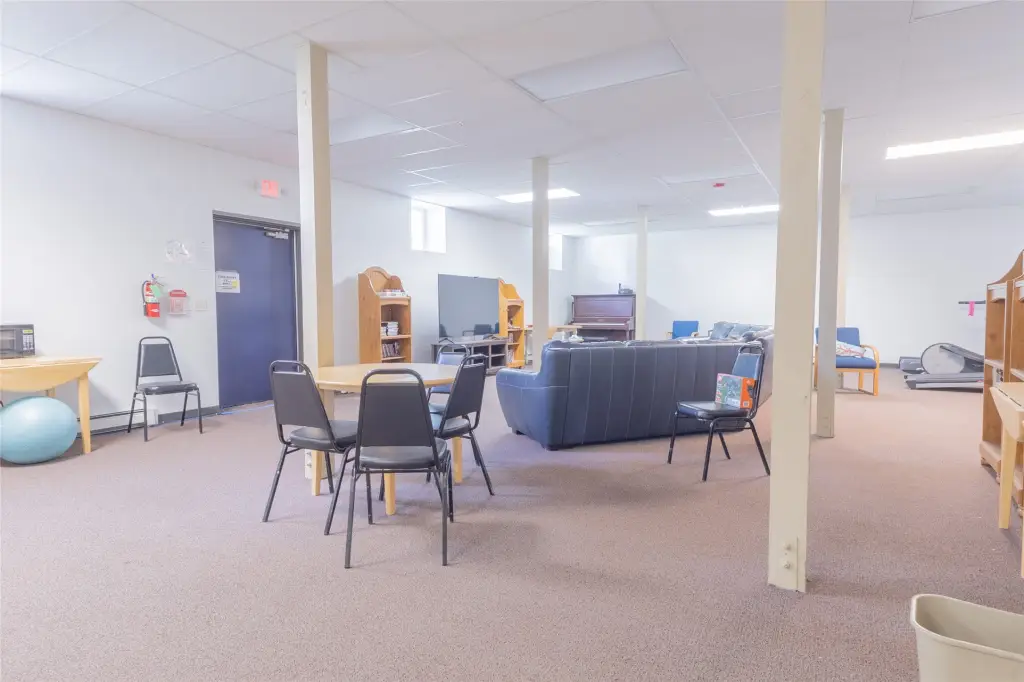
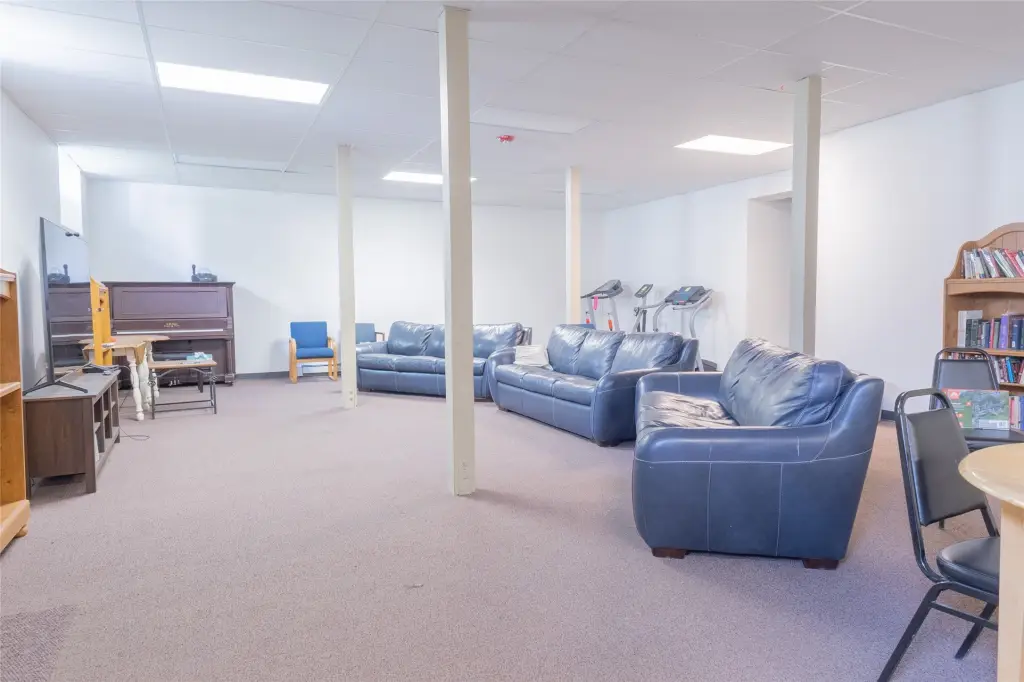
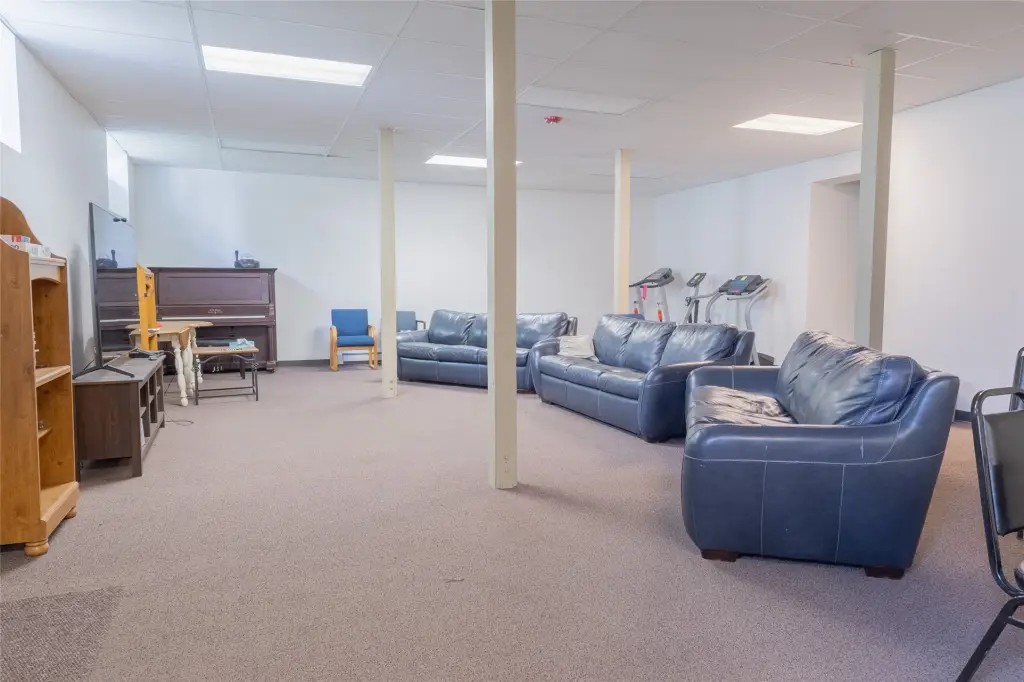
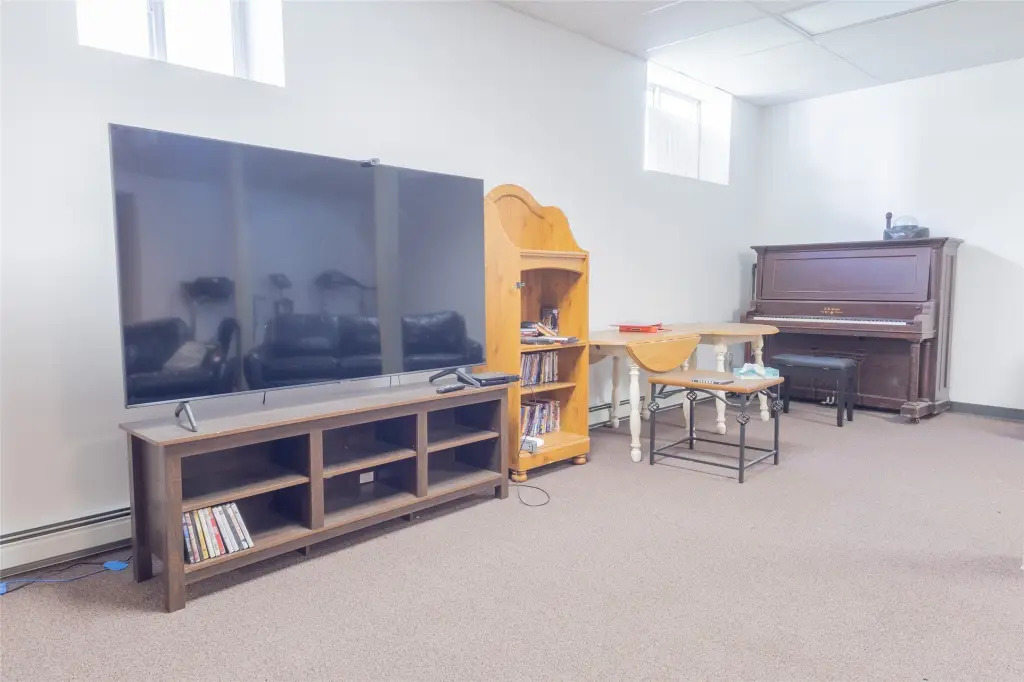
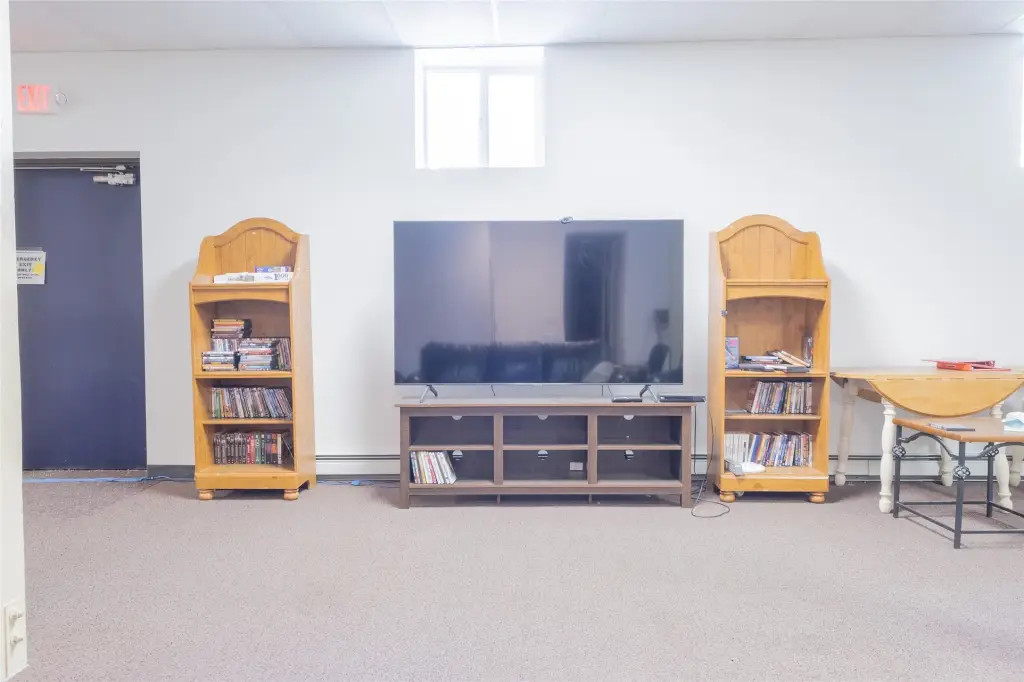
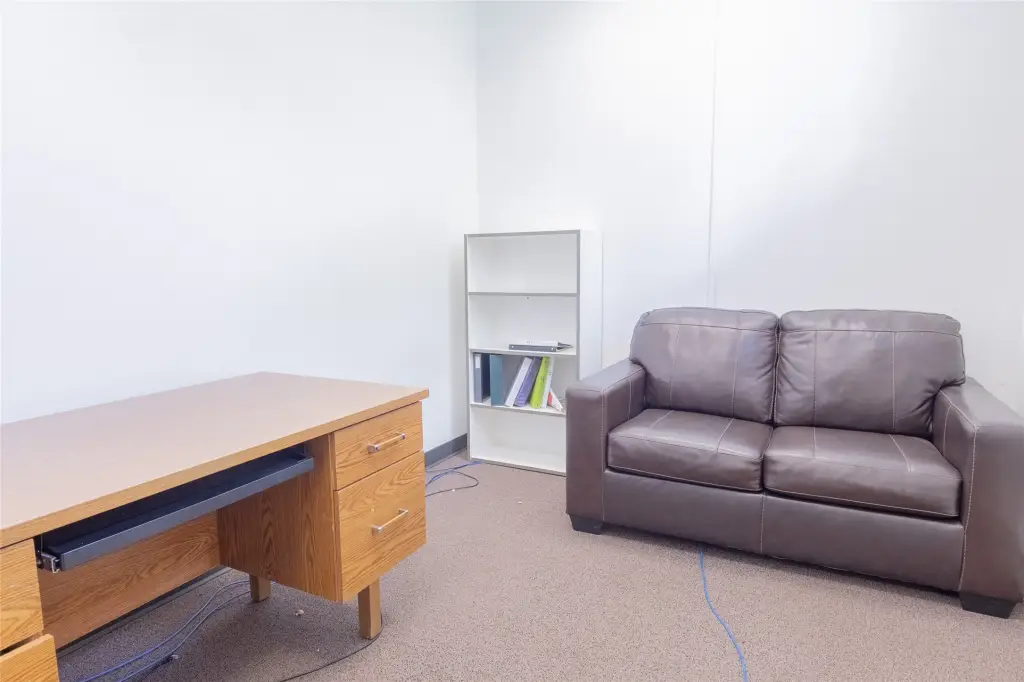
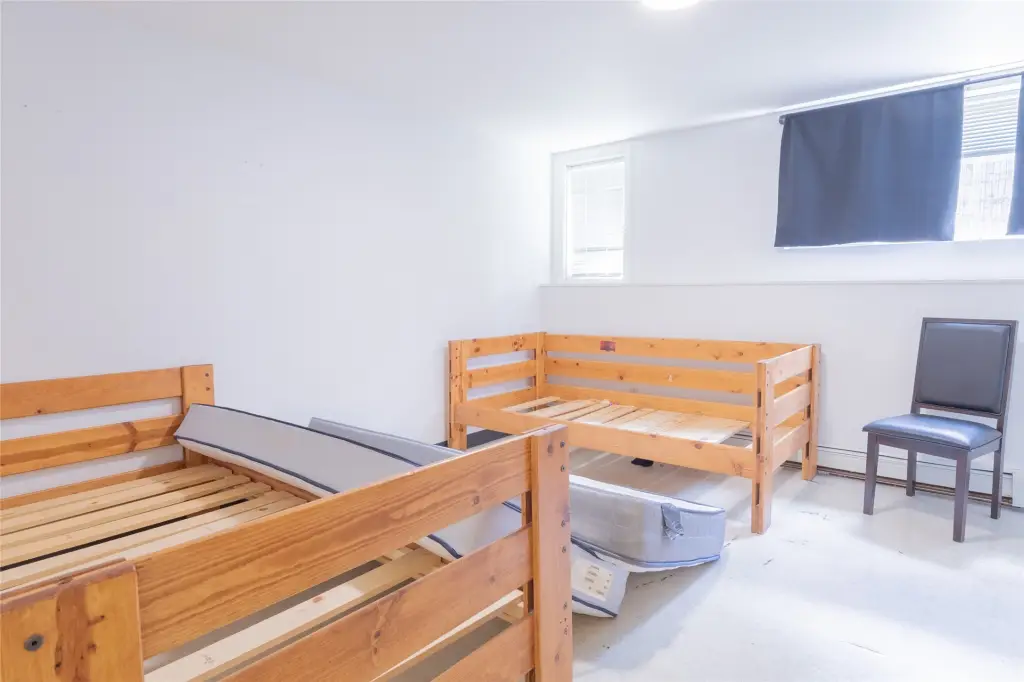
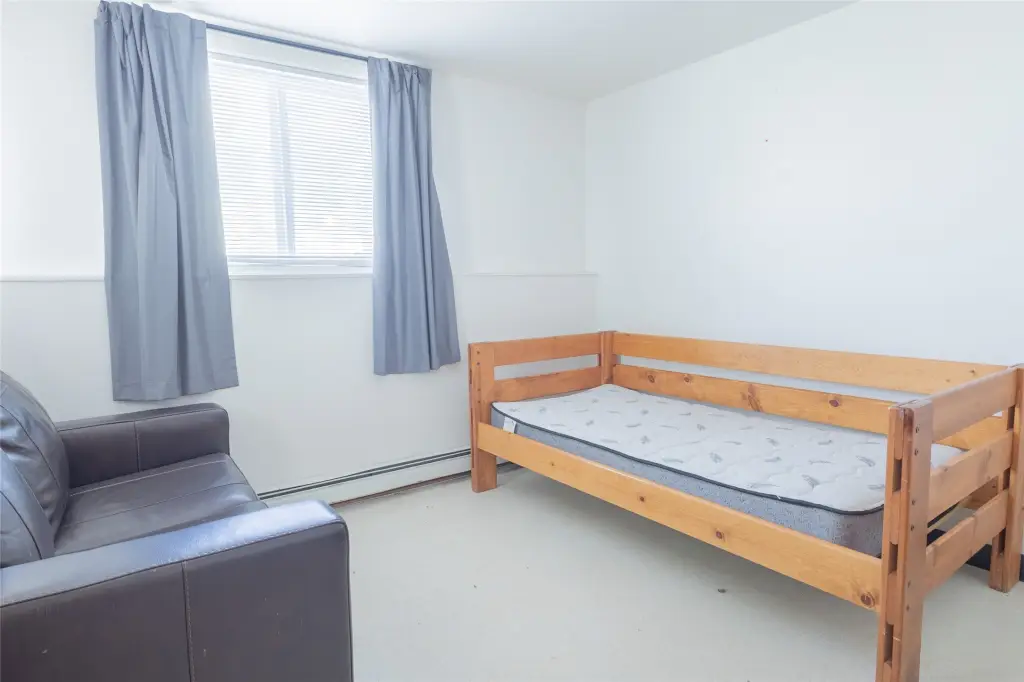
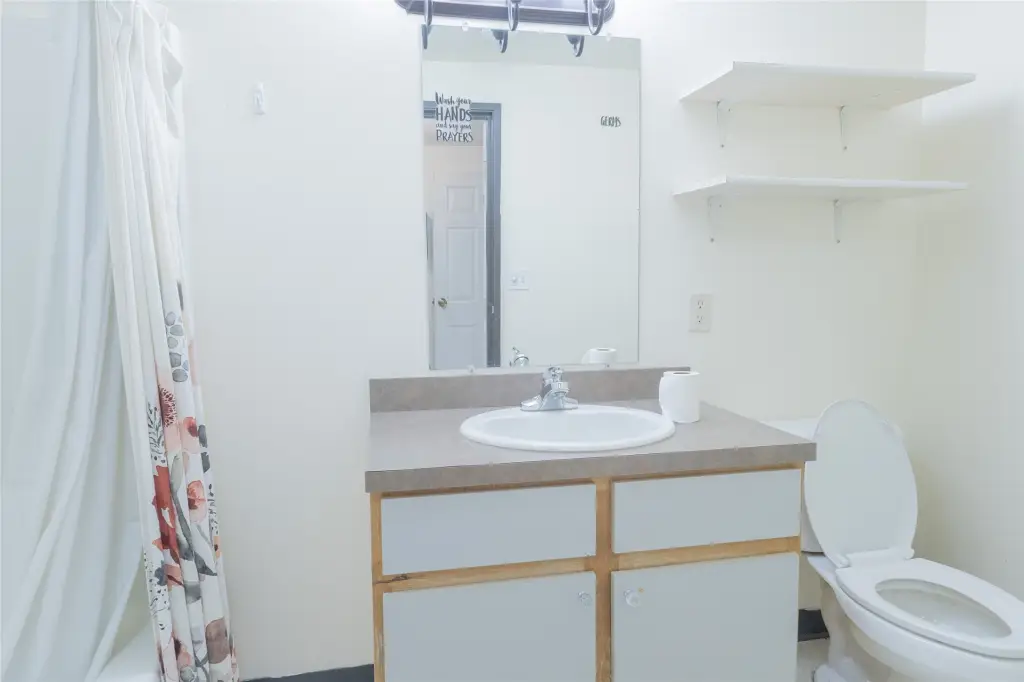
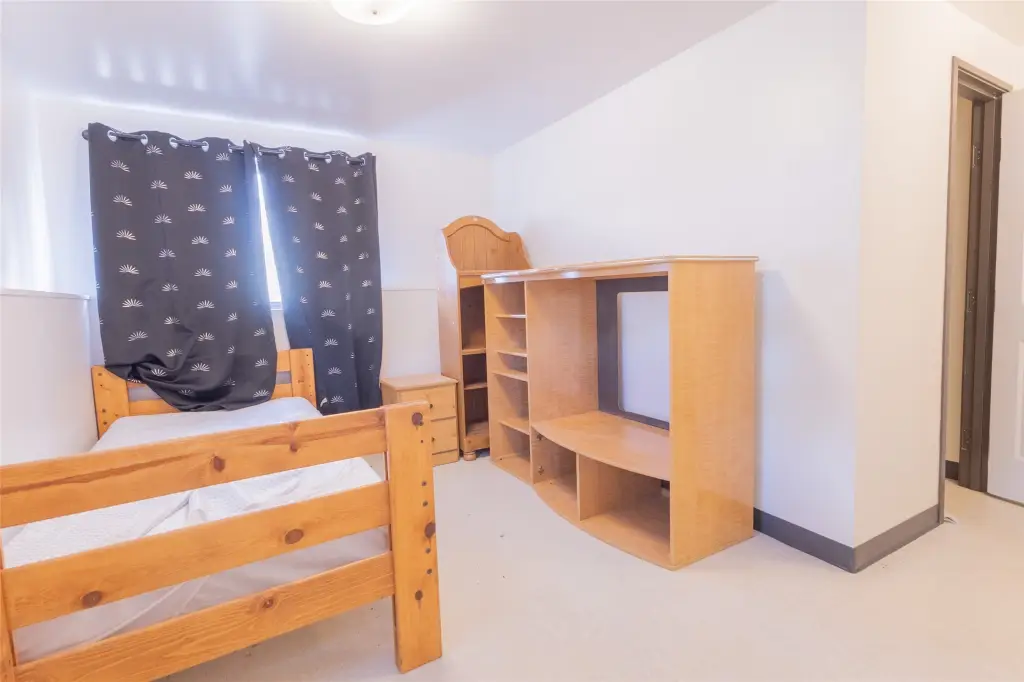
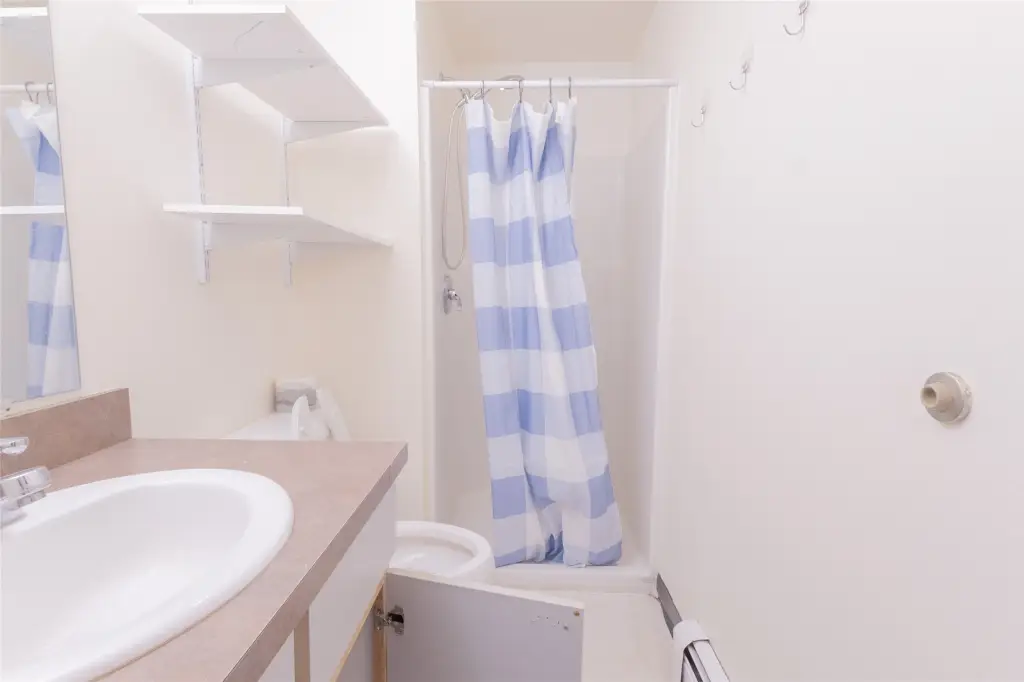
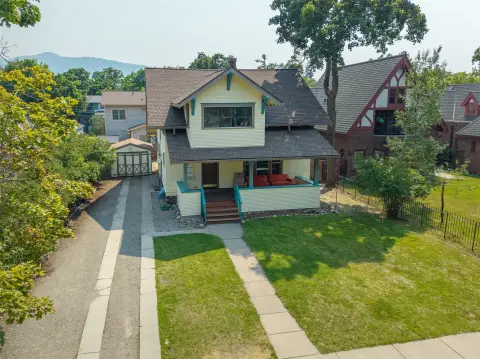
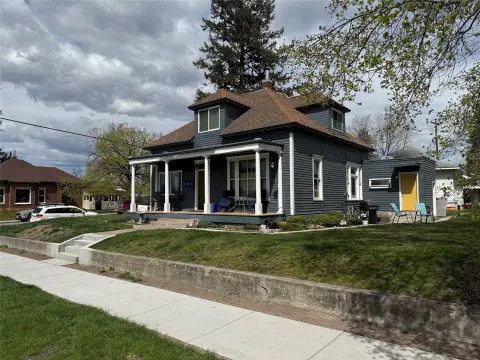
Built in 1930, this multifamily property combines a triplex with a separate group-home style residence. The triplex includes three 2-bedroom, 1-bath units. The additional residence provides 6 private bedroom-and-bathroom suites, multiple common areas, 3 offices, a laundry room, a common bath, and a large community kitchen.
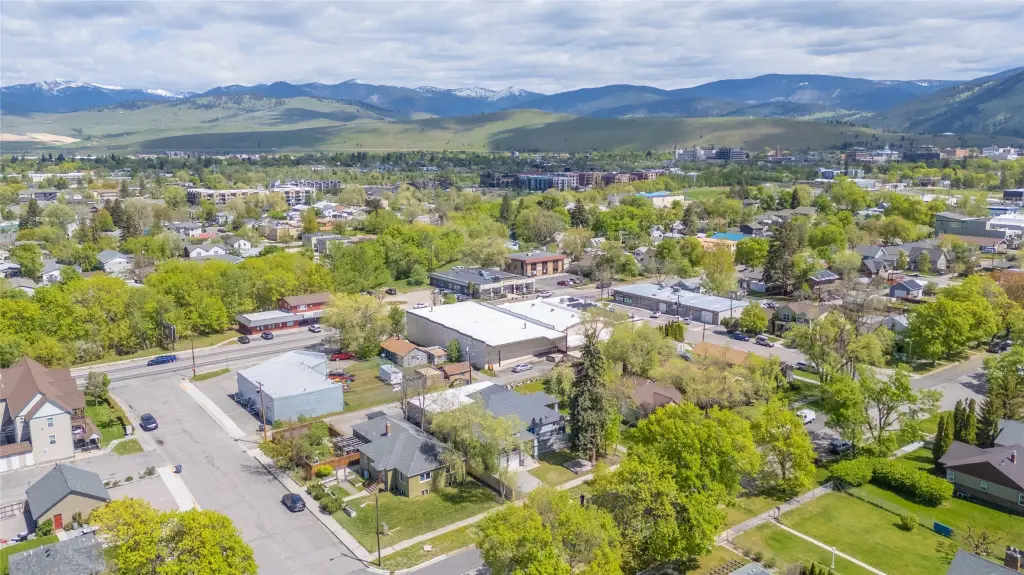
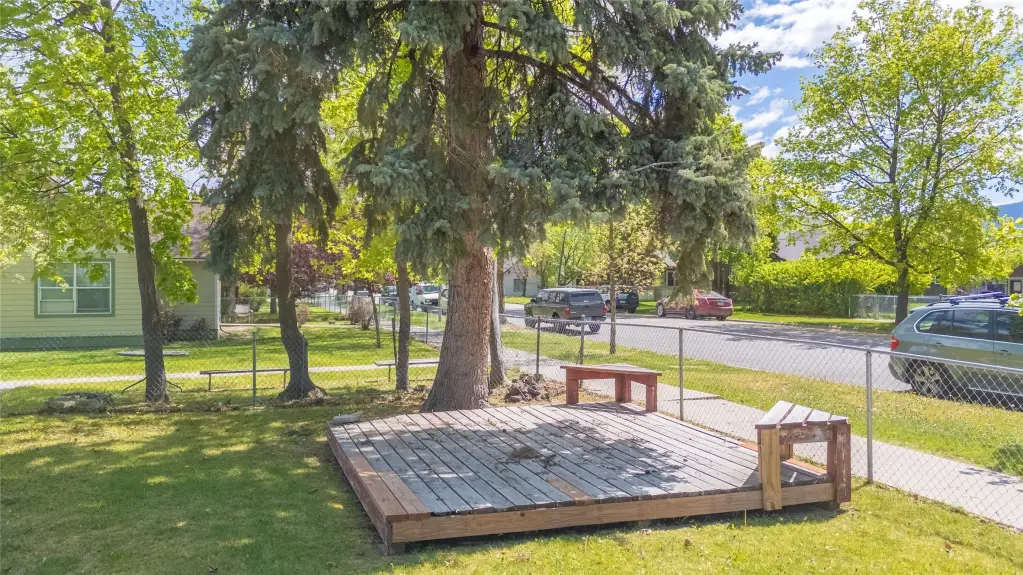
The property is located at 1326–1330 S 4th Street W in Missoula, between Russell and Orange Streets and near a walking trail. The 0.433-acre site is served by public water and public sewer and carries Multi-Family zoning. The varied layout includes both individually configured living spaces and shared facilities, offering a substantial existing residential configuration for evaluation by prospective buyers.
The property is located at 1326–1330 S 4th Street W in Missoula, between Russell and Orange Streets and near a walking trail. The 0.433-acre site is served by public water and public sewer and carries Multi-Family zoning. The varied layout includes both individually configured living spaces and shared facilities, offering a substantial existing residential configuration for evaluation by prospective buyers.
Key Highlights
- Three 2‑bedroom, 1‑bath units in the triplex
- Separate residence with 6 private bedroom‑and‑bathroom suites
- Multiple common areas, 3 offices, laundry room, and community kitchen
Property Analytics
Unlock full access to Insights
Subscribe to Realmo Intelligence
Open Analytics
Current Use
Location Intelligence
Trade Area within ½ mile
732
Businesses Nearby
Explore this area
Business Placement
Demographics for 59801, MT
30,629
Population
15,814
Households
1.9
Avg Household Size
34
Median Age
51%
College-Educated
97%
High-School Grad
7.7 sq mi
ZIP Area
3,978
Density / Sq Mi
$55,022
Median Household Income
$34,320
Median Earnings
$1,086
Median Rent
$393,400
Median Home Value
Check the figures for this property
Cap Rate, Value Estimation, Potential NOI and more
View Realmo Analytics
Market
Vacancy Rate% for Multifamily in West region

Questions? Ask Rey
Realmo’s AI knows this listing — price, zoning, demand, history. Ask anything.



Frequently Asked Questions
What type of property is this?
Multifamily property - Multifamily asset combining separate rental units with a residence configured for private suites and shared living areas.
Where is this multifamily property located?
The property is located at 1326 - 1330 S 4th Street W Missoula, MT.
What is the asking price?
The asking price for this property is $1,300,000.
What are key features of this property?
This property features: Three 2‑bedroom, 1‑bath units in the triplex; Separate residence with 6 private bedroom‑and‑bathroom suites; Multiple common areas, 3 offices, laundry room, and community kitchen