Remodeled Six-Office
For Sale
$429,000
1311 Hickory Street, Abilene, TX 79601
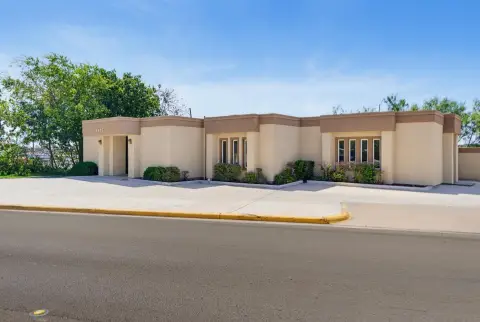
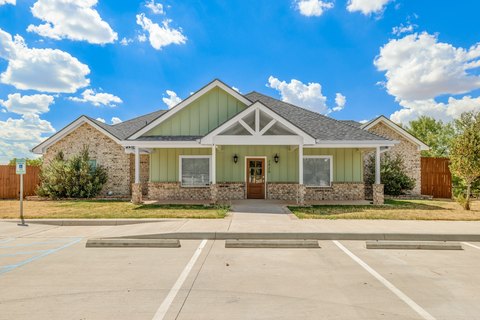
Updated interior offers reception space, storage, and parking at both the front and rear of the property.
Property Size2,000 SF
Price / SF$220
Days on Market68
Property Features for 1311 Hickory Street
General Information
Standard status
Active
Size
2,000 SF
Property subtype
Office
Building Details
Year Built
1956
Buildings
1
Building Size
2,000 SF
Listing Agency:
Barnett & Hill
(325) 677-3500
Listed By:
Timothy Smith · License #0824681
(904) 465-4345
Source:
Lonestarluxuryrealty
Added: Aug 1
Changed: Sep 24
Last Checked: Oct 7 at 1:33PM
Displayed information is deemed reliable but is not guaranteed and should be independently verified. All listing content including descriptions, pricing, images are the copyrighted material of Barnett & Hill
Investment Insights
Based on property information with market context.
This office building, constructed in 1956, has been substantially refreshed with new LVT flooring, paint, lighting, plumbing, and electrical work. The layout includes six private offices, two restrooms, a reception lobby, and dedicated storage areas. A central interior corridor runs through the building and connects multiple entry points, while also providing room for shelving, storage, or other workspace needs.
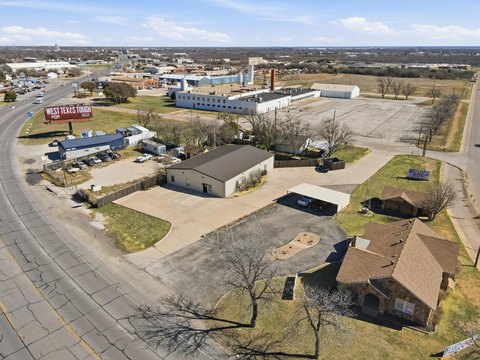
Parking is available at the front and through a rear entry area. The property is located at 1311 Hickory Street in Abilene, Texas. The building is offered for sale, and leasing may also be considered for a qualified applicant.
Parking is available at the front and through a rear entry area. The property is located at 1311 Hickory Street in Abilene, Texas. The building is offered for sale, and leasing may also be considered for a qualified applicant.
Key Highlights
- Six private offices with two restrooms
- New LVT flooring, paint, light fixtures, plumbing, and electrical
- Reception lobby plus dedicated storage areas
Financial Insights
Estimated NOI and Cap Rate
NOI / Yr
$21,630
Cap Rate
5.04%
Suggested Prices Based on Cap Rates
Cap Rate 5%
$432,600
$432.6K
Cap Rate 7%
$309,000
$309.0K
Cap Rate 9%
$240,333
$240.3K
Market Conditions
NOI Build-Up for 1,950 SF
Gross rent
$33.9K $17.40/SF
− Vacancy
−$5.1K −$2.61/SF
EGI
$28.8K $14.79/SF
− OpEx
−$7.2K −$3.70/SF
NOI
$21.6K $11.09/SF
Area
Abilene, TX
Vacancy
15.00%
Lease Rate
$17.40 /SF/Yr
Expense Ratio
25.00%
Simulate Cap Rate and NOI
Suggested Prices Based on Cap Rates
Cap Rate 5%
$432,600
Cap Rate 7%
$309,000
Cap Rate 9%
$240,333
Alternative Uses
Best Use
Office B
$309.0K
$270.4K – $360.5K
NOI $21,630 @ 7.0% cap · market cap 5.04%
Second Best
—
—
no second resolved use
Theoretical Best
Office A
$435.4K
$381.0K – $507.9K
NOI $30,476 @ 7.0% cap · market cap 7.10%
Zoning and permitted uses should be independently verified with authorities.
Property Analytics
Unlock full access to Insights
Subscribe to Realmo Intelligence
Open Analytics
Current Use
Location Intelligence
Trade Area within ½ mile
1,021
Businesses Nearby
Explore this area
Business Placement
Demographics for 79601, TX
26,515
Population
9,422
Households
2.8
Avg Household Size
32
Median Age
21%
College-Educated
84%
High-School Grad
263.0 sq mi
ZIP Area
101
Density / Sq Mi
$54,515
Median Household Income
$24,704
Median Earnings
$988
Median Rent
$182,900
Median Home Value
Check the figures for this property
Cap Rate, Value Estimation, Potential NOI and more
View Realmo Analytics
Market
Vacancy Rate% for Office in South region

Questions? Ask Rey
Realmo’s AI knows this listing — price, zoning, demand, history. Ask anything.





Frequently Asked Questions
What type of property is this?
Office building - Updated interior offers reception space, storage, and parking at both the front and rear of the property.
Where is this office building located?
The property is located at 1311 Hickory Street Abilene, TX.
What is the asking price?
The asking price for this property is $429,000.
What are key features of this property?
This property features: Six private offices with two restrooms; New LVT flooring, paint, light fixtures, plumbing, and electrical; Reception lobby plus dedicated storage areas


