Two-Story Office
For Sale
Contact for pricing
800 E Walnut St, Springfield, MO 65806
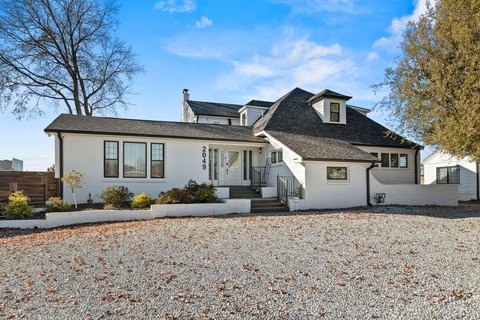
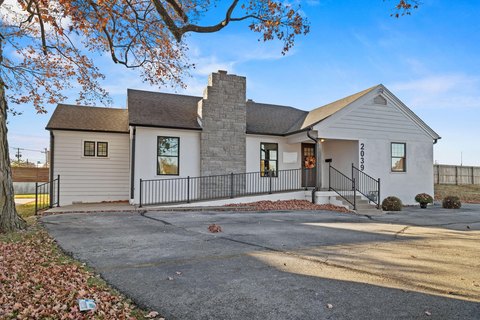
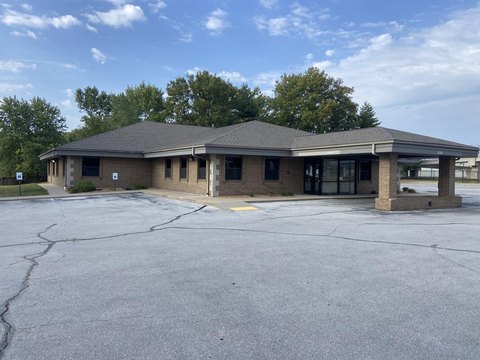
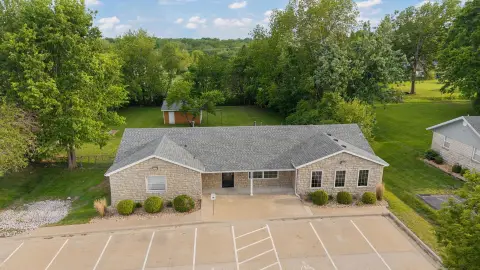
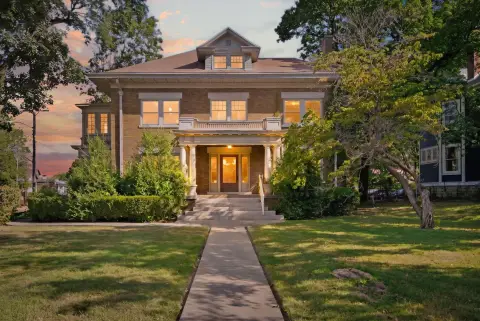
Standalone two-story office building with multiple rooms, a kitchen, and a basement.
Property Size3,260 SF
Price / SF$153.37
Days on Market535
Property Features for 800 E Walnut St
General Information
Standard status
Active
Size
3,260 SF
Property subtype
OFFICE
Amenities
full kitchen
laundry room
Building Details
Stories
2
Listing Agency:
SVN | Rankin Company, LLC
(417) 887-8826
Listed By:
Jeff Childs, SIOR, CCIM · License #1999029641
(417) 860-5447
Source:
Moodyscre
Added: Apr 21, 2025
Changed: Sep 11
Last Checked: Oct 5 at 7:54PM
Displayed information is deemed reliable but is not guaranteed and should be independently verified. All listing content including descriptions, pricing, images are the copyrighted material of SVN | Rankin Company, LLC
Investment Insights
Based on property information with market context.
Standalone two-story office building with an attic and basement, currently occupied by a commercial tenant. The first floor includes two large rooms, one smaller room, a full kitchen, a laundry room, and one restroom. The second floor provides five rooms and an additional restroom.
The property is located along Historic Walnut Street near downtown Springfield and Missouri State University. Multiple restaurants, shops, and other amenities are within walking distance.
The building’s layout offers separate room groupings across both floors, with basement and attic space included as part of the overall improvement.
The property is located along Historic Walnut Street near downtown Springfield and Missouri State University. Multiple restaurants, shops, and other amenities are within walking distance.
The building’s layout offers separate room groupings across both floors, with basement and attic space included as part of the overall improvement.
Key Highlights
- Currently occupied by a commercial tenant
- Standalone two‑story building along Historic Walnut Street
- Two floors plus attic and basement for additional space
Financial Insights
Estimated NOI and Cap Rate
NOI / Yr
$25,832
Cap Rate
5.17%
Suggested Prices Based on Cap Rates
Cap Rate 5%
$516,640
$516.6K
Cap Rate 7%
$369,029
$369.0K
Cap Rate 9%
$287,022
$287.0K
Market Conditions
NOI Build-Up for 3,260 SF
Gross rent
$36.0K $11.04/SF
− Vacancy
−$1.5K −$0.47/SF
EGI
$34.4K $10.57/SF
− OpEx
−$8.6K −$2.64/SF
NOI
$25.8K $7.92/SF
Area
Springfield, MO
Vacancy
4.30%
Lease Rate
$11.04 /SF/Yr
Expense Ratio
25.00%
Simulate Cap Rate and NOI
Suggested Prices Based on Cap Rates
Cap Rate 5%
$516,640
Cap Rate 7%
$369,029
Cap Rate 9%
$287,022
Alternative Uses
Best Use
Office B
$369.0K
$322.9K – $430.5K
NOI $25,832 @ 7.0% cap · market cap 5.17%
Second Best
—
—
no second resolved use
Theoretical Best
Office A
$492.0K
$430.5K – $574.1K
NOI $34,443 @ 7.0% cap · market cap 6.89%
Zoning and permitted uses should be independently verified with authorities.
Property Analytics
Unlock full access to Insights
Subscribe to Realmo Intelligence
Open Analytics
Current Use
Location Intelligence
Trade Area within ½ mile
1,592
Businesses Nearby
Explore this area
Business Placement
Demographics for 65806, MO
12,529
Population
8,049
Households
1.6
Avg Household Size
27
Median Age
22%
College-Educated
87%
High-School Grad
2.1 sq mi
ZIP Area
5,966
Density / Sq Mi
$28,450
Median Household Income
$21,090
Median Earnings
$840
Median Rent
$85,700
Median Home Value
Check the figures for this property
Cap Rate, Value Estimation, Potential NOI and more
View Realmo Analytics
Market
Vacancy Rate% for Office in Midwest region

Questions? Ask Rey
Realmo’s AI knows this listing — price, zoning, demand, history. Ask anything.



Frequently Asked Questions
What type of property is this?
Office building - Standalone two-story office building with multiple rooms, a kitchen, and a basement.
Where is this office building located?
The property is located at 800 E Walnut St Springfield, MO.
What is the asking price?
The asking price for this property is $500,000.
What are key features of this property?
This property features: Currently occupied by a commercial tenant; Standalone two‑story building along Historic Walnut Street; Two floors plus attic and basement for additional space