Standalone Professional Office
For Sale
$1,250,000
13 Bartlet St, Andover, MA 01810
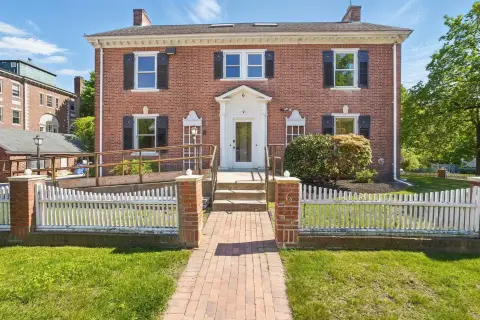
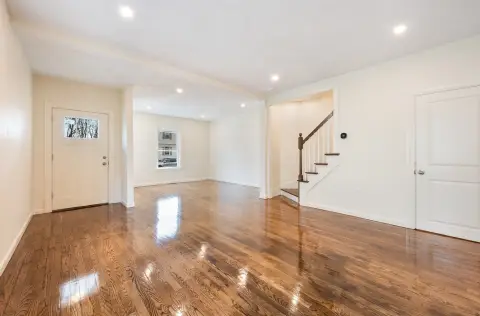
Standalone office building with renovated furnished interiors, reception, conference room, private offices, and central air.
Property Size3,205 SF
Price / SF$390.02
Days on Market93
Property Features for 13 Bartlet St
General Information
Standard status
Active
Size
3,205 SF
Total Parking Spaces
5
Property subtype
Commercial
Additional Details
Furnished
Yes
Highway Access
Yes
Taxes and HOA fees
Annual Taxes
$25,715
Amenities
reception area
conference room
private offices
gas fireplace
built-ins
kitchen
private bathrooms
finished lower level
central air conditioning
security system
garage
Building Details
Building Size
3,205 SF
Year Built
1900
Listing Agency:
LAER Realty Partners
Listed By:
Robyn Magenheim
(978) 815-9475
Source:
Classifiedrealtygroup
Added: Jul 22
Changed: Oct 8
Last Checked: Oct 20 at 5:52PM
Displayed information is deemed reliable but is not guaranteed and should be independently verified. All listing content including descriptions, pricing, images are the copyrighted material of LAER Realty Partners

Ask AI about this property
Review the available facts, identify missing information and prepare questions for the agent.
Investment Insights
Based on property information with market context.
This standalone professional office building is offered as a furnished, renovated space designed for everyday business use. The interior features a large welcoming reception area that connects to a conference room with natural light, along with five private offices. Additional improvements include a kitchen, two private handicap accessible bathrooms, a finished lower level, central air, and a security system.
The property provides five private parking spaces, including a garage, plus additional parking available at a municipal lot across the street. The building is located in downtown Andover with surrounding shops, restaurants, and services, and offers easy access to highways and commuter rail.
The office layout supports client-facing front-of-house space through the reception and conference room, while maintaining separate private offices for focused work.
The property provides five private parking spaces, including a garage, plus additional parking available at a municipal lot across the street. The building is located in downtown Andover with surrounding shops, restaurants, and services, and offers easy access to highways and commuter rail.
The office layout supports client-facing front-of-house space through the reception and conference room, while maintaining separate private offices for focused work.
Key Highlights
- Standalone professional office building with 3,205 SF renovated furnished interior (built 1900)
- Includes a large reception area, conference room with natural light, kitchen, and finished lower level
- Five private offices with gas fireplace, built‑ins, and outstanding views
Financial Insights
Estimated NOI and Cap Rate
NOI / Yr
$89,333
Cap Rate
7.15%
Suggested Prices Based on Cap Rates
Cap Rate 5%
$1,786,660
$1.8M
Cap Rate 7%
$1,276,186
$1.3M
Cap Rate 9%
$992,589
$992.6K
Market Conditions
NOI Build-Up for 3,205 SF
Gross rent
$146.1K $45.60/SF
− Vacancy
−$27.0K −$8.44/SF
EGI
$119.1K $37.16/SF
− OpEx
−$29.8K −$9.29/SF
NOI
$89.3K $27.87/SF
Area
Essex County, MA
Vacancy
18.50%
Lease Rate
$45.60 /SF/Yr
Expense Ratio
25.00%
Simulate Cap Rate and NOI
Suggested Prices Based on Cap Rates
Cap Rate 5%
$1,786,660
Cap Rate 7%
$1,276,186
Cap Rate 9%
$992,589
Alternative Uses
Best Use
Office B
$1.28M
$1.12M – $1.49M
NOI $89,333 @ 7.0% cap · market cap 7.15%
Second Best
—
—
no second resolved use
Theoretical Best
Office A
$1.90M
$1.66M – $2.21M
NOI $132,814 @ 7.0% cap · market cap 10.63%
Zoning and permitted uses should be independently verified with authorities.
How Realmo checks its estimates
Property Analytics
Who owns this building?
See the owner, sales and loan history
Open Analytics
Current Use
Lease Details
Yes
Highway access
Location Intelligence
Trade Area within ½ mile
1,664
Businesses Nearby
Explore this area
Business Placement
Demographics for 01810, MA
35,621
Population
13,803
Households
2.6
Avg Household Size
43
Median Age
75%
College-Educated
97%
High-School Grad
30.5 sq mi
ZIP Area
1,168
Density / Sq Mi
$167,591
Median Household Income
$86,838
Median Earnings
$2,046
Median Rent
$813,800
Median Home Value
Check the figures for this property
Cap Rate, Value Estimation, Potential NOI and more
View Realmo Analytics
Market
Vacancy Rate% for Office in Northeast region



Frequently Asked Questions
What type of property is this?
Office building - Standalone office building with renovated furnished interiors, reception, conference room, private offices, and central air.
Where is this office building located?
The property is located at 13 Bartlet St Andover, MA.
What is the asking price?
The asking price for this property is $1,250,000.
What are key features of this property?
This property features: Standalone professional office building with 3,205 SF renovated furnished interior (built 1900); Includes a large reception area, conference room with natural light, kitchen, and finished lower level; Five private offices with gas fireplace, built‑ins, and outstanding views