Retail Space with Back
For Sale
$1,615,000
110-80 W Main St, Frisco, CO 80443
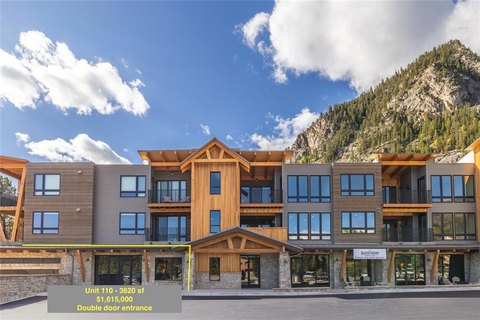
Retail unit in a new luxury building with a large back patio and easy access from I-70.
Property Size3,620 SF
Price / SF$446.13
Days on Market582
Property Features for 110-80 W Main St
General Information
Standard status
Active
Size
3,620 SF
Additional Details
Highway Access
Yes
Amenities
large back patio
Listing Agency:
Slifer Smith & Frampton R.E.
(970) 453-9090
Listed By:
Joan Moats · License #40042584
(970) 333-4470
Source:
Exprealty
Added: Mar 21, 2025
Changed: Oct 15
Last Checked: Oct 23 at 11:45AM
Displayed information is deemed reliable but is not guaranteed and should be independently verified. All listing content including descriptions, pricing, images are the copyrighted material of Slifer Smith & Frampton R.E.

Ask AI about this property
Review the available facts, identify missing information and prepare questions for the agent.
Investment Insights
Based on property information with market context.
This for-sale retail unit is located in a new luxury building and is suited for concepts such as a restaurant, wellness spa, or sporting goods business. In addition to the unit’s interior space, the offering includes a large back patio intended to accommodate extra seating.
The property is accessible from I-70, providing convenient drive-in access for traffic heading toward Vail or Copper Mountain. It is surrounded by a residential community of outdoor enthusiasts, creating a built-in customer base for day-to-day retail and wellness activity.
Other units are available within the same building. Please contact the listing team for details on configurations and availability.
The property is accessible from I-70, providing convenient drive-in access for traffic heading toward Vail or Copper Mountain. It is surrounded by a residential community of outdoor enthusiasts, creating a built-in customer base for day-to-day retail and wellness activity.
Other units are available within the same building. Please contact the listing team for details on configurations and availability.
Key Highlights
- 3620 sq ft retail unit in a new luxury building
- Includes a large back patio for extra seating
- Easy access from I‑70 to capture traffic heading to Vail or Copper Mountain
Financial Insights
Estimated NOI and Cap Rate
NOI / Yr
$70,080
Cap Rate
4.34%
Suggested Prices Based on Cap Rates
Cap Rate 5%
$1,401,600
$1.4M
Cap Rate 7%
$1,001,143
$1.0M
Cap Rate 9%
$778,667
$778.7K
Market Conditions
NOI Build-Up for 3,620 SF
Gross rent
$97.7K $27.00/SF
− Vacancy
−$4.3K −$1.19/SF
EGI
$93.4K $25.81/SF
− OpEx
−$23.4K −$6.45/SF
NOI
$70.1K $19.36/SF
Area
Summit County, CO
Vacancy
4.40%
Lease Rate
$27.00 /SF/Yr
Expense Ratio
25.00%
Simulate Cap Rate and NOI
Suggested Prices Based on Cap Rates
Cap Rate 5%
$1,401,600
Cap Rate 7%
$1,001,143
Cap Rate 9%
$778,667
Alternative Uses
Best Use
Specialty Retail
$1.00M
$876.0K – $1.17M
NOI $70,080 @ 7.0% cap · market cap 4.34%
Second Best
Retail
$795.0K
$695.6K – $927.5K
NOI $55,647 @ 7.0% cap · market cap 3.45%
Theoretical Best
Warehouse
$72.05M
$63.05M – $84.06M
NOI $5,043,620 @ 7.0% cap · market cap 312.30%
Zoning and permitted uses should be independently verified with authorities.
How Realmo checks its estimates
Property Analytics
Current Use
Lease Details
Yes
Highway access
Location Intelligence
Trade Area within ½ mile
928
Businesses Nearby
Explore this area
Business Placement
Demographics for 80443, CO
4,170
Population
5,552
Households
0.8
Avg Household Size
41
Median Age
60%
College-Educated
98%
High-School Grad
102.1 sq mi
ZIP Area
41
Density / Sq Mi
$112,179
Median Household Income
$51,450
Median Earnings
$2,542
Median Rent
$844,400
Median Home Value
Market
Vacancy Rate% for Retail in West region



Frequently Asked Questions
What type of property is this?
Retail space - Retail unit in a new luxury building with a large back patio and easy access from I-70.
Where is this retail space located?
The property is located at 110-80 W Main St Frisco, CO.
What is the asking price?
The asking price for this property is $1,615,000.
What are key features of this property?
This property features: 3620 sq ft retail unit in a new luxury building; Includes a large back patio for extra seating; Easy access from I‑70 to capture traffic heading to Vail or Copper Mountain


