Rare 9-Unit Industrial
For Sale
Contact for pricing
12901 Budlong Ave, Gardena, CA 90247
Low maintenance industrial property in the heart of Gardena.
Property Size11,000 SF
Price / SF$268.18
Days on Market276
Property Features for 12901 Budlong Ave
General Information
Standard status
Active
Size
11,000 SF
Property subtype
Industrial
Building Details
Year Built
1968
Listing Agency:
ATLAS GROUP - EXP REALTY
Listed By:
Donald La · License #CA 01928418
(626) 824-8853
Source:
Crexi
Added: Jan 14
Changed: Oct 15
Last Checked: Oct 16 at 9:35AM
Displayed information is deemed reliable but is not guaranteed and should be independently verified. All listing content including descriptions, pricing, images are the copyrighted material of ATLAS GROUP - EXP REALTY

Ask AI about this property
Review the available facts, identify missing information and prepare questions for the agent.
Investment Insights
Based on property information with market context.
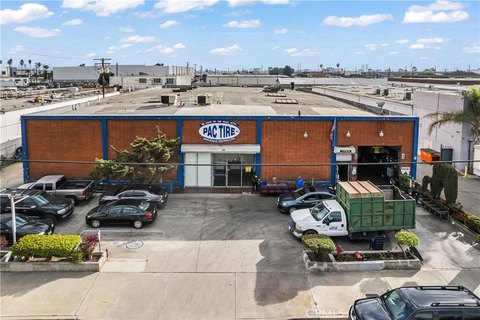
This industrial property in Gardena features nine individual free-span units across two buildings, totaling approximately 11,000 square feet. The property has been under the same ownership for over six decades. Each unit is separately metered for electricity and gas and includes its own ground-level roll-up door. An owner storage room is available for tools and maintenance supplies. Open parking spaces are located in the rear of the property, with additional street parking available. A gated entrance provides added security. All tenants are on month-to-month leases, offering flexibility for owner-users or investors. The property has low historical vacancy and is easy to manage. It is located close to the 105 and 110 Freeways, 2.1 miles from SpaceX, 3.1 miles from Costco Business Center, 5 miles from SoFi Stadium, and 8.9 miles from LAX.
Key Highlights
- Rare 9‑unit industrial property - first time on market in 63 years.
- Excellent location in the heart of Gardena with close proximity to 105 and 110 freeways.
- Nine individual free‑span units with separate meters and roll‑up doors.
Financial Insights
Estimated NOI and Cap Rate
NOI / Yr
$128,547
Cap Rate
4.36%
Suggested Prices Based on Cap Rates
Cap Rate 5%
$2,570,940
$2.6M
Cap Rate 7%
$1,836,386
$1.8M
Cap Rate 9%
$1,428,300
$1.4M
Market Conditions
NOI Build-Up for 11,000 SF
Gross rent
$195.4K $17.76/SF
− Vacancy
−$11.7K −$1.07/SF
EGI
$183.6K $16.69/SF
− OpEx
−$55.1K −$5.01/SF
NOI
$128.5K $11.69/SF
Area
Los Angeles County, CA
Vacancy
6.00%
Lease Rate
$17.76 /SF/Yr
Expense Ratio
30.00%
Simulate Cap Rate and NOI
Suggested Prices Based on Cap Rates
Cap Rate 5%
$2,570,940
Cap Rate 7%
$1,836,386
Cap Rate 9%
$1,428,300
Alternative Uses
Best Use
Industrial
$1.84M
$1.61M – $2.14M
NOI $128,547 @ 7.0% cap · market cap 4.36%
Second Best
—
—
no second resolved use
Theoretical Best
Office A
$5.89M
$5.15M – $6.87M
NOI $412,255 @ 7.0% cap · market cap 13.97%
Zoning and permitted uses should be independently verified with authorities.
How Realmo checks its estimates
Property Analytics
Unlock full access to Insights
Subscribe to Realmo Intelligence
Open Analytics
Current Use
Location Intelligence
Trade Area within ½ mile
957
Businesses Nearby
Explore this area
Business Placement
Demographics for 90247, CA
48,543
Population
17,076
Households
2.8
Avg Household Size
39
Median Age
27%
College-Educated
78%
High-School Grad
3.8 sq mi
ZIP Area
12,774
Density / Sq Mi
$73,851
Median Household Income
$37,000
Median Earnings
$1,751
Median Rent
$640,500
Median Home Value
Check the figures for this property
Cap Rate, Value Estimation, Potential NOI and more
View Realmo Analytics
Market
Vacancy Rate% for Industrial in West region



Frequently Asked Questions
What type of property is this?
Industrial property - Low maintenance industrial property in the heart of Gardena.
Where is this industrial property located?
The property is located at 12901 Budlong Ave Gardena, CA.
What is the asking price?
The asking price for this property is $2,950,000.
What are key features of this property?
This property features: Rare 9‑unit industrial property - first time on market in 63 years.; Excellent location in the heart of Gardena with close proximity to 105 and 110 freeways.; Nine individual free‑span units with separate meters and roll‑up doors.


