Redeveloped Creative Office
For Sale
$4,750,000
1290 Collier Road Northwest, Atlanta, GA 30318
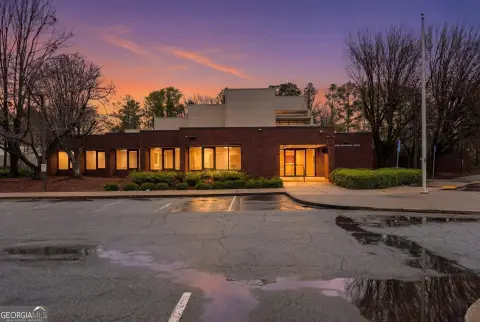
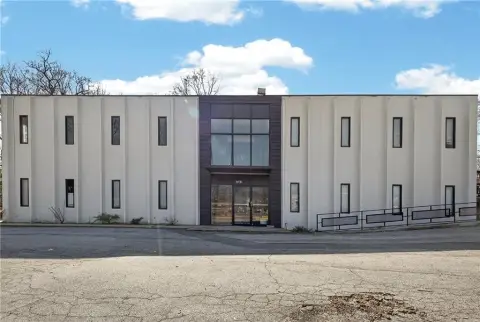
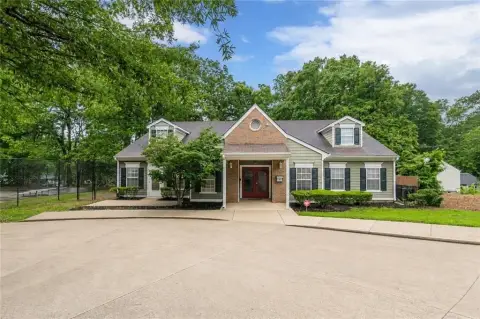
Former industrial improvements now provide private offices, upgraded power, and amenity-rich creative workspace.
Property Size13,237 SF
Price / SF$358.84
Days on Market153
Property Features for 1290 Collier Road Northwest
General Information
Standard status
Active
Size
13,237 SF
Property subtype
Office
Amenities
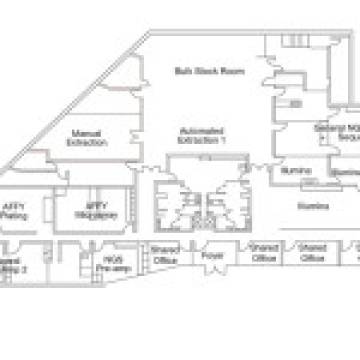
kitchen
private fitness center
recording studio
outdoor patio area
Building Details
Year Built
1960
Listed By:
Eric Ross
(404) 923-1303
Source:
Cbre
Added: May 16
Changed: Sep 30
Last Checked: Oct 14 at 8:40PM
Displayed information is deemed reliable but is not guaranteed and should be independently verified. All listing content including descriptions, pricing, images are the copyrighted material of Eric Ross
Investment Insights
Based on property information with market context.
Built in 1960, this 13,237-square-foot former industrial property has been comprehensively repositioned as creative office space. The interior includes private offices, a kitchen, and upgraded electrical infrastructure designed for office operations, while gated parking supports the building’s on-site functionality.
Additional improvements include a private fitness center, recording studio, and outdoor patio. The roof was replaced in 2020, and substantial work to the electrical panels and other physical components supports the property’s updated office configuration.
Additional improvements include a private fitness center, recording studio, and outdoor patio. The roof was replaced in 2020, and substantial work to the electrical panels and other physical components supports the property’s updated office configuration.
Key Highlights
- 13,237‑square‑foot creative office property in a former industrial building
- Private offices, kitchen, and upgraded electrical panels
- Upgraded power supporting the redeveloped office environment
Financial Insights
Estimated NOI and Cap Rate
NOI / Yr
$177,258
Cap Rate
3.73%
Suggested Prices Based on Cap Rates
Cap Rate 5%
$3,545,160
$3.5M
Cap Rate 7%
$2,532,257
$2.5M
Cap Rate 9%
$1,969,533
$2.0M
Market Conditions
NOI Build-Up for 13,237 SF
Gross rent
$316.0K $23.87/SF
− Vacancy
−$79.6K −$6.02/SF
EGI
$236.3K $17.85/SF
− OpEx
−$59.1K −$4.46/SF
NOI
$177.3K $13.39/SF
Area
ZIP 30318
Vacancy
25.20%
Lease Rate
$23.87 /SF/Yr
Expense Ratio
25.00%
Simulate Cap Rate and NOI
Suggested Prices Based on Cap Rates
Cap Rate 5%
$3,545,160
Cap Rate 7%
$2,532,257
Cap Rate 9%
$1,969,533
Alternative Uses
Best Use
Office B
$2.53M
$2.22M – $2.95M
NOI $177,258 @ 7.0% cap · market cap 3.73%
Second Best
—
—
no second resolved use
Theoretical Best
Office A
$3.70M
$3.24M – $4.32M
NOI $259,017 @ 7.0% cap · market cap 5.45%
Zoning and permitted uses should be independently verified with authorities.
How Realmo checks its estimates
Property Analytics
Unlock full access to Insights
Subscribe to Realmo Intelligence
Open Analytics
Current Use
Location Intelligence
Trade Area within ½ mile
871
Businesses Nearby
Explore this area
Business Placement
Demographics for 30318, GA
60,392
Population
29,993
Households
2
Avg Household Size
31
Median Age
54%
College-Educated
92%
High-School Grad
20.3 sq mi
ZIP Area
2,975
Density / Sq Mi
$79,222
Median Household Income
$53,455
Median Earnings
$1,702
Median Rent
$395,100
Median Home Value
Check the figures for this property
Cap Rate, Value Estimation, Potential NOI and more
View Realmo Analytics
Market
Vacancy Rate% for Office in Atlanta, GA

Questions? Ask Rey
Realmo’s AI knows this listing — price, zoning, demand, history. Ask anything.






Frequently Asked Questions
What type of property is this?
Creative space - Former industrial improvements now provide private offices, upgraded power, and amenity-rich creative workspace.
Where is this creative space located?
The property is located at 1290 Collier Road Northwest Atlanta, GA.
What is the asking price?
The asking price for this property is $4,750,000.
What are key features of this property?
This property features: 13,237‑square‑foot creative office property in a former industrial building; Private offices, kitchen, and upgraded electrical panels; Upgraded power supporting the redeveloped office environment


