Recently Remodeled Office
For Sale
$450,000
7181 S Braden Ave, Tulsa, OK 74136
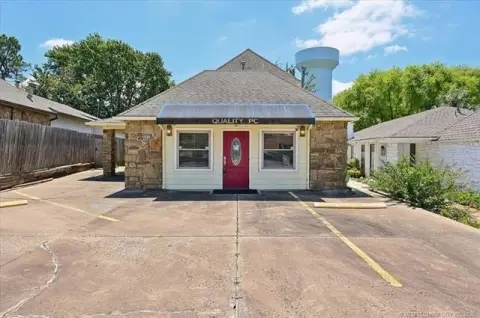
Remodeled office layout includes reception, conference area, four offices, kitchen, and attached garage for storage.
Property Size2,892 SF
Price / SF$155.60
Days on Market880
Property Features for 7181 S Braden Ave
General Information
Standard status
Active
Size
2,892 SF
Taxes and HOA fees
Annual Taxes
$3,295
Listing Agency:
Coldwell Banker Select
(814) 452-2100
Listed By:
Amy Baumann
(918) 812-6510
Source:
Exprealty
Added: May 23, 2024
Changed: Oct 7
Last Checked: Oct 19 at 7:50AM
Displayed information is deemed reliable but is not guaranteed and should be independently verified. All listing content including descriptions, pricing, images are the copyrighted material of Coldwell Banker Select

Ask AI about this property
Review the available facts, identify missing information and prepare questions for the agent.
Investment Insights
Based on property information with market context.
This recently remodeled office suite offers a practical mix of shared and private space, including a reception area and conference area plus four offices. The interior includes three bathrooms, including a private bath in the owner’s office. A full kitchen with appliances is also in place, with additional room off the kitchen for laundry or storage.
The property is positioned in the professional 71st and Yale corridor of Tulsa and is shown by appointment only. An attached garage provides extra storage convenience.
For a tenant or buyer seeking an owner-user or investor-ready setup, the space is designed to support an efficient day-to-day office workflow with dedicated rooms for meetings and private work.
The property is positioned in the professional 71st and Yale corridor of Tulsa and is shown by appointment only. An attached garage provides extra storage convenience.
For a tenant or buyer seeking an owner-user or investor-ready setup, the space is designed to support an efficient day-to-day office workflow with dedicated rooms for meetings and private work.
Key Highlights
- Remodeled office space with 2,892 SF in the 71st and Yale professional corridor of Tulsa
- Reception area plus conference area and 4 offices
- 3 bathrooms including a private bath in the owner’s office
Financial Insights
Estimated NOI and Cap Rate
NOI / Yr
$37,555
Cap Rate
8.35%
Suggested Prices Based on Cap Rates
Cap Rate 5%
$751,100
$751.1K
Cap Rate 7%
$536,500
$536.5K
Cap Rate 9%
$417,278
$417.3K
Market Conditions
NOI Build-Up for 2,892 SF
Gross rent
$58.0K $20.04/SF
− Vacancy
−$7.9K −$2.73/SF
EGI
$50.1K $17.31/SF
− OpEx
−$12.5K −$4.33/SF
NOI
$37.6K $12.99/SF
Area
ZIP 74136
Vacancy
13.60%
Lease Rate
$20.04 /SF/Yr
Expense Ratio
25.00%
Simulate Cap Rate and NOI
Suggested Prices Based on Cap Rates
Cap Rate 5%
$751,100
Cap Rate 7%
$536,500
Cap Rate 9%
$417,278
Alternative Uses
Best Use
Office B
$536.5K
$469.4K – $625.9K
NOI $37,555 @ 7.0% cap · market cap 8.35%
Second Best
—
—
no second resolved use
Theoretical Best
Office A
$627.1K
$548.7K – $731.6K
NOI $43,897 @ 7.0% cap · market cap 9.75%
Zoning and permitted uses should be independently verified with authorities.
How Realmo checks its estimates
Property Analytics
Unlock full access to Insights
Subscribe to Realmo Intelligence
Open Analytics
Current Use
Location Intelligence
Trade Area within ½ mile
1,302
Businesses Nearby
Explore this area
Business Placement
Demographics for 74136, OK
30,416
Population
16,375
Households
1.9
Avg Household Size
38
Median Age
38%
College-Educated
91%
High-School Grad
7.7 sq mi
ZIP Area
3,950
Density / Sq Mi
$51,314
Median Household Income
$35,072
Median Earnings
$926
Median Rent
$292,200
Median Home Value
Check the figures for this property
Cap Rate, Value Estimation, Potential NOI and more
View Realmo Analytics
Market
Vacancy Rate% for Office in Tulsa, OK





Frequently Asked Questions
What type of property is this?
Office building - Remodeled office layout includes reception, conference area, four offices, kitchen, and attached garage for storage.
Where is this office building located?
The property is located at 7181 S Braden Ave Tulsa, OK.
What is the asking price?
The asking price for this property is $450,000.
What are key features of this property?
This property features: Remodeled office space with 2,892 SF in the 71st and Yale professional corridor of Tulsa; Reception area plus conference area and 4 offices; 3 bathrooms including a private bath in the owner’s office


