Historic Mixed-Use Office/Retail
For Sale
$14,000,000
100-116 South Dixie Highway, West Palm Beach, FL 33401
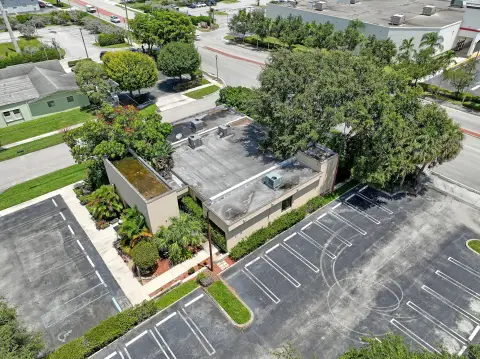
Renovated 1924 building with leased office floors and retail bays, plus a 2024 elevator and CWD-CD zoning.
Property Size19,765 SF
Price / SF$708.32
Days on Market607
Property Features for 100-116 South Dixie Highway
General Information
Standard status
Active
Size
19,765 SF
Zoning
CWD-CD - Clematis Waterfront District
Occupancy
90%
Additional Details
Traffic Count
15,000 vehicles/day
Building Details
Year Built
1924
Year Renovated
2025
Tenancy
Multi
Listing Agency:
eXp Commercial
Listed By:
Chad Massaker, MICP · License #BK3467373
(561) 810-3537
Source:
Expcommercial
Added: Feb 12, 2025
Changed: Oct 10
Last Checked: Oct 11 at 2:57AM
Displayed information is deemed reliable but is not guaranteed and should be independently verified. All listing content including descriptions, pricing, images are the copyrighted material of eXp Commercial
Investment Insights
Based on property information with market context.
Located at 100-116 South Dixie Highway in West Palm Beach, this historic building was originally constructed in 1924 and renovated in 2025. The property offers a mixed office-and-retail configuration with an approximately 90% occupancy rate, including leased office floors on Levels 2 and 3 (with only two smaller offices remaining). A new elevator was installed in 2024. Leasing activity includes a new 5-year lease with Nicos and a new 10-year lease with ManCave.
Zoned CWD-CD (Clematis Waterfront District), the asset benefits from area demand and exposure tied to downtown Clematis activity. The remarks cite nearly 4,000 residences within walking distance and approximately 40,000 people working within 1 mile. It is also described as being on a major corridor, with an estimated 15,000 cars per day traveling through Clematis St and S. Dixie, and increased seasonal Saturday traffic associated with the Green Market.
The current income run-rate is described as approximately $45,000 per month, moving to approximately $50,000 per month once the last retail bay and two smaller offices are leased.
Zoned CWD-CD (Clematis Waterfront District), the asset benefits from area demand and exposure tied to downtown Clematis activity. The remarks cite nearly 4,000 residences within walking distance and approximately 40,000 people working within 1 mile. It is also described as being on a major corridor, with an estimated 15,000 cars per day traveling through Clematis St and S. Dixie, and increased seasonal Saturday traffic associated with the Green Market.
The current income run-rate is described as approximately $45,000 per month, moving to approximately $50,000 per month once the last retail bay and two smaller offices are leased.
Key Highlights
- Historic 19,765 SF building originally built in 1924, renovated in 2025
- CWD‑CD (Clematis Waterfront District) zoning
- Office floors 2 & 3: all leased except 2 tiny offices; 90% occupancy rate
Financial Insights
Estimated NOI and Cap Rate
NOI / Yr
$688,984
Cap Rate
4.92%
Suggested Prices Based on Cap Rates
Cap Rate 5%
$13,779,680
$13.8M
Cap Rate 7%
$9,842,629
$9.8M
Cap Rate 9%
$7,655,378
$7.7M
Market Conditions
NOI Build-Up for 19,765 SF
Gross rent
$1.09M $55.20/SF
− Vacancy
−$172.4K −$8.72/SF
EGI
$918.6K $46.48/SF
− OpEx
−$229.7K −$11.62/SF
NOI
$689.0K $34.86/SF
Area
West Palm Beach, FL
Vacancy
15.80%
Lease Rate
$55.20 /SF/Yr
Expense Ratio
25.00%
Simulate Cap Rate and NOI
Suggested Prices Based on Cap Rates
Cap Rate 5%
$13,779,680
Cap Rate 7%
$9,842,629
Cap Rate 9%
$7,655,378
Alternative Uses
Best Use
Office B
$9.84M
$8.61M – $11.48M
NOI $688,984 @ 7.0% cap · market cap 4.92%
Second Best
—
—
no second resolved use
Theoretical Best
Office A
$13.92M
$12.18M – $16.24M
NOI $974,373 @ 7.0% cap · market cap 6.96%
Zoning and permitted uses should be independently verified with authorities.
Property Analytics
Unlock full access to Insights
Subscribe to Realmo Intelligence
Open Analytics
Current Use
Lease Details
15,000 VPD
Traffic count
90%
Occupancy
Multi-tenant
Tenancy
Location Intelligence
Trade Area within ½ mile
5,569
Businesses Nearby
Explore this area
Business Placement
Demographics for 33401, FL
31,302
Population
19,051
Households
1.6
Avg Household Size
40
Median Age
42%
College-Educated
89%
High-School Grad
5.1 sq mi
ZIP Area
6,138
Density / Sq Mi
$60,942
Median Household Income
$39,932
Median Earnings
$1,774
Median Rent
$430,900
Median Home Value
Check the figures for this property
Cap Rate, Value Estimation, Potential NOI and more
View Realmo Analytics
Market
Vacancy Rate% for Office in South region

Questions? Ask Rey
Realmo’s AI knows this listing — price, zoning, demand, history. Ask anything.





Frequently Asked Questions
What type of property is this?
Office building - Renovated 1924 building with leased office floors and retail bays, plus a 2024 elevator and CWD-CD zoning.
Where is this office building located?
The property is located at 100-116 South Dixie Highway West Palm Beach, FL.
What is the asking price?
The asking price for this property is $14,000,000.
What are key features of this property?
This property features: Historic 19,765 SF building originally built in 1924, renovated in 2025; CWD‑CD (Clematis Waterfront District) zoning; Office floors 2 & 3: all leased except 2 tiny offices; 90% occupancy rate


