Frontage Office Building with
For Sale
$795,000
1518 & 1520 Bridge Street, Charlevoix, MI 49720
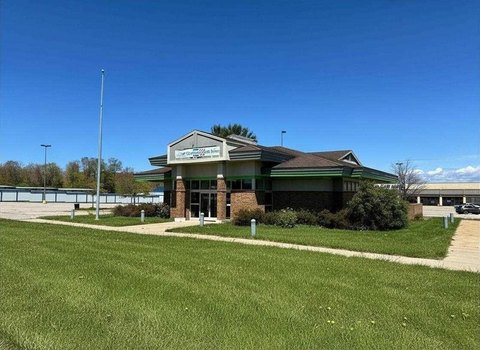
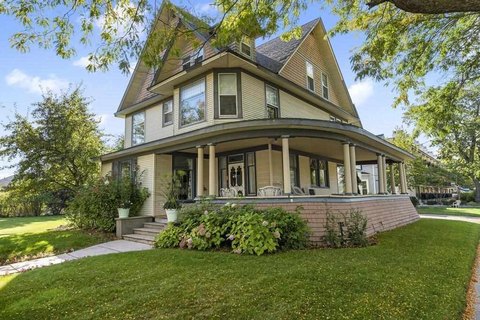
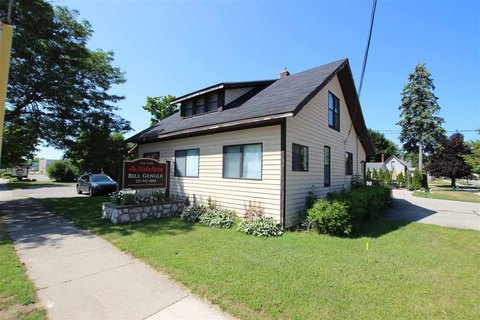
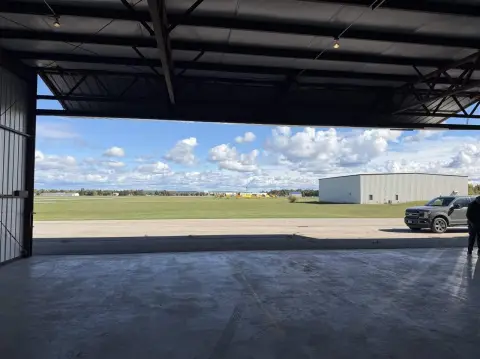
Leased office building with a residential home on multi-road frontage near the airport entrance.
Property Size2,900 SF
Lot Size1.50 Acres
Price / SF$274.14
Days on Market1201
Property Features for 1518 & 1520 Bridge Street
General Information
Standard status
Active
Size
2,900 SF
Lot size
1.50 Acres
Property subtype
Commercial
Site & Location
Highway Access
Yes
Road Access
Yes
Additional Details
Business Included
Yes
Listing Agency:
Berkshire Hathaway HomeServices Real Estate
Listed By:
Richard Lobenherz · License #6506029940
(231) 675-6285
Source:
Harborsir
Added: Jul 7, 2023
Changed: Oct 16
Last Checked: Oct 16 at 9:23AM
Displayed information is deemed reliable but is not guaranteed and should be independently verified. All listing content including descriptions, pricing, images are the copyrighted material of Berkshire Hathaway HomeServices Real Estate

Ask AI about this property
Review the available facts, identify missing information and prepare questions for the agent.
Investment Insights
Based on property information with market context.
This offering includes an office building currently leased to a security company, along with a residential home on-site. The property is made up of three combined parcels totaling approximately 1.5 acres, and the layout lends itself to a potential drive-through configuration.
The site features frontage on three roads and sits directly across from the entrance to the airport. Public remarks also note high traffic conditions on US-31 and Marion Center, supporting strong visibility for an office or service-oriented use.
For buyers seeking a mixed-use setup, the current lease provides near-term occupancy while maintaining flexibility with the additional residential component. The combined acreage and multi-road frontage can also support business operations that benefit from convenient vehicle flow, including a drive-through approach consistent with the site’s stated suitability. Interested parties should verify the details of the lease and any intended operational changes during due diligence.
The site features frontage on three roads and sits directly across from the entrance to the airport. Public remarks also note high traffic conditions on US-31 and Marion Center, supporting strong visibility for an office or service-oriented use.
For buyers seeking a mixed-use setup, the current lease provides near-term occupancy while maintaining flexibility with the additional residential component. The combined acreage and multi-road frontage can also support business operations that benefit from convenient vehicle flow, including a drive-through approach consistent with the site’s stated suitability. Interested parties should verify the details of the lease and any intended operational changes during due diligence.
Key Highlights
- Prime commercial frontage directly across from the entrance to the airport
- Frontage on 3 roads, with 3 parcels combined totaling about 1.5 acres
- Currently leased to a security company
Financial Insights
Estimated NOI and Cap Rate
NOI / Yr
$28,501
Cap Rate
3.59%
Suggested Prices Based on Cap Rates
Cap Rate 5%
$570,020
$570.0K
Cap Rate 7%
$407,157
$407.2K
Cap Rate 9%
$316,678
$316.7K
Market Conditions
NOI Build-Up for 2,900 SF
Gross rent
$48.7K $16.80/SF
− Vacancy
−$10.7K −$3.70/SF
EGI
$38.0K $13.10/SF
− OpEx
−$9.5K −$3.28/SF
NOI
$28.5K $9.83/SF
Area
Charlevoix County, MI
Vacancy
22.00%
Lease Rate
$16.80 /SF/Yr
Expense Ratio
25.00%
Simulate Cap Rate and NOI
Suggested Prices Based on Cap Rates
Cap Rate 5%
$570,020
Cap Rate 7%
$407,157
Cap Rate 9%
$316,678
Alternative Uses
Best Use
Office B
$407.2K
$356.3K – $475.0K
NOI $28,501 @ 7.0% cap · market cap 3.59%
Second Best
—
—
no second resolved use
Theoretical Best
Office A
$587.0K
$513.7K – $684.9K
NOI $41,092 @ 7.0% cap · market cap 5.17%
Zoning and permitted uses should be independently verified with authorities.
How Realmo checks its estimates
Property Analytics
Unlock full access to Insights
Subscribe to Realmo Intelligence
Open Analytics
Current Use
Lease Details
Turnkey business
Opportunity
Yes
Highway access
Yes
Paved road access
Location Intelligence
Trade Area within ½ mile
233
Businesses Nearby
Explore this area
Business Placement
Demographics for 49720, MI
9,127
Population
6,236
Households
1.5
Avg Household Size
52
Median Age
38%
College-Educated
97%
High-School Grad
95.5 sq mi
ZIP Area
96
Density / Sq Mi
$76,127
Median Household Income
$41,563
Median Earnings
$985
Median Rent
$265,100
Median Home Value
Check the figures for this property
Cap Rate, Value Estimation, Potential NOI and more
View Realmo Analytics
Market
Vacancy Rate% for Office in Midwest region







Frequently Asked Questions
What type of property is this?
Office building - Leased office building with a residential home on multi-road frontage near the airport entrance.
Where is this office building located?
The property is located at 1518 & 1520 Bridge Street Charlevoix, MI.
What is the asking price?
The asking price for this property is $795,000.
What are key features of this property?
This property features: Prime commercial frontage directly across from the entrance to the airport; Frontage on 3 roads, with 3 parcels combined totaling about 1.5 acres; Currently leased to a security company