Remodeled Home in 55+
For Sale
$150,000
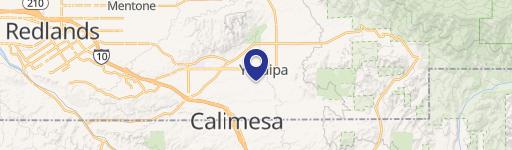
12582 2nd 11, Yucaipa, CA 92399
Updated 2-bedroom home in Yucaipa's Hidden Village Mobile Home Park.
Property Size1,440 SF
Price / SF$104.17
Days on Market330
Property Features for 12582 2nd 11
General Information
Standard status
Active
Size
1,440 SF
Property subtype
Manufactured In Park
Listing Agency:
CENTURY 21 SYNERGIA REALTY
(909) 248-5296
Listed By:
Maricela Ayala Rodriguez · License #02167072
(951) 334-8567
Source:
Tfregroup
Added: Nov 28, 2025
Changed: Oct 23
Last Checked: Oct 23 at 6:57AM
Displayed information is deemed reliable but is not guaranteed and should be independently verified. All listing content including descriptions, pricing, images are the copyrighted material of CENTURY 21 SYNERGIA REALTY

Ask AI about this property
Review the available facts, identify missing information and prepare questions for the agent.
Investment Insights
Based on property information with market context.
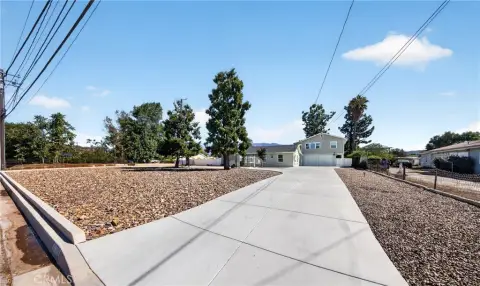
This fully remodeled 2-bedroom, 1-bath home is located in the Hidden Village Mobile Home Park, a 55+ community in Yucaipa. The home features fresh paint, new carpet and flooring, stylish cabinet doors with modern hardware, updated countertops and sink, and a refreshed bathroom with a new vanity. Energy-efficient double-pane windows and a new AC/mini-split system with remote provide year-round comfort. A spacious covered patio has been rebuilt and re-carpeted. A carport accommodates several vehicles. Situated in a quiet back area of the park with no through traffic, the home offers peace and privacy while remaining close to community amenities such as a recreation center and pool. This move-in ready home is located at 12582 2nd St 77, Yucaipa, CA 92399.
Key Highlights
- Fully remodeled 2‑bedroom home in Hidden Village Mobile Home Park, a 55+ community.
- Enjoy the comfort of a new AC/mini‑split system with remote and energy‑efficient double‑pane windows.
- Spacious, rebuilt and re‑carpeted covered patio.
Financial Insights
Estimated NOI and Cap Rate
NOI / Yr
$12,748
Cap Rate
8.50%
Suggested Prices Based on Cap Rates
Cap Rate 5%
$254,960
$255.0K
Cap Rate 7%
$182,114
$182.1K
Cap Rate 9%
$141,644
$141.6K
Market Conditions
NOI Build-Up for 1,440 SF
Gross rent
$24.7K $17.16/SF
− Vacancy
−$1.5K −$1.06/SF
EGI
$23.2K $16.10/SF
− OpEx
−$10.4K −$7.24/SF
NOI
$12.7K $8.85/SF
Area
San Bernardino County, CA
Vacancy
6.20%
Lease Rate
$17.16 /SF/Yr
Expense Ratio
45.00%
Simulate Cap Rate and NOI
Suggested Prices Based on Cap Rates
Cap Rate 5%
$254,960
Cap Rate 7%
$182,114
Cap Rate 9%
$141,644
Alternative Uses
Best Use
Apartment 5plus
$182.1K
$159.4K – $212.5K
NOI $12,748 @ 7.0% cap · market cap 8.50%
Second Best
—
—
no second resolved use
Theoretical Best
Office A
$303.7K
$265.8K – $354.4K
NOI $21,262 @ 7.0% cap · market cap 14.17%
Zoning and permitted uses should be independently verified with authorities.
How Realmo checks its estimates
Property Analytics
Who owns this building?
See the owner, sales and loan history
Open Analytics
Location Intelligence
Trade Area within ½ mile
279
Businesses Nearby
Explore this area
Business Placement
Demographics for 92399, CA
55,794
Population
19,382
Households
2.9
Avg Household Size
40
Median Age
26%
College-Educated
89%
High-School Grad
53.6 sq mi
ZIP Area
1,041
Density / Sq Mi
$94,718
Median Household Income
$46,011
Median Earnings
$1,658
Median Rent
$472,400
Median Home Value
Check the figures for this property
Cap Rate, Value Estimation, Potential NOI and more
View Realmo Analytics
Market
Vacancy Rate% for Multifamily in West region



Frequently Asked Questions
What type of property is this?
Mobile home & RV park - Updated 2-bedroom home in Yucaipa's Hidden Village Mobile Home Park.
Where is this mobile home & rv park located?
The property is located at 12582 2nd 11 Yucaipa, CA.
What is the asking price?
The asking price for this property is $150,000.
What are key features of this property?
This property features: Fully remodeled 2‑bedroom home in Hidden Village Mobile Home Park, a 55+ community.; Enjoy the comfort of a new AC/mini‑split system with remote and energy‑efficient double‑pane windows.; Spacious, rebuilt and re‑carpeted covered patio.


