Auto Body Shop
For Sale
$850,000
134 Sterry Street Pawtucket, Pawtucket, RI 02860
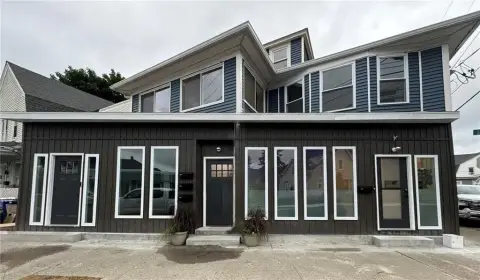
Versatile auto body shop on a 15,000 SF lot with ample parking and an additional area adaptable for living space.
Property Size5,700 SF
Price / SF$149.12
Days on Market124
Property Features for 134 Sterry Street Pawtucket
General Information
Standard status
Active
Size
5,700 SF
Total Parking Spaces
30
Property subtype
CommercialSale
Zoning
RM
Additional Details
Business Included
Yes
Taxes and HOA fees
Annual Taxes
$2,870
Building Details
Building Size
5,700 SF
Year Built
1930
Buildings
1
Listed By:
Anna Rae
(508) 501-1443
Source:
Milestonerealtyinc
Added: Jun 4
Changed: Aug 12
Last Checked: Jun 5 at 2:19AM
Displayed information is deemed reliable but is not guaranteed and should be independently verified. All listing content including descriptions, pricing, images are the copyrighted material of Anna Rae
Investment Insights
Based on property information with market context.
This for-sale property consists of a versatile commercial building currently operating as an auto body shop. It sits on a spacious 15,000 SF lot and includes approximately 5,700 SF of building area, supported by ample parking for customers and employees. In addition to the primary business space, the property features a bonus extra area that can be transformed into valuable living space, providing flexibility for an operator who wants space beyond the shop.
Located in Pawtucket at 134 Sterry Street, the site is built around practical customer access and on-site parking, a useful setup for automotive-related operations. The property’s lot size and parking availability are key site features for day-to-day workflow, customer visits, and vehicle handling.
For the right buyer, the existing auto body shop configuration offers a straightforward path to continue automotive repairs and refinishing, while the overall building and lot layout support adaptive reuse for other business concepts. The additional area intended for potential living space may also appeal to owner-operators who want to combine work and personal use within the same property. Please contact us for viewing details and to discuss fit for your intended use.
Located in Pawtucket at 134 Sterry Street, the site is built around practical customer access and on-site parking, a useful setup for automotive-related operations. The property’s lot size and parking availability are key site features for day-to-day workflow, customer visits, and vehicle handling.
For the right buyer, the existing auto body shop configuration offers a straightforward path to continue automotive repairs and refinishing, while the overall building and lot layout support adaptive reuse for other business concepts. The additional area intended for potential living space may also appeal to owner-operators who want to combine work and personal use within the same property. Please contact us for viewing details and to discuss fit for your intended use.
Key Highlights
- Commercial building built in 1930, currently operating as an auto body shop
- Set on a 15,000 SF lot with ample parking space
- Additional area can be transformed into potential living space
Financial Insights
Estimated NOI and Cap Rate
NOI / Yr
$64,351
Cap Rate
7.57%
Suggested Prices Based on Cap Rates
Cap Rate 5%
$1,287,020
$1.3M
Cap Rate 7%
$919,300
$919.3K
Cap Rate 9%
$715,011
$715.0K
Market Conditions
NOI Build-Up for 5,700 SF
Gross rent
$102.6K $18.00/SF
− Vacancy
−$10.7K −$1.87/SF
EGI
$91.9K $16.13/SF
− OpEx
−$27.6K −$4.84/SF
NOI
$64.4K $11.29/SF
Area
Providence County, RI
Vacancy
10.40%
Lease Rate
$18.00 /SF/Yr
Expense Ratio
30.00%
Simulate Cap Rate and NOI
Suggested Prices Based on Cap Rates
Cap Rate 5%
$1,287,020
Cap Rate 7%
$919,300
Cap Rate 9%
$715,011
Alternative Uses
Best Use
Retail
$919.3K
$804.4K – $1.07M
NOI $64,351 @ 7.0% cap · market cap 7.57%
Second Best
Industrial
$424.9K
$371.8K – $495.8K
NOI $29,745 @ 7.0% cap · market cap 3.50%
Theoretical Best
Multifamily LT 5
$1.36M
$1.19M – $1.58M
NOI $94,908 @ 7.0% cap · market cap 11.17%
Zoning and permitted uses should be independently verified with authorities.
Property Analytics
Unlock full access to Insights
Subscribe to Realmo Intelligence
Open Analytics
Current Use
Lease Details
Turnkey business
Opportunity
Location Intelligence
Trade Area within ½ mile
1,244
Businesses Nearby
60k
Monthly Visits Nearby
Well-served
Demand for This Use
Explore this area
Business Placement
Foot Traffic Nearby
Dining 58%
Shops & Services 42%
McDonald's
Dining
25,210 visits/mo
0.4 miles
Dunkin' Donuts
Dining
9,491 visits/mo
0.4 miles
Speedway
Shops & Services
7,549 visits/mo
0.4 miles
Mobil
Shops & Services
6,789 visits/mo
0.3 miles
U-Haul Moving & Storage Of Pawtucket
Shops & Services
5,706 visits/mo
0.2 miles
Demographics for 02860, RI
47,894
Population
21,467
Households
2.2
Avg Household Size
37
Median Age
25%
College-Educated
80%
High-School Grad
5.3 sq mi
ZIP Area
9,037
Density / Sq Mi
$59,954
Median Household Income
$42,038
Median Earnings
$1,112
Median Rent
$287,400
Median Home Value
Check the figures for this property
Cap Rate, Value Estimation, Potential NOI and more
View Realmo Analytics
Market
Vacancy Rate% for Retail in Northeast region

Questions? Ask Rey
Realmo’s AI knows this listing — price, zoning, demand, history. Ask anything.



Similar Off Market Nearby
- Dean collision annex — 550 Pawtucket Ave, Pawtucket, RI 02860
- Coastal Collision — 540 Pawtucket Ave, Pawtucket, RI 02860
- Coastal Towing — 540 Pawtucket Ave, Pawtucket, RI 02860
- VN TireShop LLC — 1028 Main St, Pawtucket, RI 02860
- Pinto's Auto & Truck Repairs — 62 Woodlawn Ave, Pawtucket, RI 02860
Frequently Asked Questions
What type of property is this?
Auto shop - Versatile auto body shop on a 15,000 SF lot with ample parking and an additional area adaptable for living space.
Where is this auto shop located?
The property is located at 134 Sterry Street Pawtucket Pawtucket, RI.
What is the asking price?
The asking price for this property is $850,000.
What are key features of this property?
This property features: Commercial building built in 1930, currently operating as an auto body shop; Set on a 15,000 SF lot with ample parking space; Additional area can be transformed into potential living space