Historic Restaurant with
For Sale
$2,895,000
124 S 2nd Street, Geneva, IL 60134
Commercial Sale, Geneva, IL
Property Size8,000 SF
Lot Size0.44 Acres
Price / SF$361.88
Days on Market48
Property Features for 124 S 2nd Street
General Information
Property type
Commercial Sale
Property subtype
Retail
Zoning
COMMR
Directions
Route 38 downtown Geneva to Second Street, South on Second Street to address
Subdivision
Geneva
Standard status
Active
APN
1203453012
Lot size
0.44 Acres
Taxes and HOA fees
Tax Year
2025
Tax Annual Amount
18728
Utilities
Cooling system
Central Air
Amenities
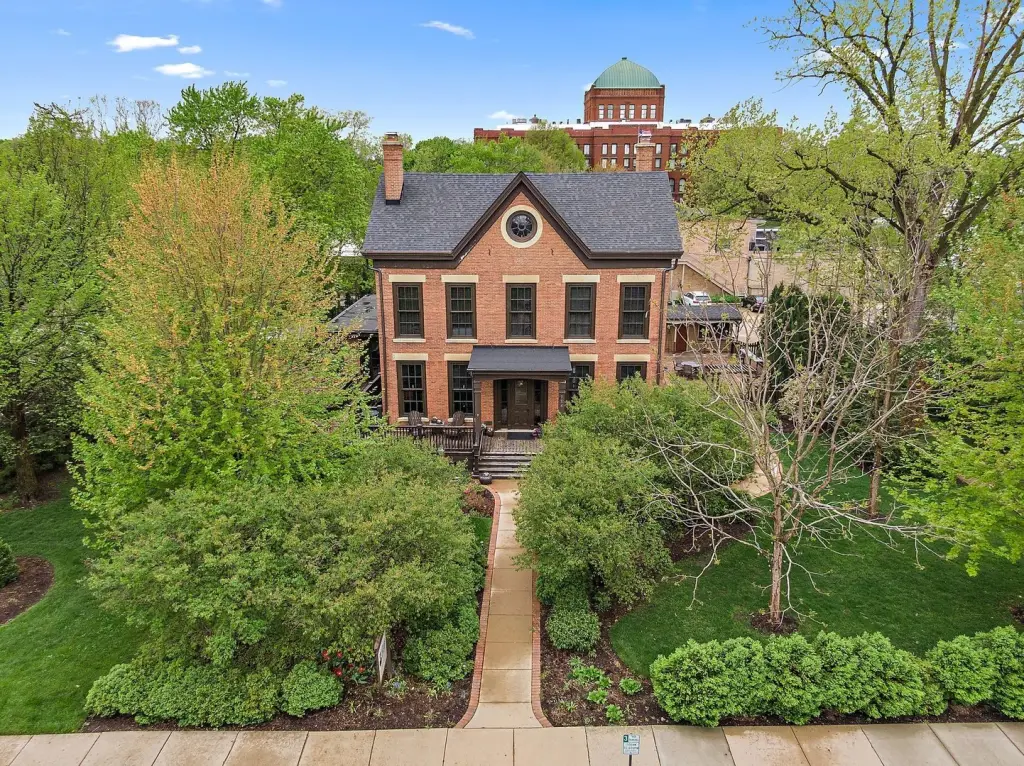
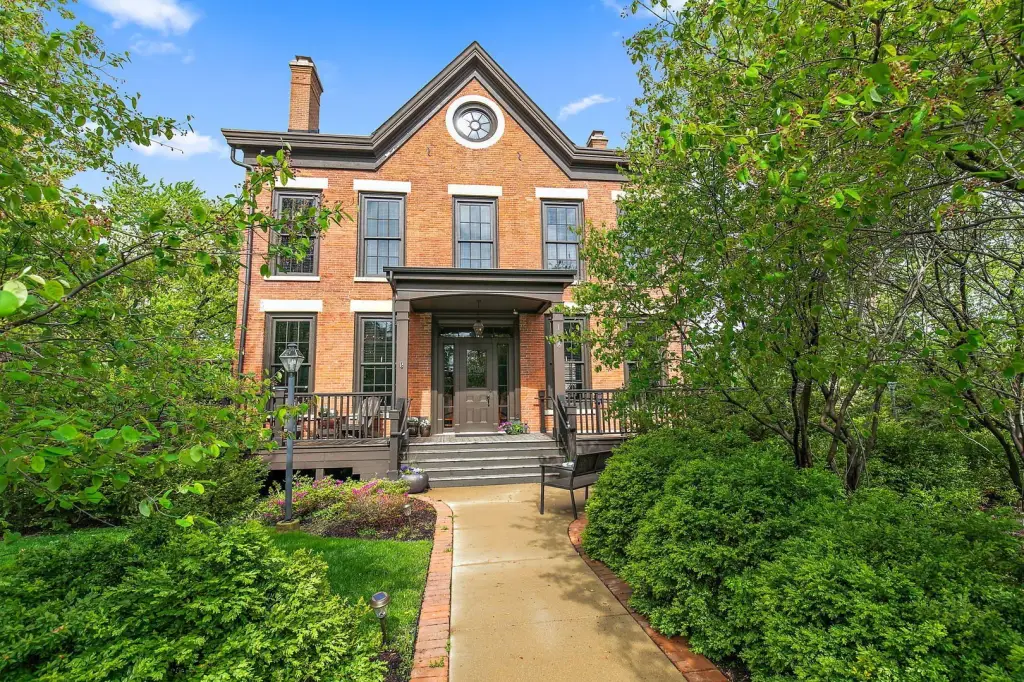
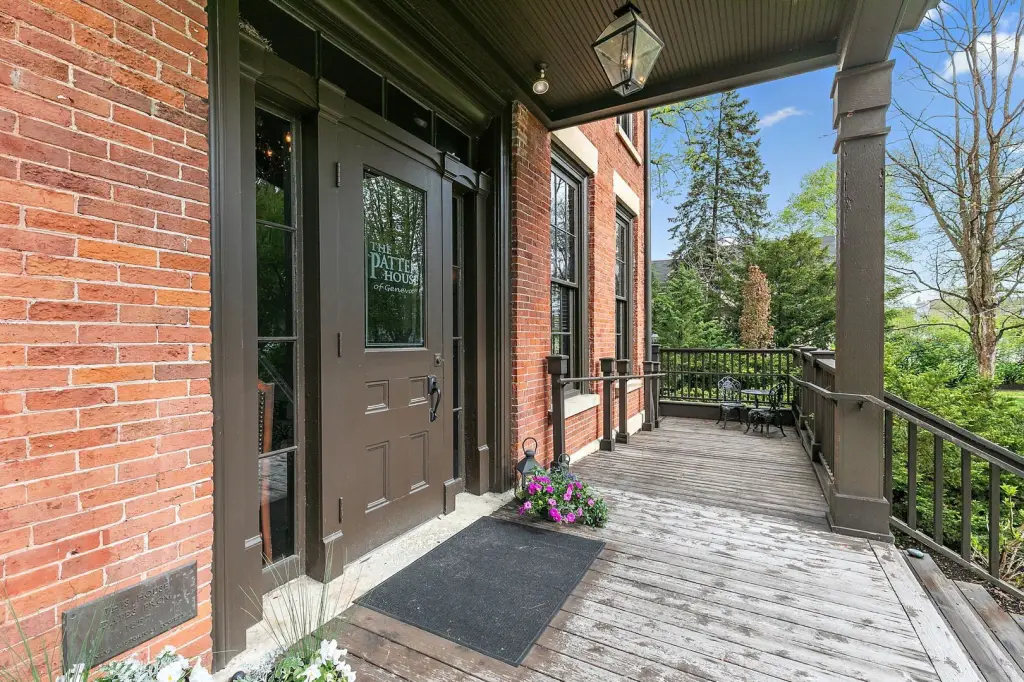
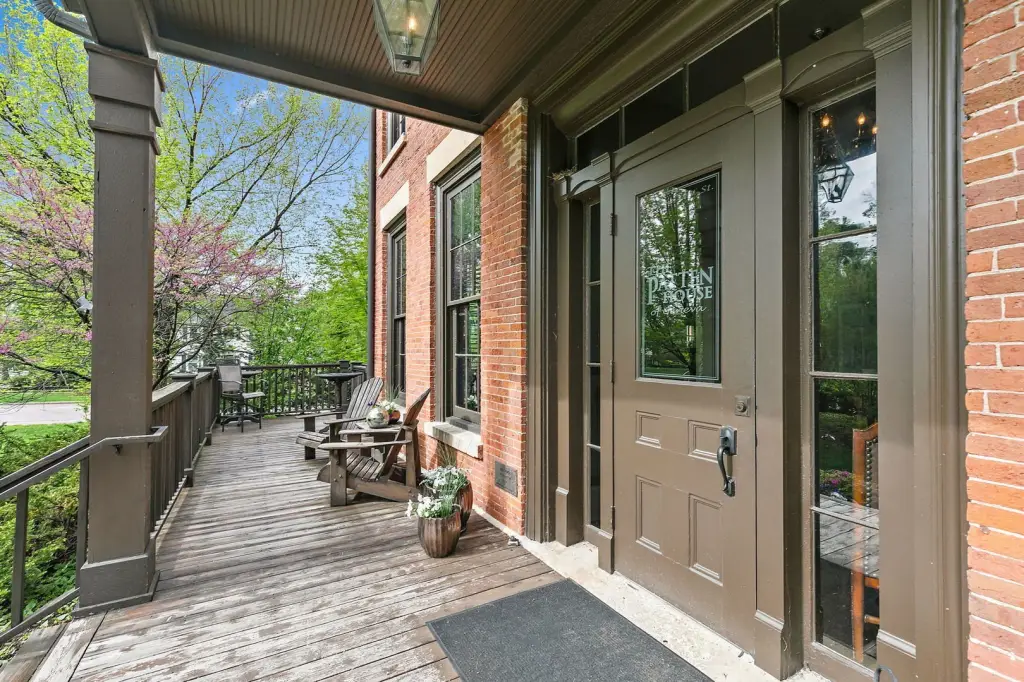
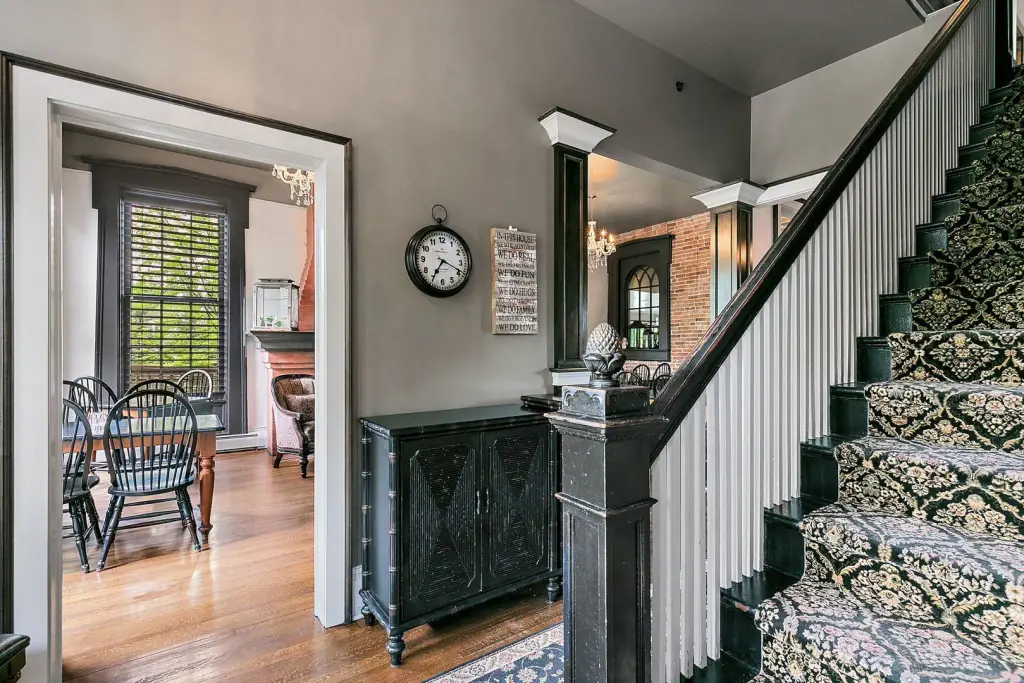
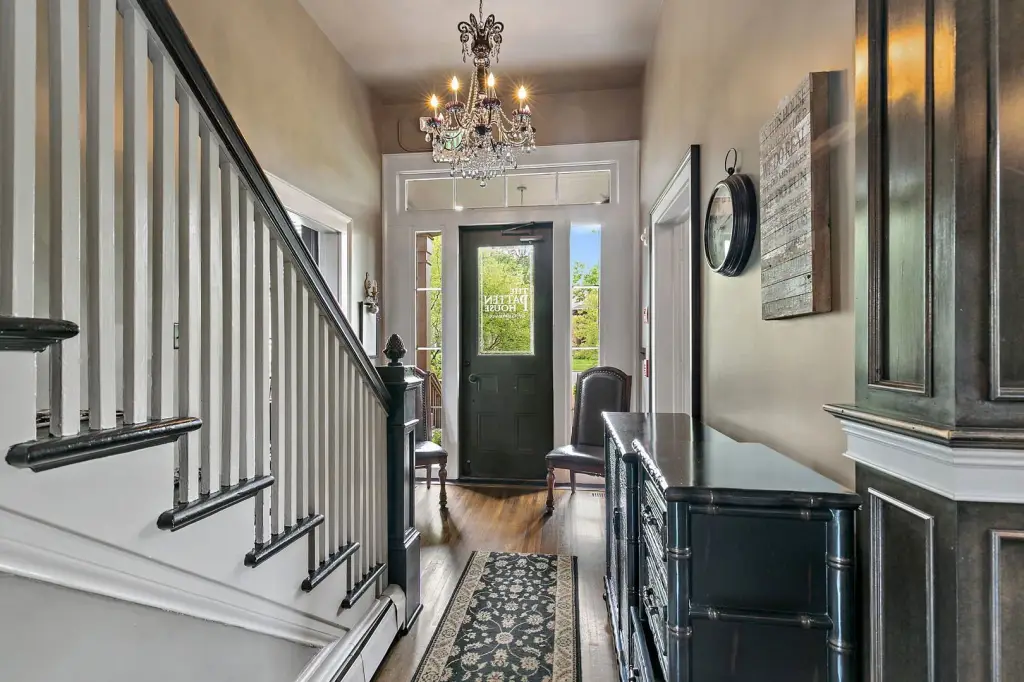
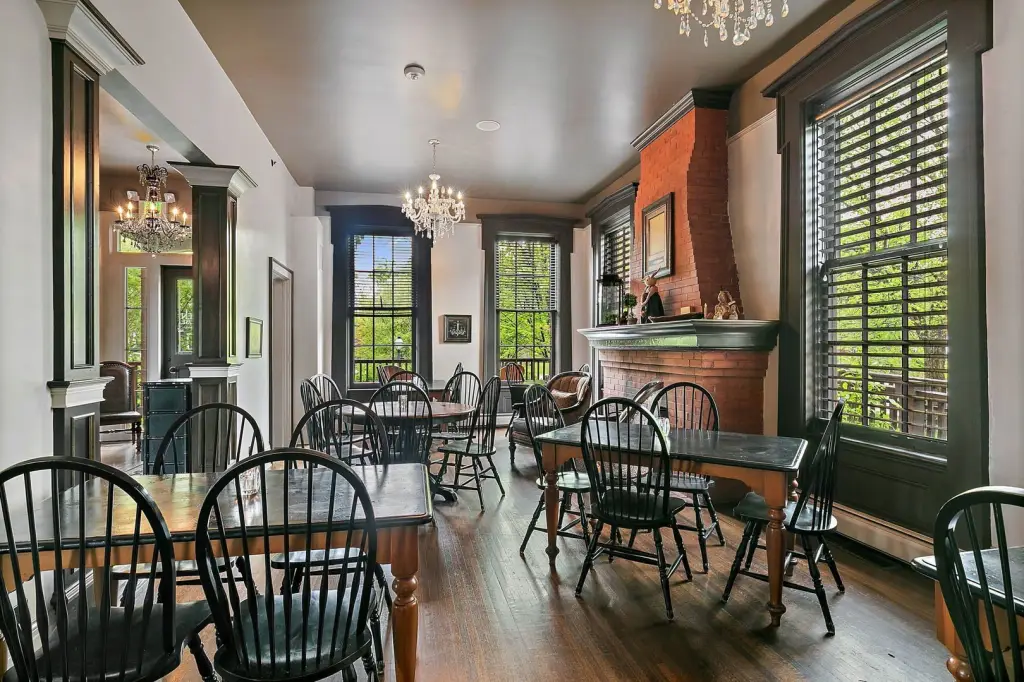
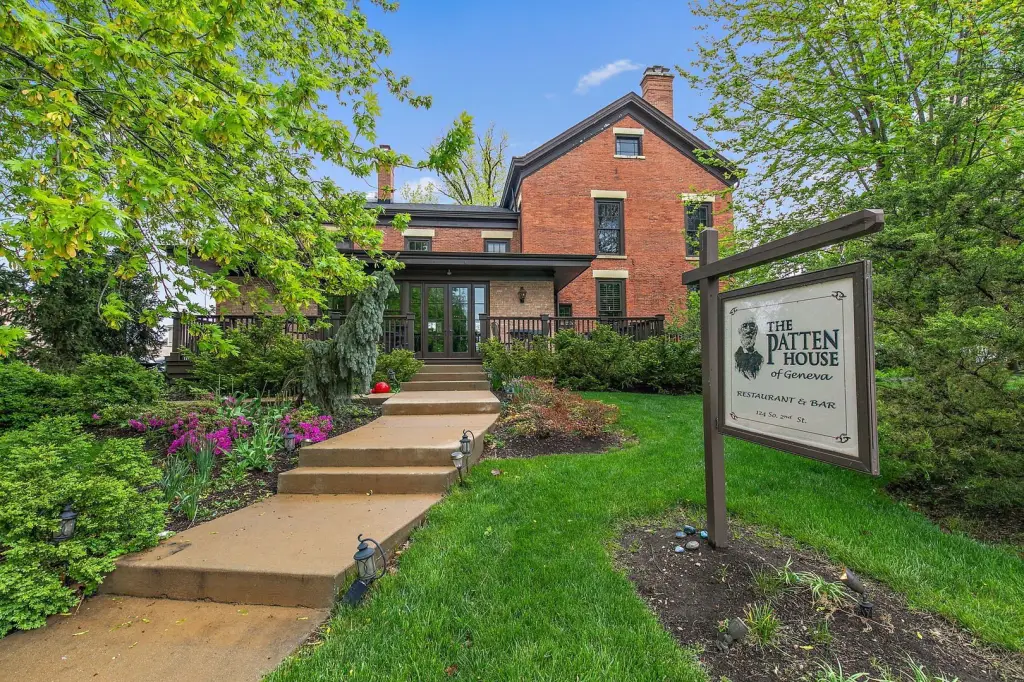
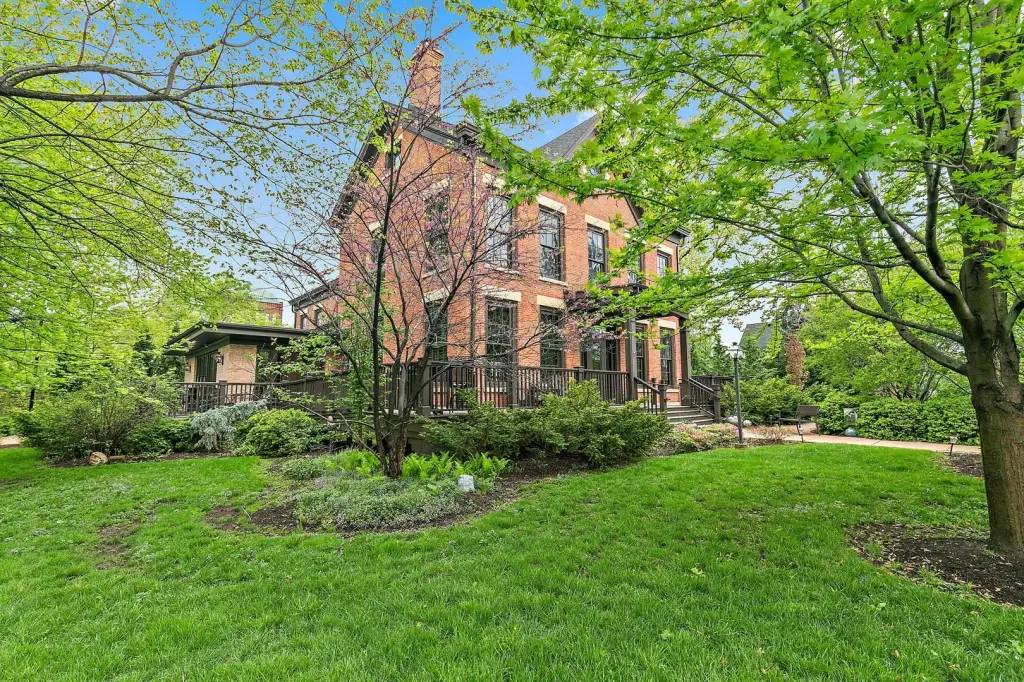
wrap-around porch
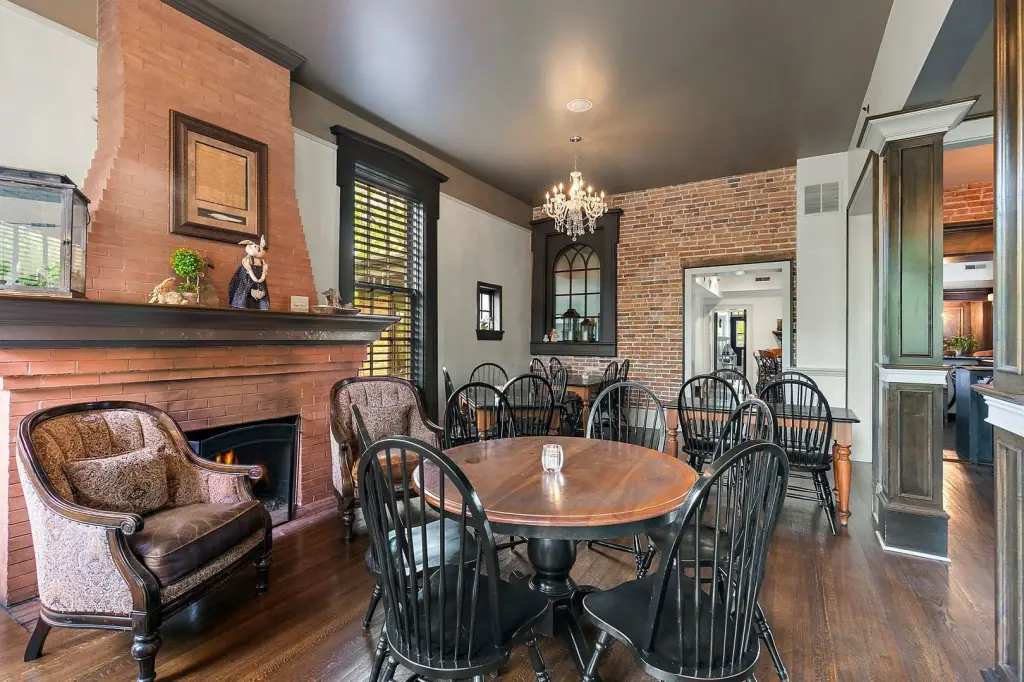
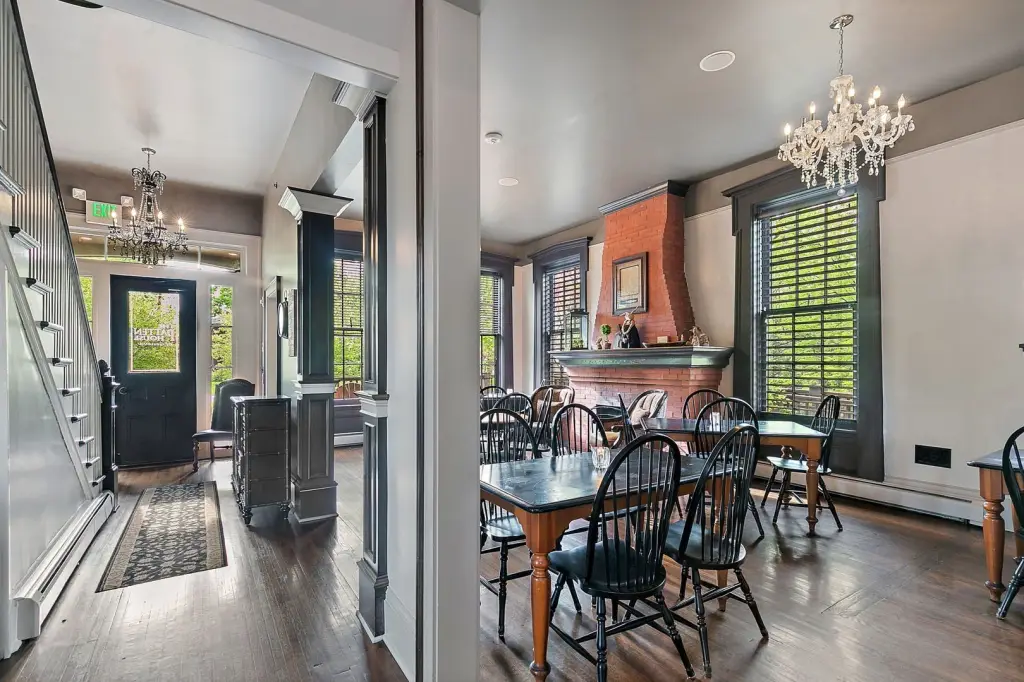
hardwood floors
impressive millwork
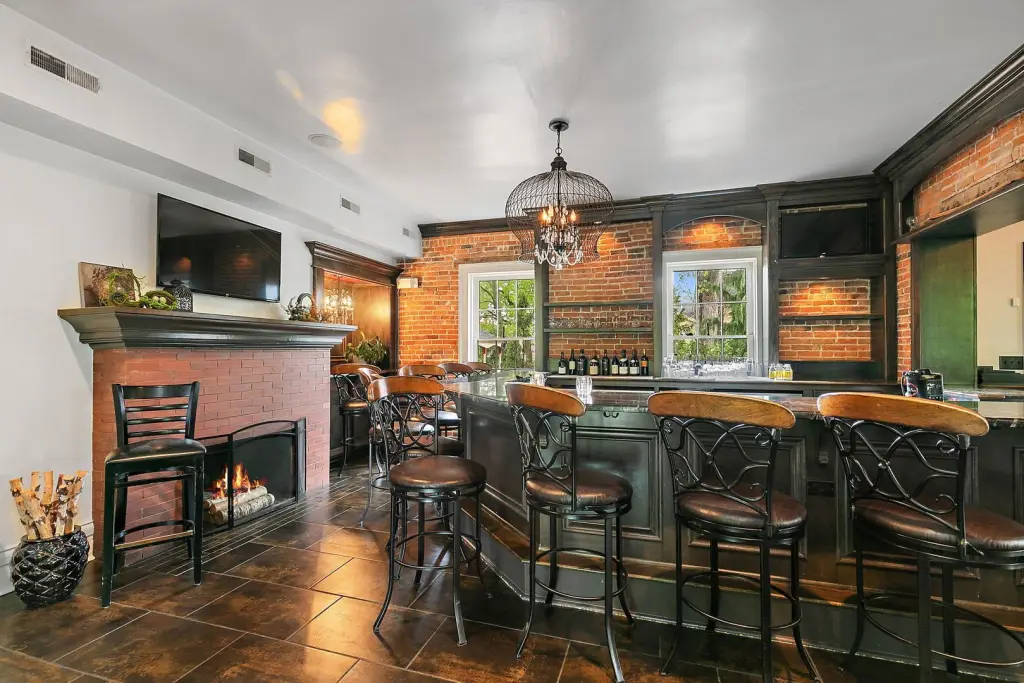
two fireplaces
12' ceilings
8' windows
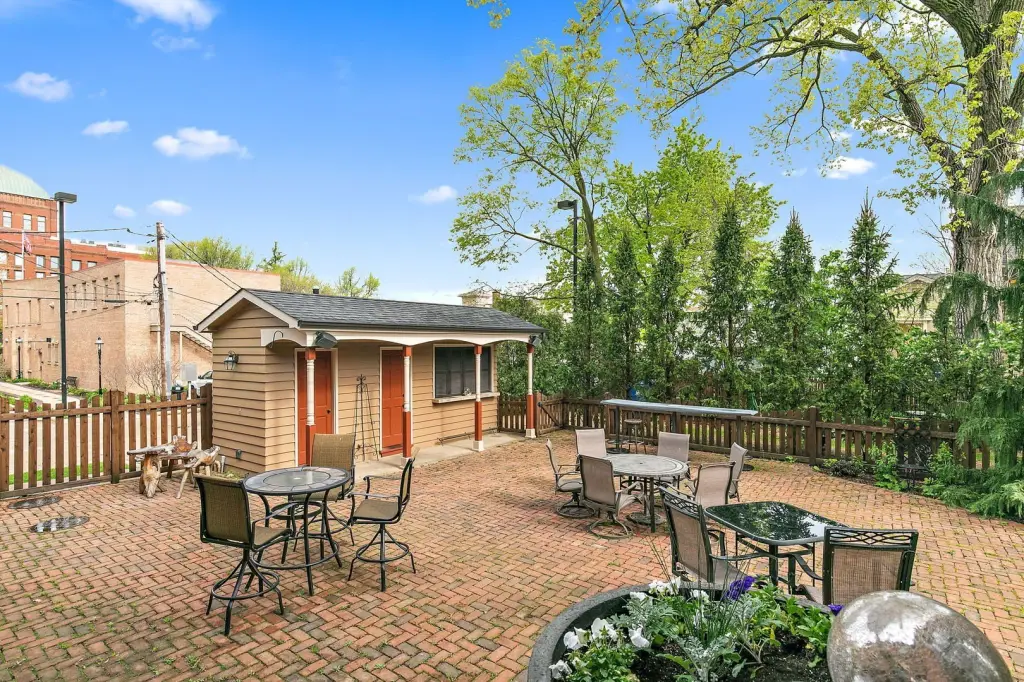
small building on patio with restroom and bar
impeccably landscaped grounds
Building Details
Year built
1860
Floors in Building
3
Flooring type
Wood, Carpet
Building materials
Brick
Listing Agency:
Coldwell Banker Real Estate Group
(630) 232-6900
Listed By:
Charles Kirkwood · License #475142955
(815) 553-2411
Added: Aug 31
Changed: Oct 16
Last Checked: Oct 17 at 7:06AM
MLS# 12747807
Copyright © 2026 Midwest Real Estate Data, LLC. All rights reserved. All information provided by the listing agent/broker is deemed reliable but is not guaranteed and should be independently verified.

Ask AI about this property
Review the available facts, identify missing information and prepare questions for the agent.
Investment Insights
Based on property information with market context.
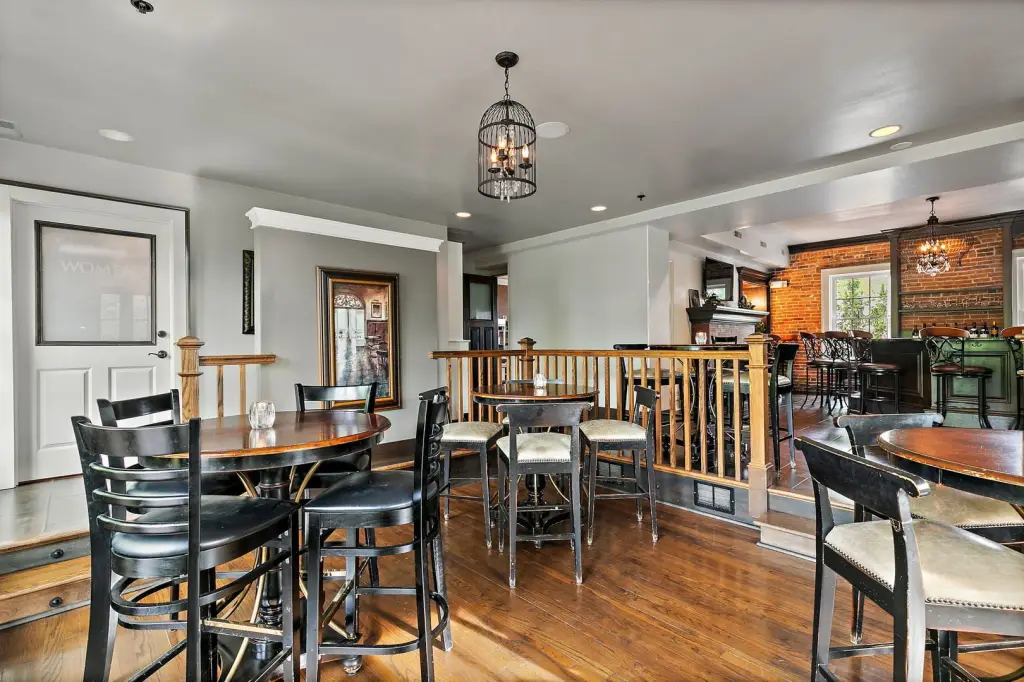
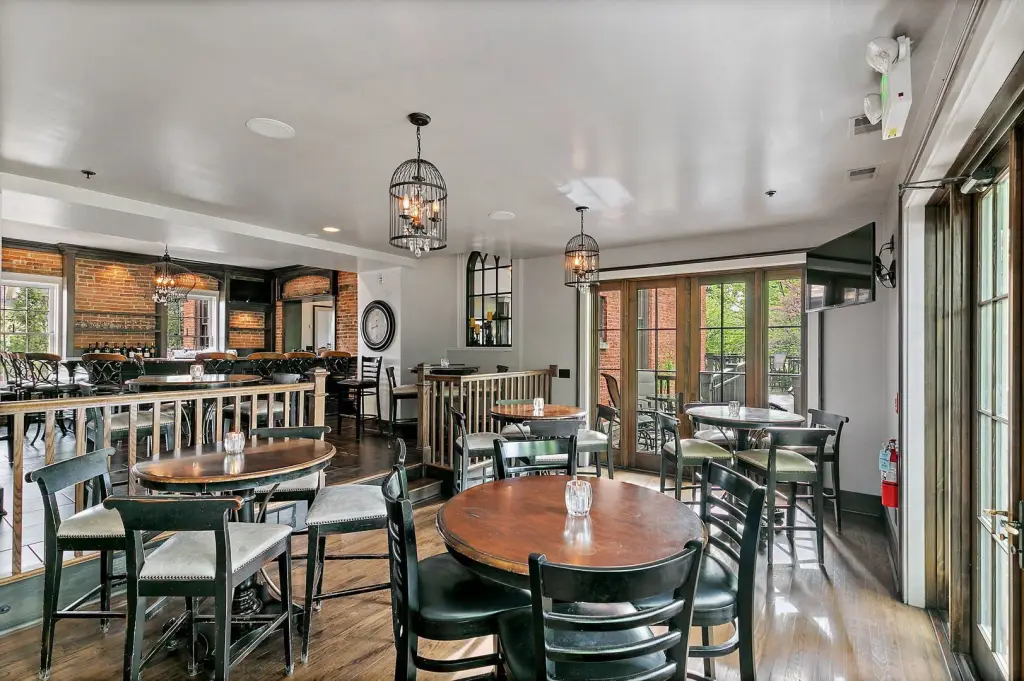
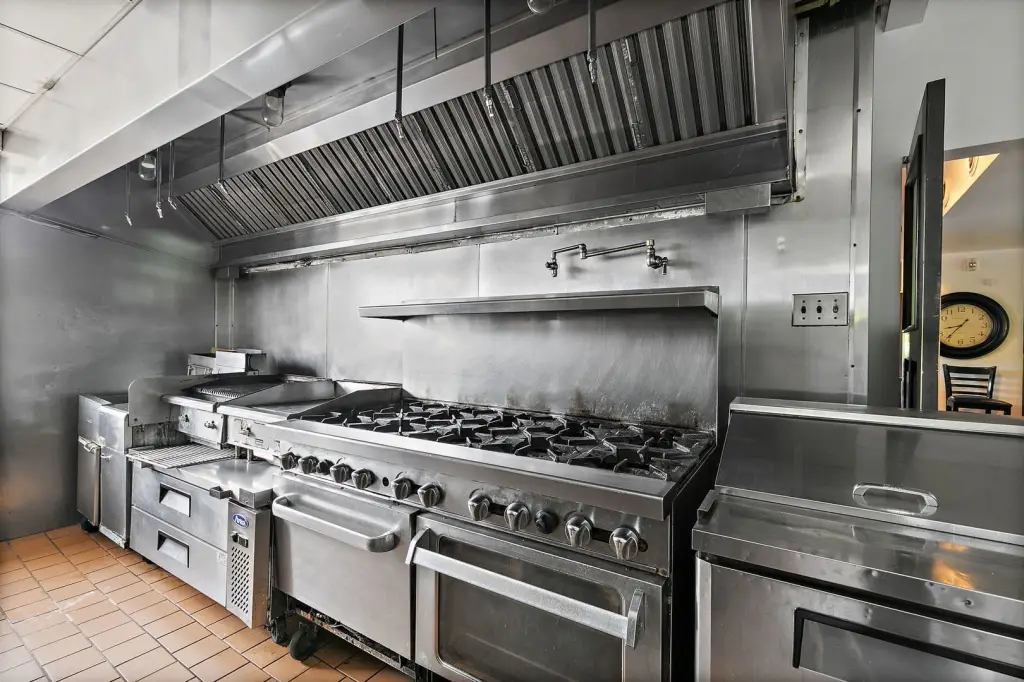
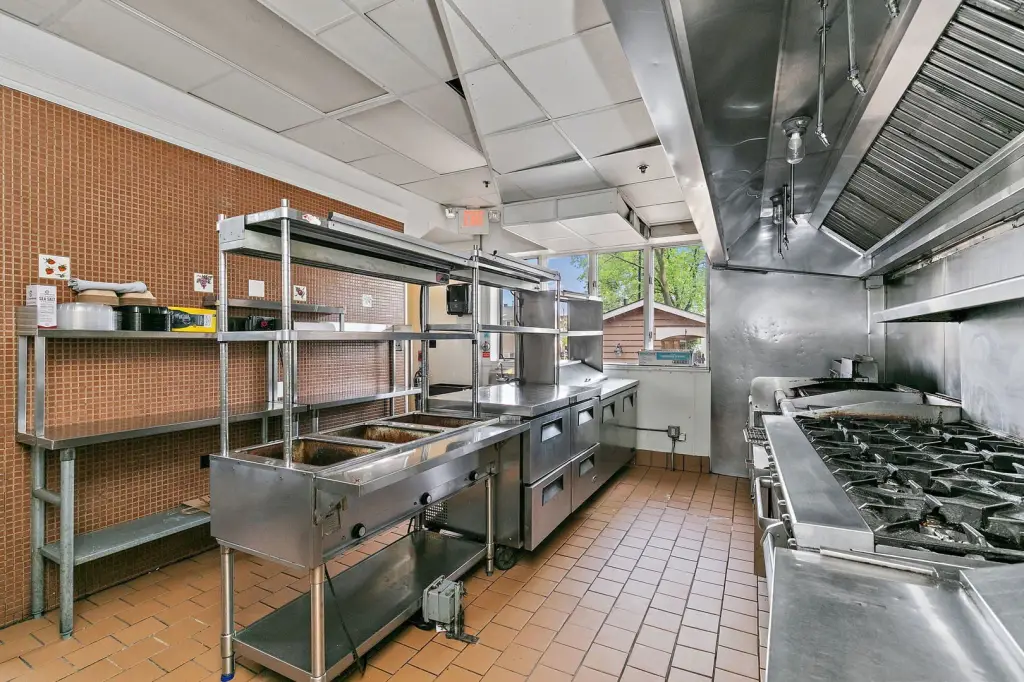
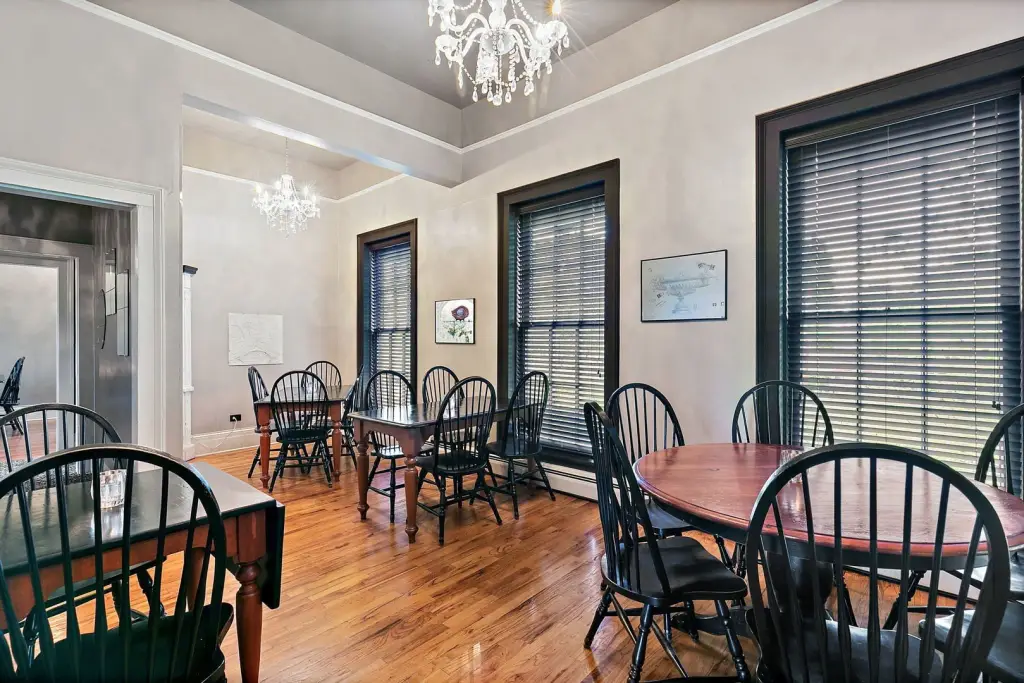
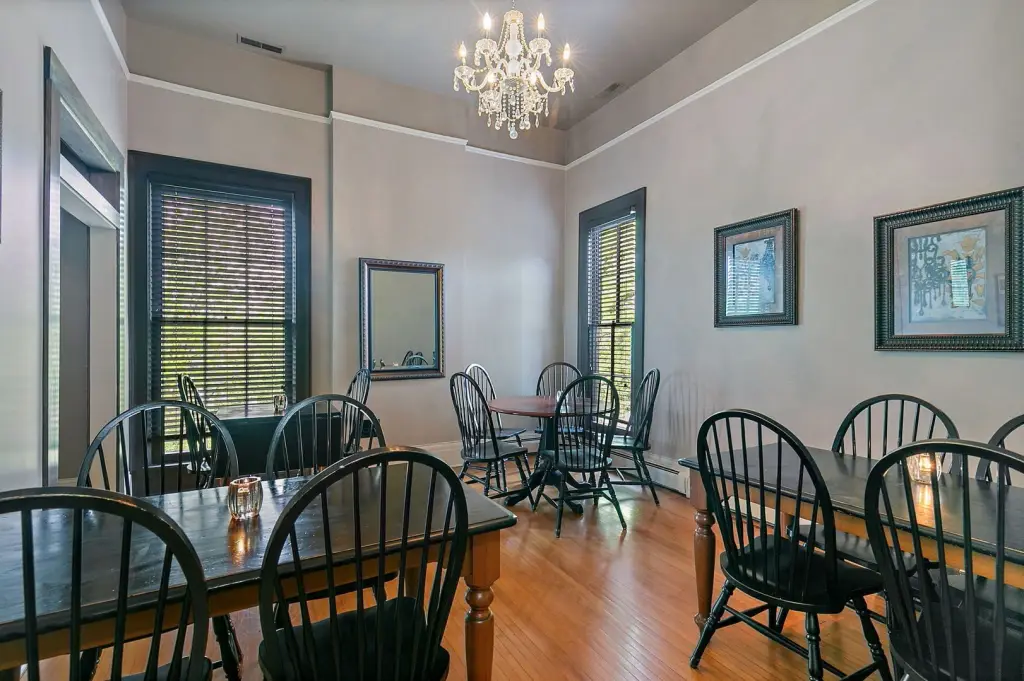
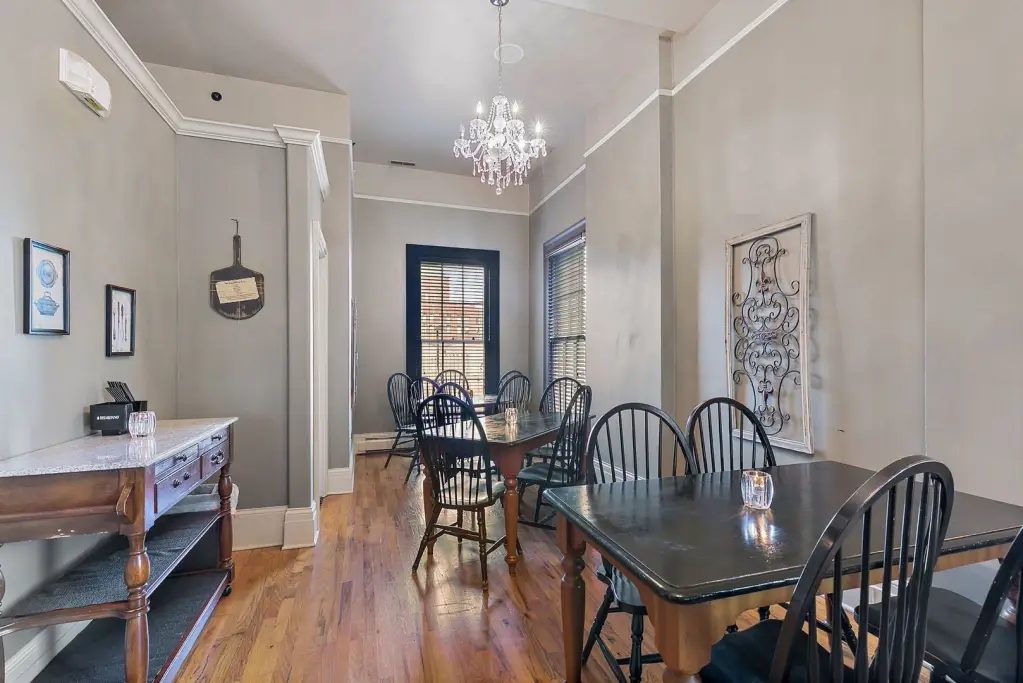
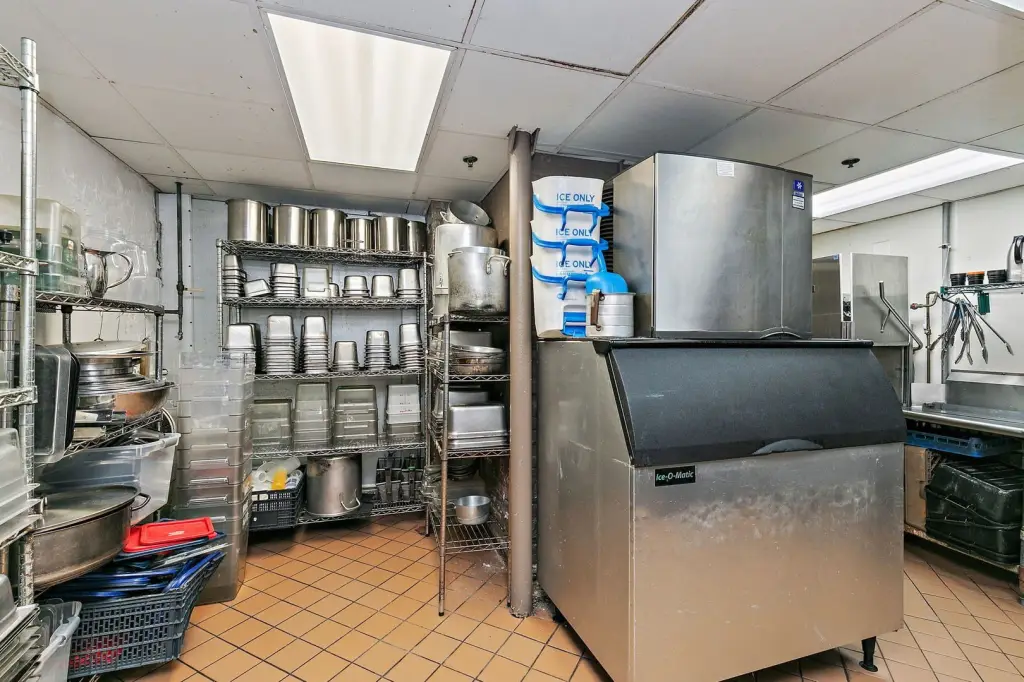
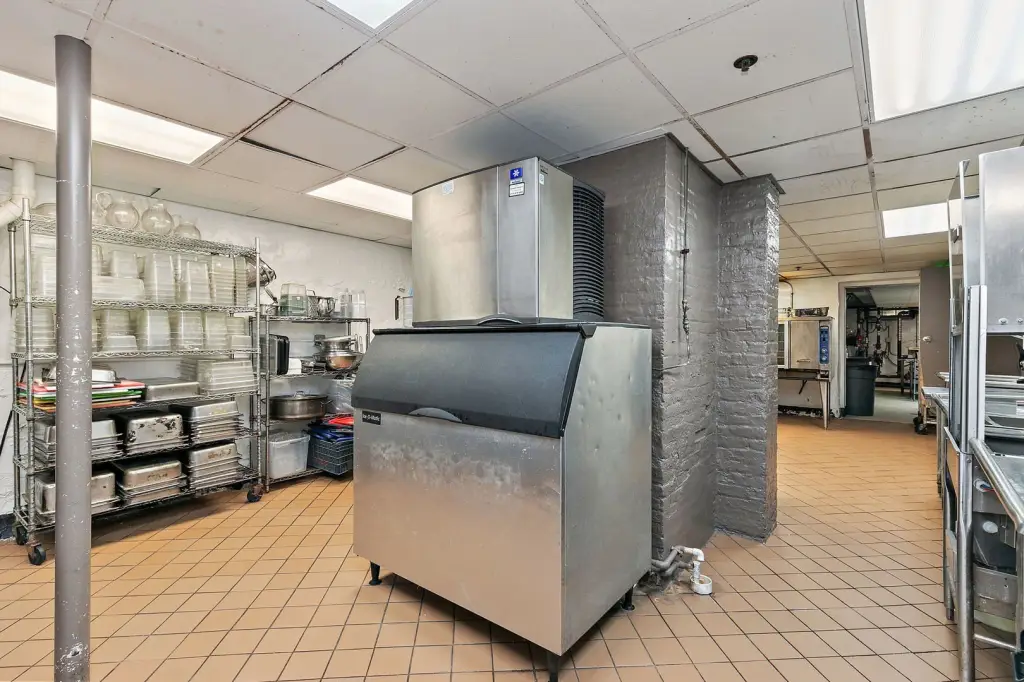
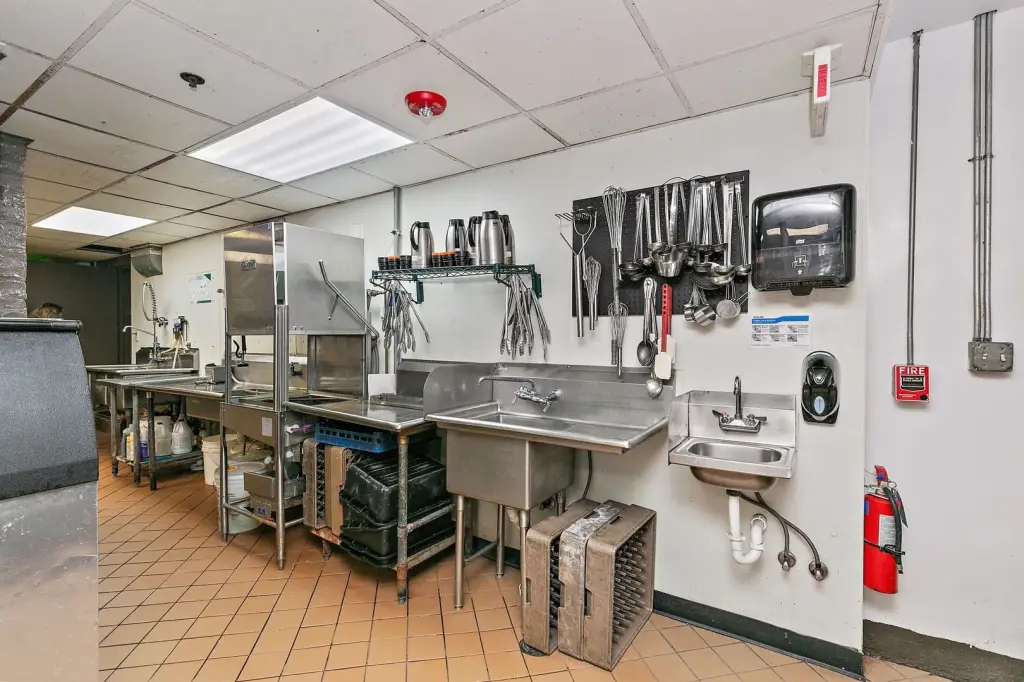
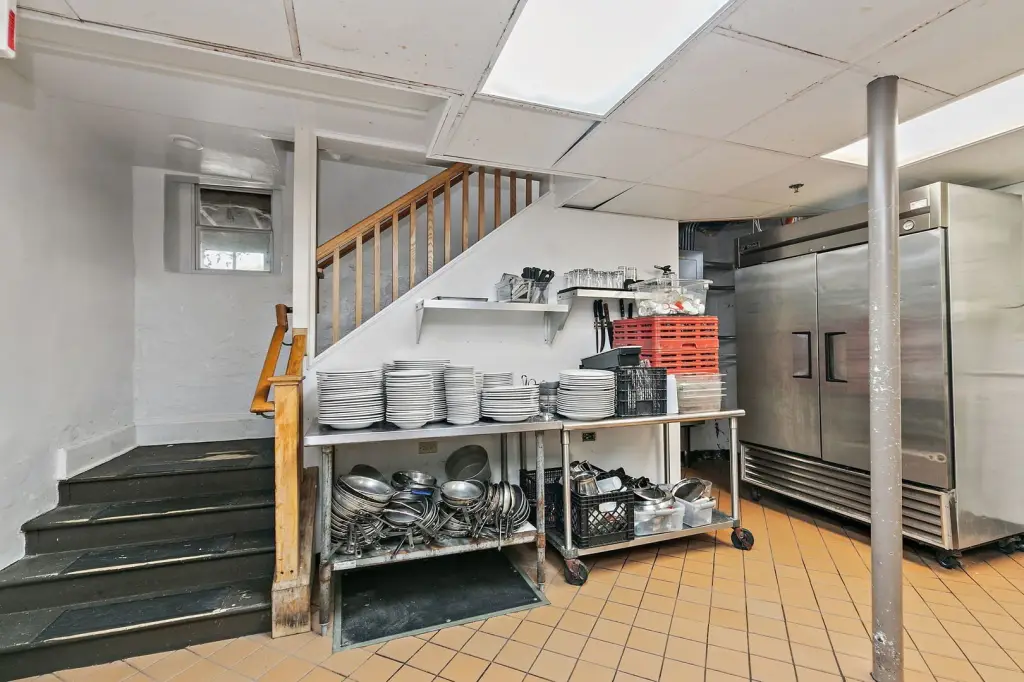
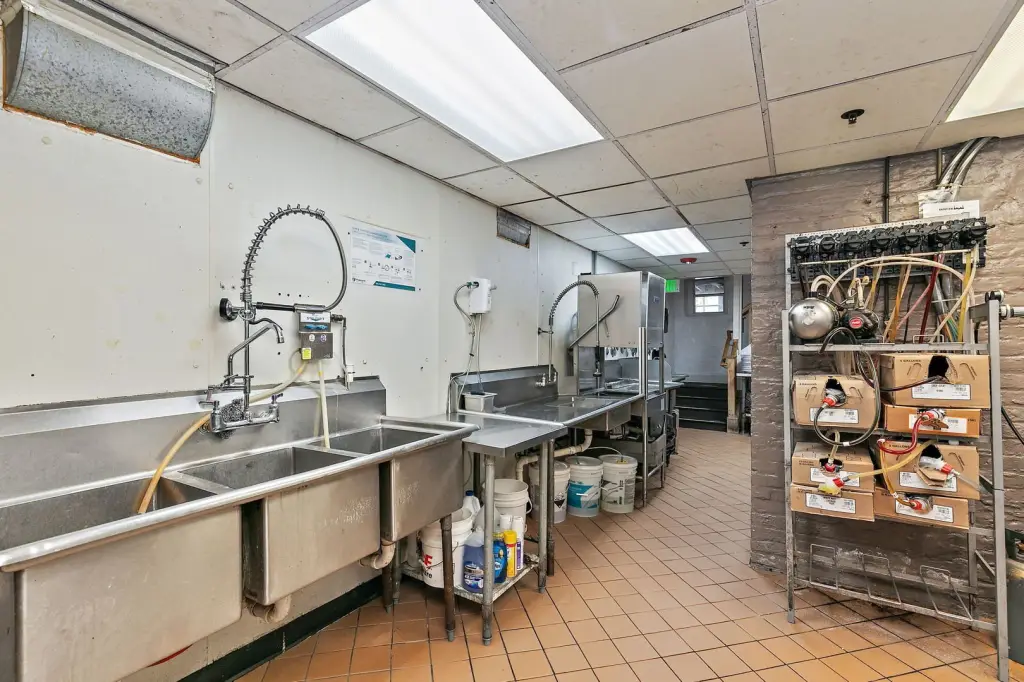
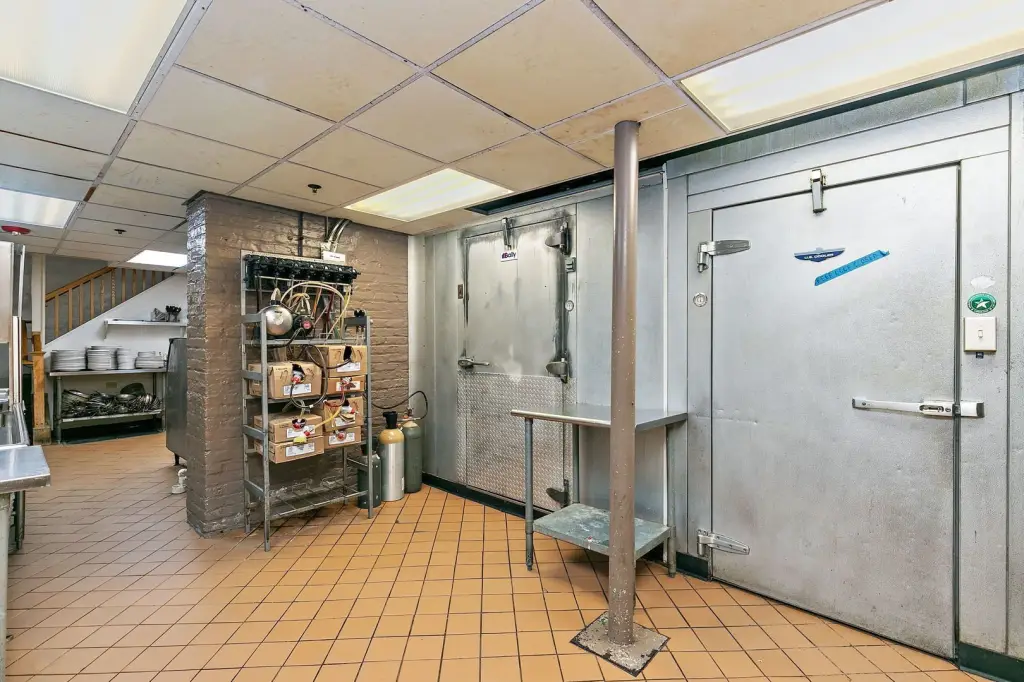
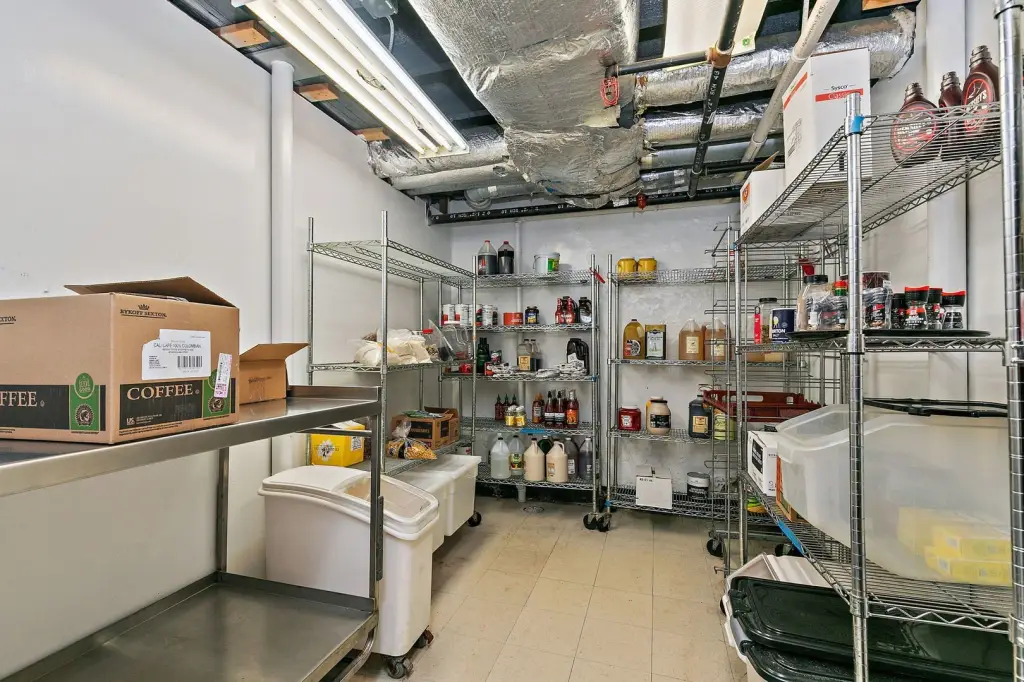
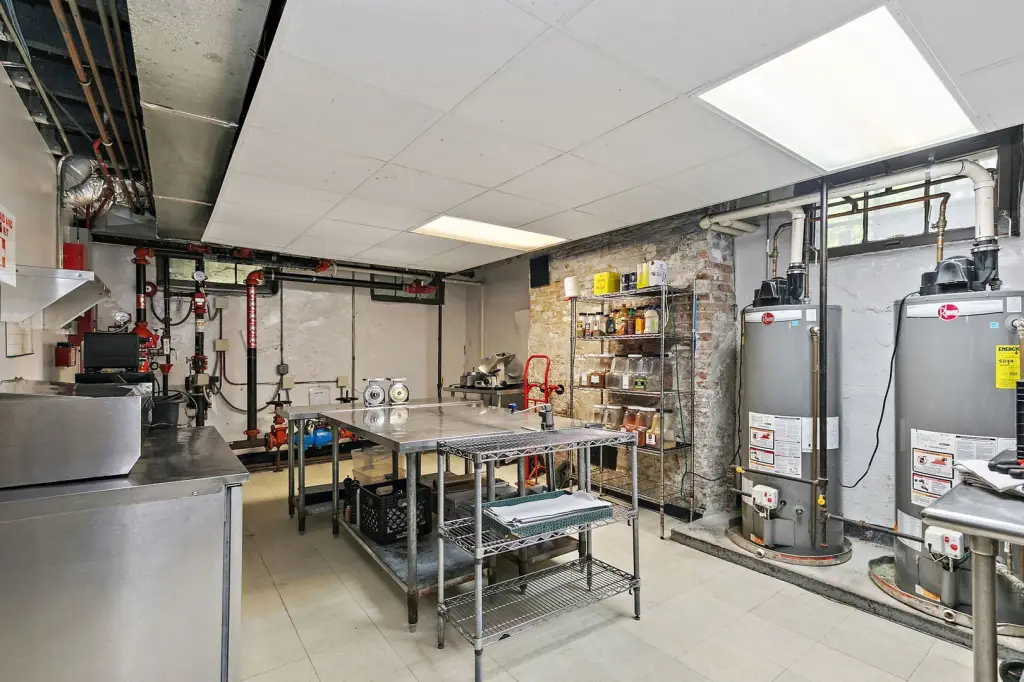
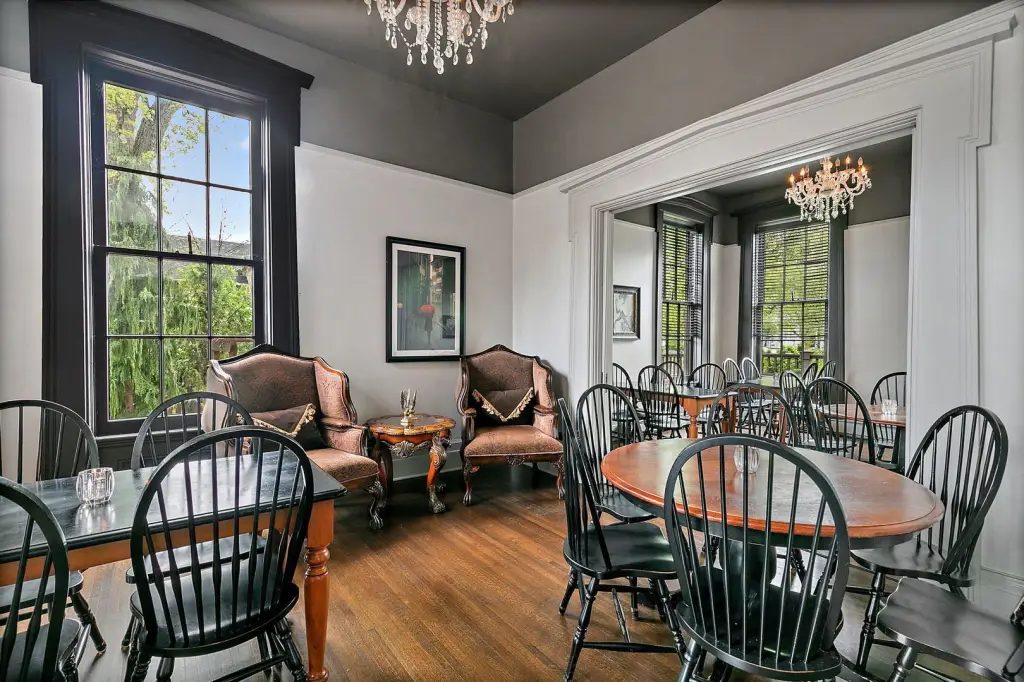
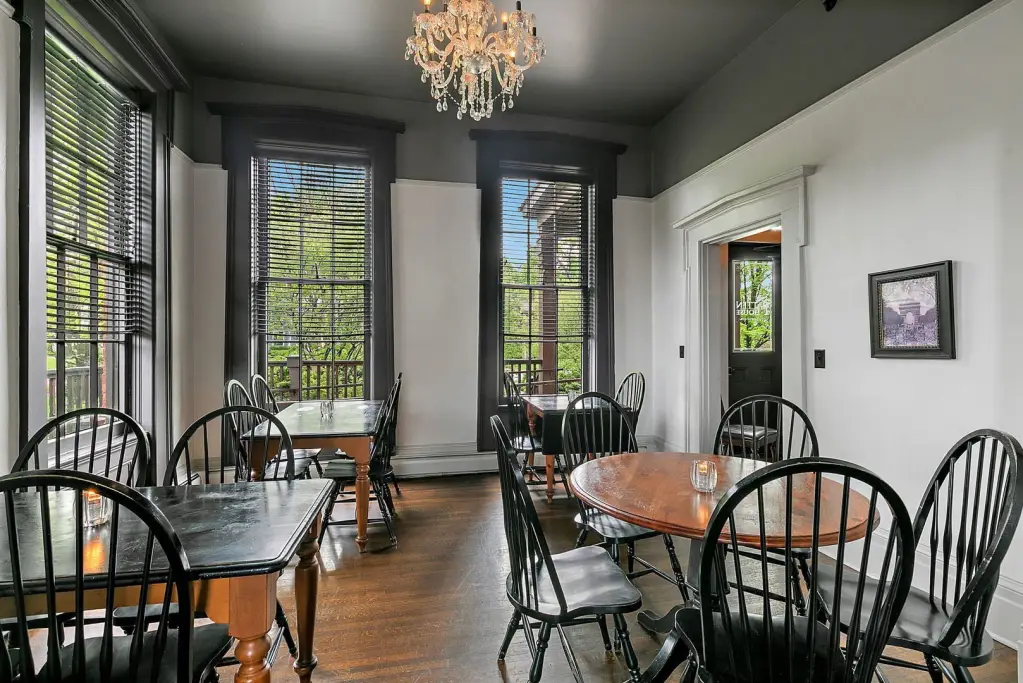
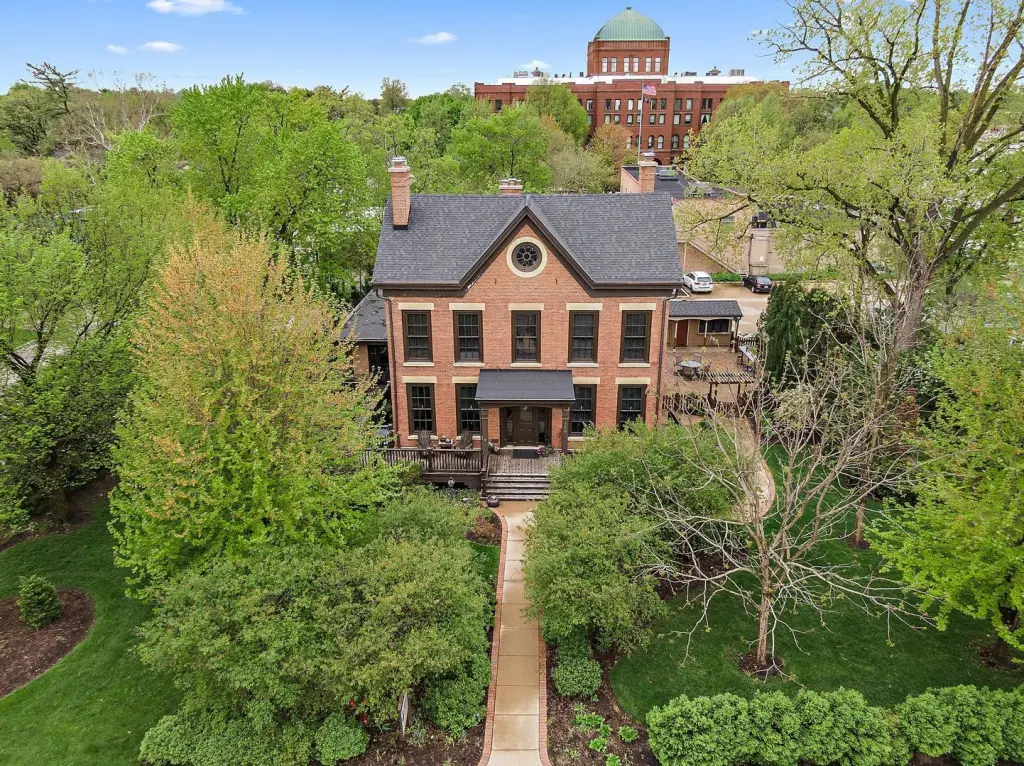
Built in 1860 and rehabilitated in 2013, this brick restaurant property offers approximately 8,000 square feet across four levels. The first and second floors provide seating for at least 150 guests across multiple dining rooms, along with bars, bathrooms, fireplaces, office space, and utility areas. A commercial kitchen, food-preparation areas, storage rooms, pantry, liquor room, linen room, walk-in coolers, ice machine, and dishwasher support restaurant operations. The third floor is unfinished and currently used for storage.
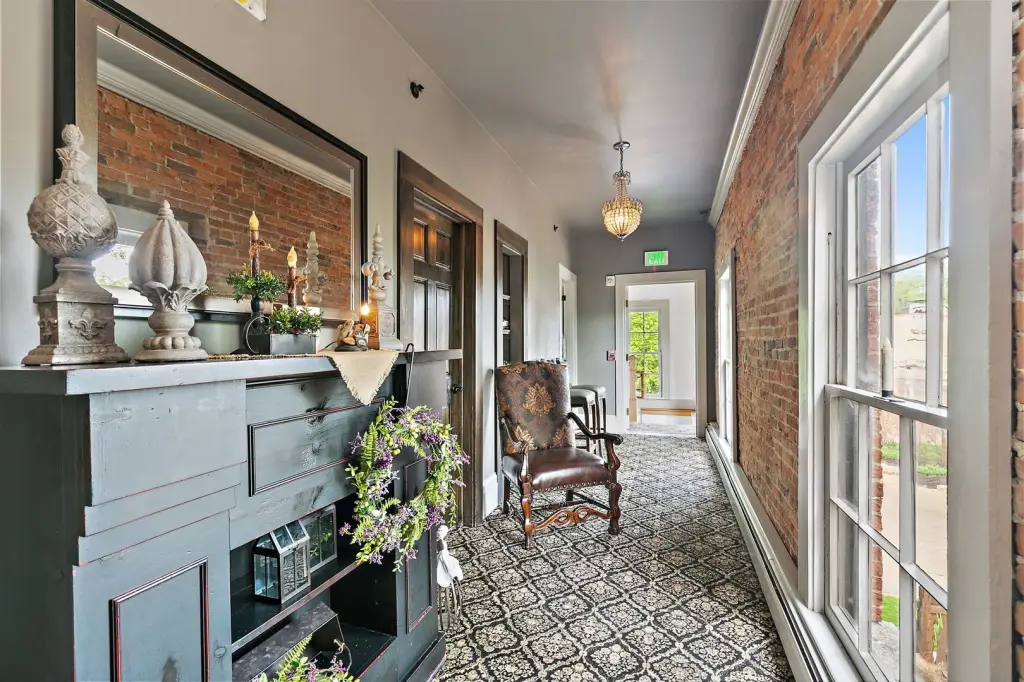
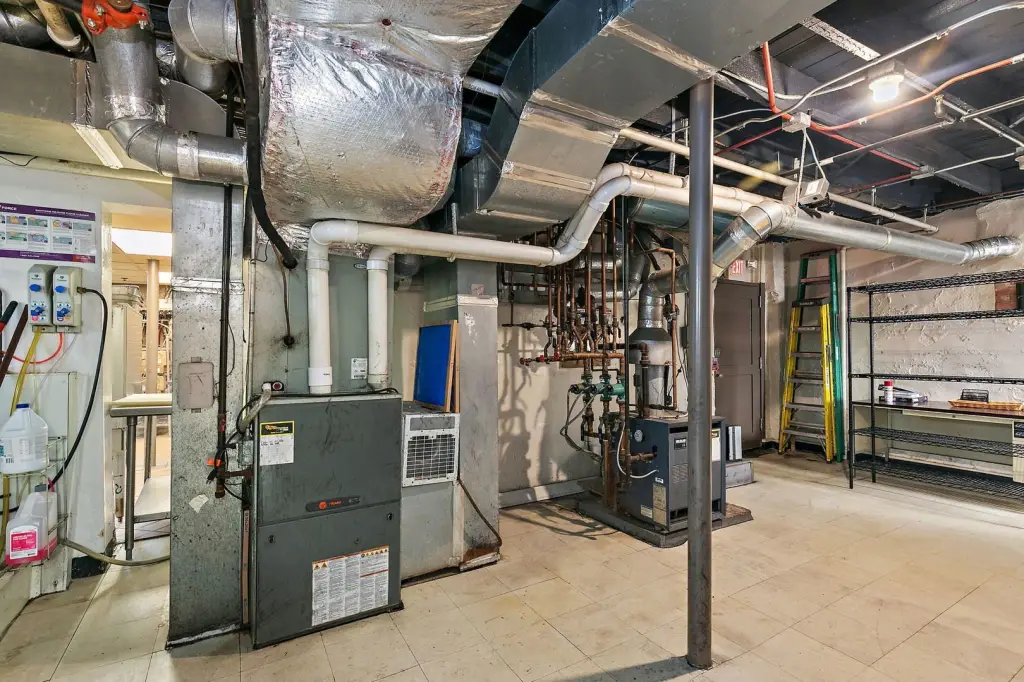
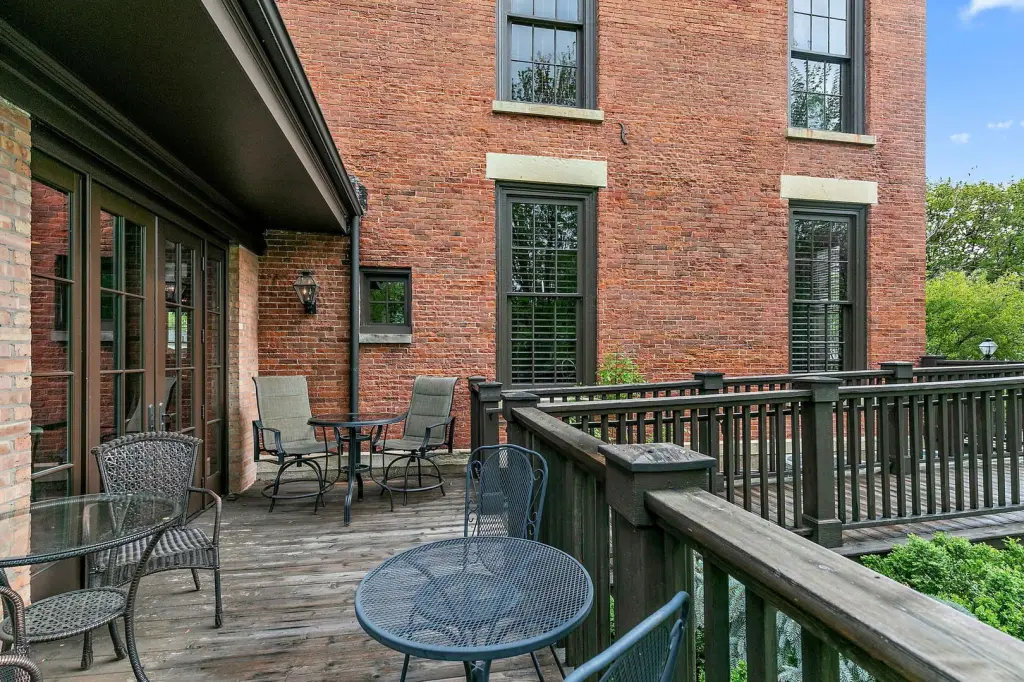
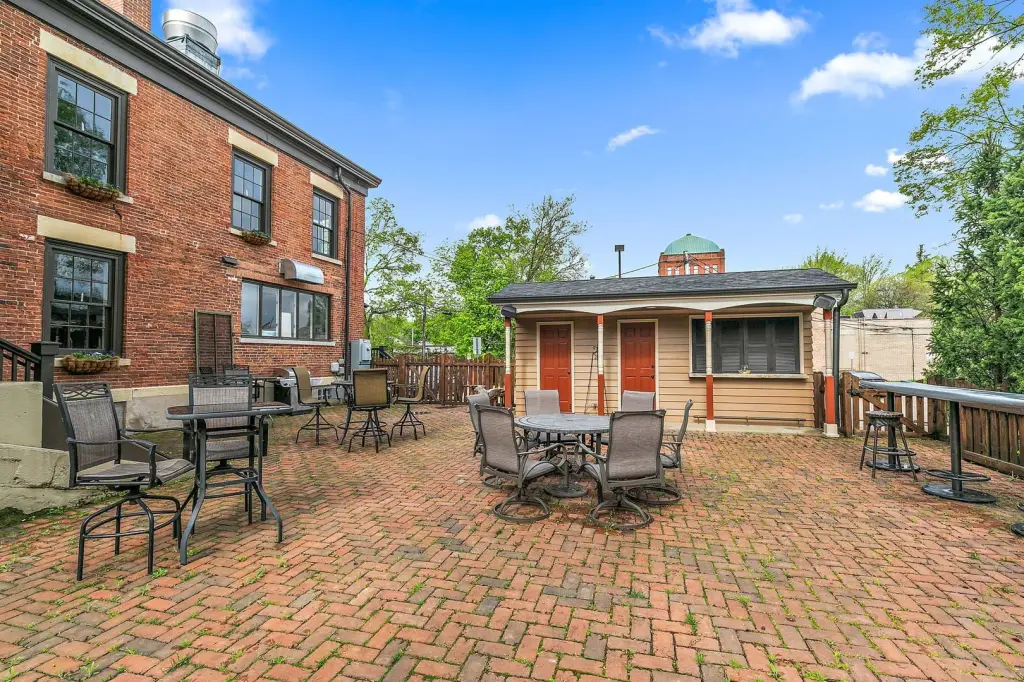
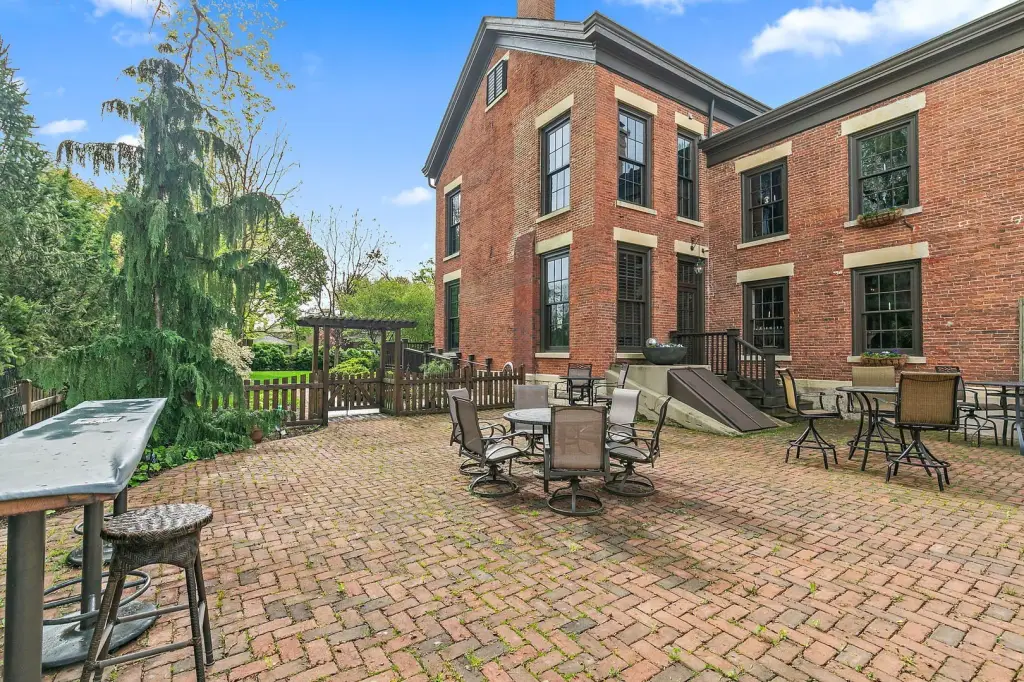
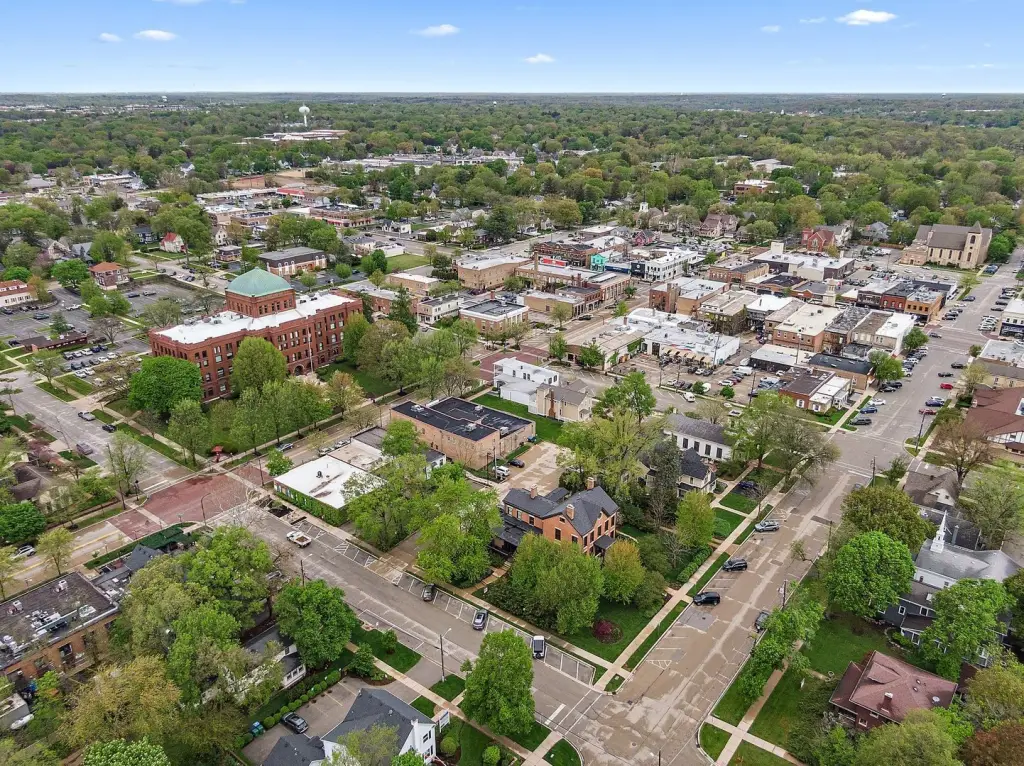
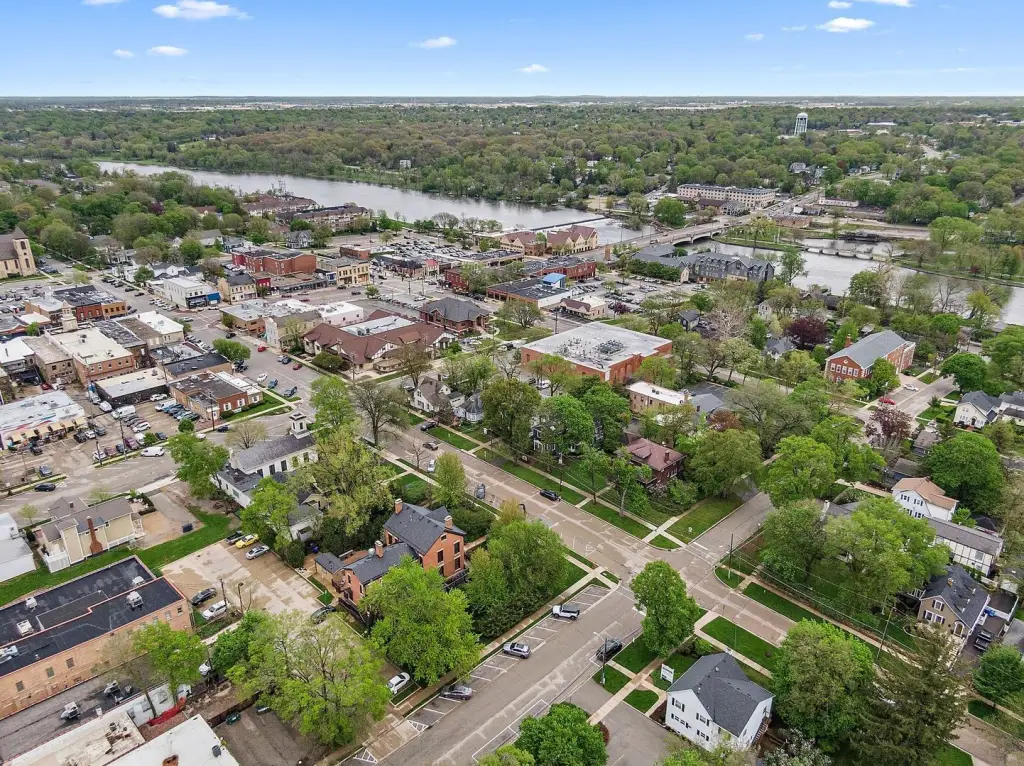
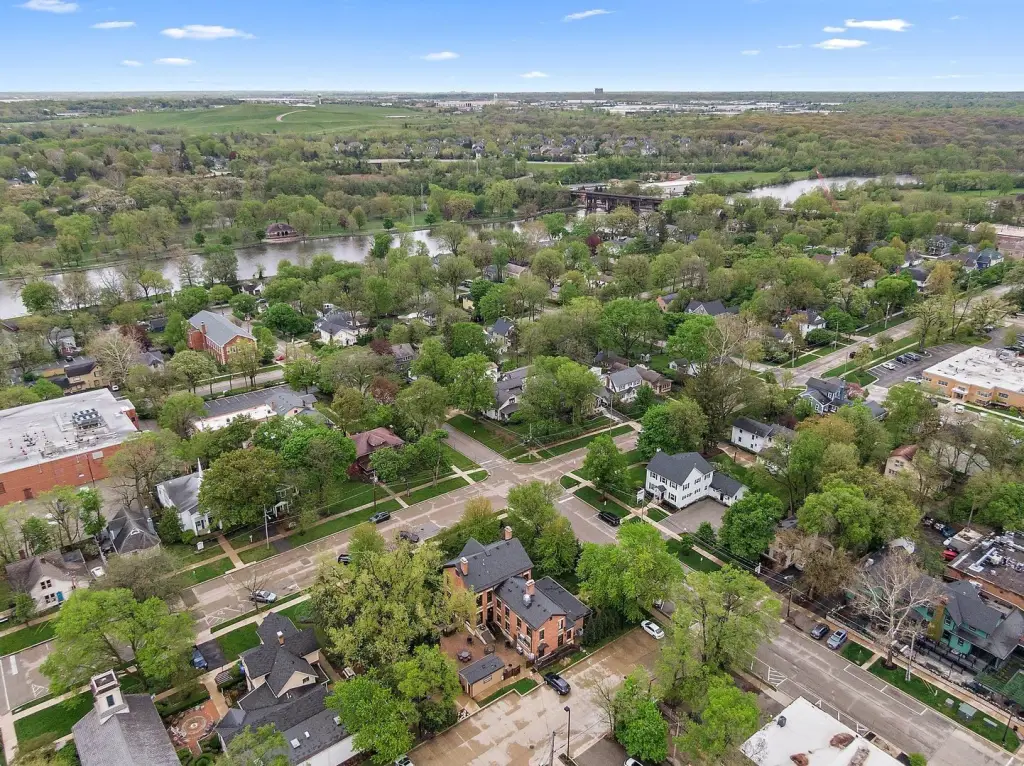
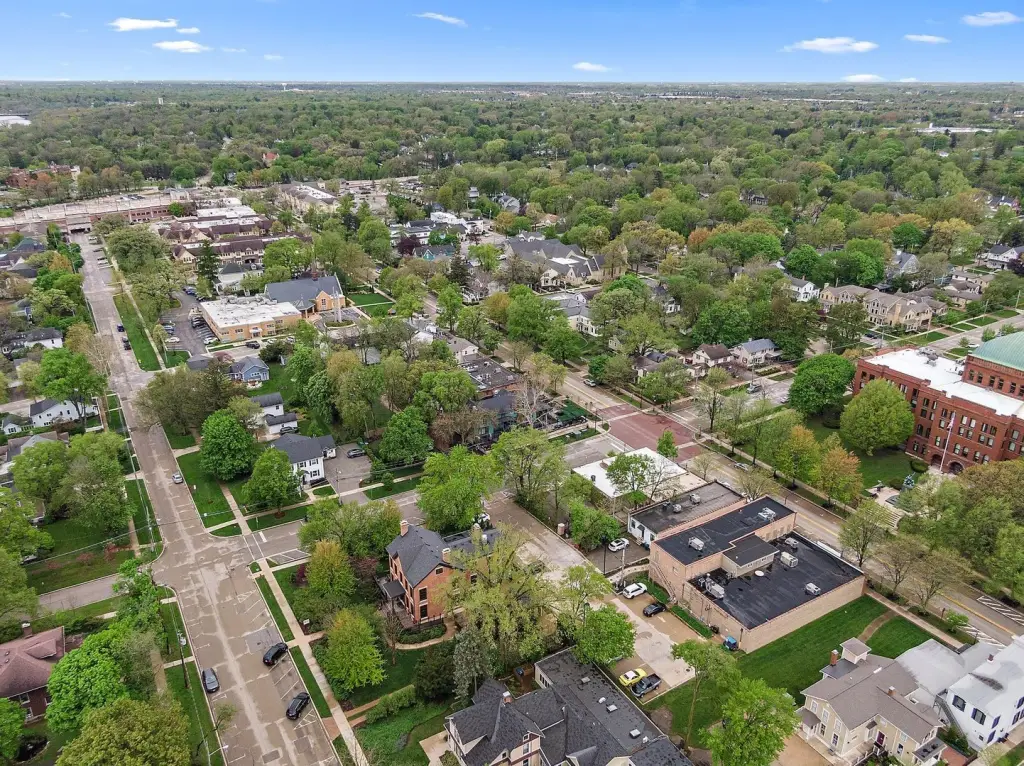
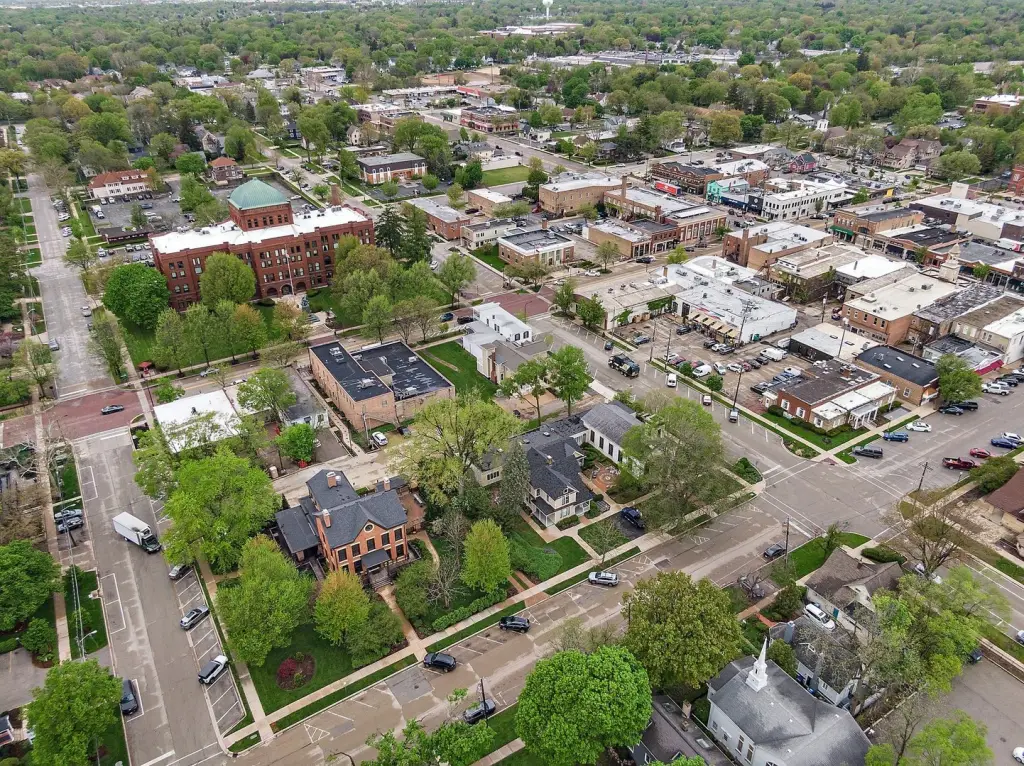
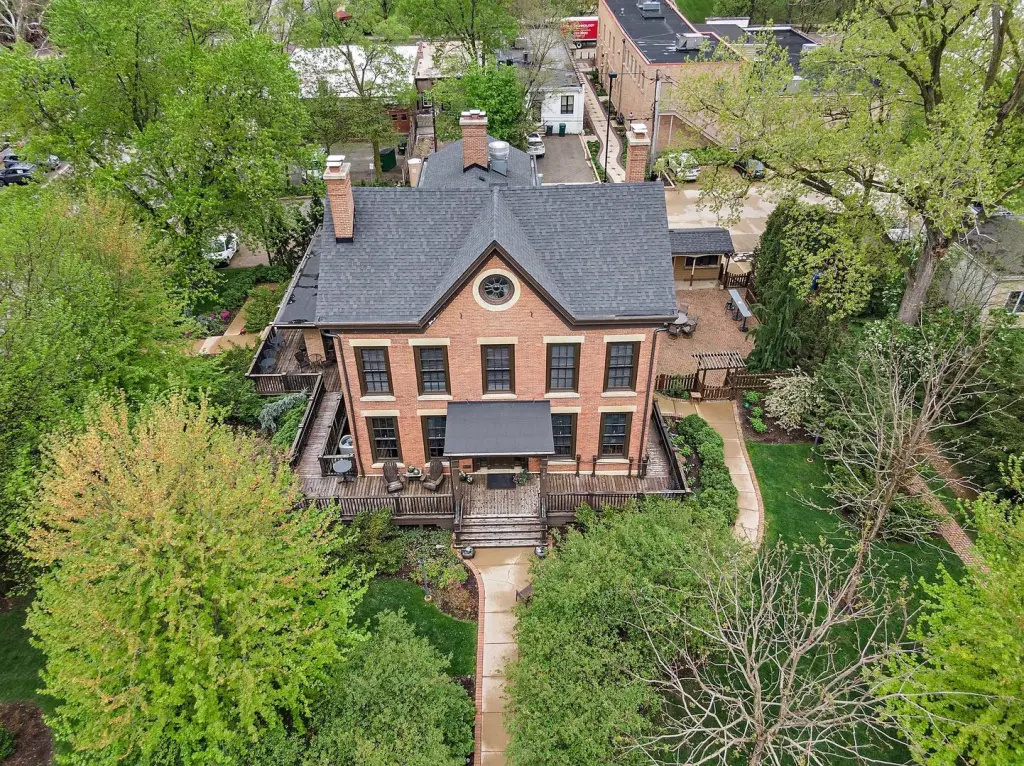
Outdoor space includes a fenced brick patio with room for 130 additional guests, a wrap-around porch, landscaped grounds, and a small patio building containing a restroom and bar. Building features include hardwood flooring, millwork, 12-foot ceilings, 8-foot windows, and two fireplaces. System improvements include a 4-inch main water line, 400-amp electrical service, three furnaces, one boiler, three air-conditioning units, updated electrical and plumbing, and sprinkler coverage on all four levels. The property is zoned COMMR and is located near Geneva's Third Street shopping district.
Outdoor space includes a fenced brick patio with room for 130 additional guests, a wrap-around porch, landscaped grounds, and a small patio building containing a restroom and bar. Building features include hardwood flooring, millwork, 12-foot ceilings, 8-foot windows, and two fireplaces. System improvements include a 4-inch main water line, 400-amp electrical service, three furnaces, one boiler, three air-conditioning units, updated electrical and plumbing, and sprinkler coverage on all four levels. The property is zoned COMMR and is located near Geneva's Third Street shopping district.
Key Highlights
- Approximately 8,000 SF across four levels
- Indoor seating for at least 150 guests
- Fenced brick patio accommodates 130 additional guests
Financial Insights
Estimated NOI and Cap Rate
NOI / Yr
$100,008
Cap Rate
3.45%
Suggested Prices Based on Cap Rates
Cap Rate 5%
$2,000,160
$2.0M
Cap Rate 7%
$1,428,686
$1.4M
Cap Rate 9%
$1,111,200
$1.1M
Market Conditions
NOI Build-Up for 8,000 SF
Gross rent
$144.0K $18.00/SF
− Vacancy
−$10.7K −$1.33/SF
EGI
$133.3K $16.67/SF
− OpEx
−$33.3K −$4.17/SF
NOI
$100.0K $12.50/SF
Area
Kane County, IL
Vacancy
7.40%
Lease Rate
$18.00 /SF/Yr
Expense Ratio
25.00%
Simulate Cap Rate and NOI
Suggested Prices Based on Cap Rates
Cap Rate 5%
$2,000,160
Cap Rate 7%
$1,428,686
Cap Rate 9%
$1,111,200
Alternative Uses
Best Use
Specialty Retail
$1.43M
$1.25M – $1.67M
NOI $100,008 @ 7.0% cap · market cap 3.45%
Second Best
Industrial
$492.0K
$430.5K – $574.0K
NOI $34,437 @ 7.0% cap · market cap 1.19%
Theoretical Best
Office A
$2.76M
$2.42M – $3.22M
NOI $193,342 @ 7.0% cap · market cap 6.68%
Zoning and permitted uses should be independently verified with authorities.
How Realmo checks its estimates
Property Analytics
Unlock full access to Insights
Subscribe to Realmo Intelligence
Open Analytics
Current Use
Lease Details
Yes
Sprinkler system
Yes
Utilities to site
Location Intelligence
Trade Area within ½ mile
1,804
Businesses Nearby
21k
Monthly Visits Nearby
Under-served
Demand for This Use
Explore this area
Business Placement
Foot Traffic Nearby
Home Improvements & Furnishings 33%
Dining 28%
Shops & Services 24%
Apparel 8%
Geneva Ace Hardware
Home Improvements & Furnishings
6,970 visits/mo
0.4 miles
Dunkin' Donuts
Dining
5,871 visits/mo
0.4 miles
7-Eleven
Shops & Services
5,150 visits/mo
0.4 miles
J.McLaughlin
Apparel
1,773 visits/mo
0.1 miles
Elements Massage
Beauty & Spa
1,459 visits/mo
0.3 miles
Demographics for 60134, IL
30,503
Population
11,159
Households
2.7
Avg Household Size
42
Median Age
66%
College-Educated
97%
High-School Grad
14.6 sq mi
ZIP Area
2,089
Density / Sq Mi
$148,283
Median Household Income
$66,586
Median Earnings
$1,816
Median Rent
$427,300
Median Home Value
Check the figures for this property
Cap Rate, Value Estimation, Potential NOI and more
View Realmo Analytics
Market
Vacancy Rate% for Retail in Midwest region




Frequently Asked Questions
What type of property is this?
Conventional restaurant - Four-level restaurant property with commercial kitchen, event-capable outdoor seating, and updated building systems.
Where is this conventional restaurant located?
The property is located at 124 S 2nd Street Geneva, IL.
What is the asking price?
The asking price for this property is $2,895,000.
What are key features of this property?
This property features: Approximately 8,000 SF across four levels; Indoor seating for at least 150 guests; Fenced brick patio accommodates 130 additional guests


