Lincoln Park Sports Bar &
For Sale
Contact for pricing
Pending
2249 N Lincoln Avenue, Chicago, IL 60614
Two-story sports bar and grill in Lincoln Park.
Property Size5,994 SF
Days on Market772
Property Features for 2249 N Lincoln Avenue
General Information
Standard status
Pending
Size
5,994 SF
Property subtype
Retail, Business for Sale
Zoning
OTHER
Site & Location
Neighborhood
Lincoln Park
Building Details
Stories
2
Listing Agency:
Kudan Group
Listed By:
Juan Carlos Gomez · License #IL
(914) 713-3270
Source:
Crexi
Added: Sep 13, 2024
Changed: Oct 20
Last Checked: Oct 23 at 6:21AM
Displayed information is deemed reliable but is not guaranteed and should be independently verified. All listing content including descriptions, pricing, images are the copyrighted material of Kudan Group

Ask AI about this property
Review the available facts, identify missing information and prepare questions for the agent.
Investment Insights
Based on property information with market context.
This two-story sports bar and grill is located on Lincoln Avenue in the heart of Lincoln Park's dining and entertainment corridor. The property is being conveyed with an Incidental Liquor and Retail Food licenses. It features a modern build-out with two full bars, a large kitchen, and an AV system. The facade includes an overhead garage-door that opens onto the street. Additional features include a large basement with bathrooms, an office, coolers, and storage space. The property is fully furnished and equipped.
Key Highlights
- Includes Incidental Liquor and Retail Food licenses.
- Prime location on Lincoln Avenue in Lincoln Park's dining and entertainment corridor.
- Modern build‑out with two full bars, large kitchen, and impressive AV system.
Financial Insights
Estimated NOI and Cap Rate
NOI / Yr
$111,560
Cap Rate
7.20%
Suggested Prices Based on Cap Rates
Cap Rate 5%
$2,231,200
$2.2M
Cap Rate 7%
$1,593,714
$1.6M
Cap Rate 9%
$1,239,556
$1.2M
Market Conditions
NOI Build-Up for 5,994 SF
Gross rent
$158.2K $26.40/SF
− Vacancy
−$9.5K −$1.58/SF
EGI
$148.7K $24.82/SF
− OpEx
−$37.2K −$6.20/SF
NOI
$111.6K $18.61/SF
Area
Chicago, IL
Vacancy
6.00%
Lease Rate
$26.40 /SF/Yr
Expense Ratio
25.00%
Simulate Cap Rate and NOI
Suggested Prices Based on Cap Rates
Cap Rate 5%
$2,231,200
Cap Rate 7%
$1,593,714
Cap Rate 9%
$1,239,556
Alternative Uses
Best Use
Specialty Retail
$1.59M
$1.39M – $1.86M
NOI $111,560 @ 7.0% cap · market cap 7.20%
Second Best
—
—
no second resolved use
Theoretical Best
Office A
$2.83M
$2.47M – $3.30M
NOI $197,831 @ 7.0% cap · market cap 12.76%
Zoning and permitted uses should be independently verified with authorities.
How Realmo checks its estimates
Property Analytics
Who owns this building?
See the owner, sales and loan history
Open Analytics
Current Use
Location Intelligence
Trade Area within ½ mile
5,303
Businesses Nearby
116k
Monthly Visits Nearby
Well-served
Demand for This Use
Explore this area
Business Placement
Foot Traffic Nearby
Dining 56%
Shops & Services 32%
Beauty & Spa 11%
Apparel 1%
Taco Bell
Dining
15,053 visits/mo
0.4 miles
Blue Sushi Sake Grill
Dining
10,380 visits/mo
0.2 miles
Chase Bank
Shops & Services
10,060 visits/mo
0.3 miles
Starbucks
Dining
9,706 visits/mo
0.5 miles
7-Eleven
Shops & Services
8,149 visits/mo
0.5 miles
Demographics for 60614, IL
73,173
Population
38,089
Households
1.9
Avg Household Size
31
Median Age
86%
College-Educated
98%
High-School Grad
3.2 sq mi
ZIP Area
22,867
Density / Sq Mi
$139,561
Median Household Income
$86,386
Median Earnings
$2,019
Median Rent
$730,700
Median Home Value
Check the figures for this property
Cap Rate, Value Estimation, Potential NOI and more
View Realmo Analytics
Market
Vacancy Rate% for Retail in Chicago, IL
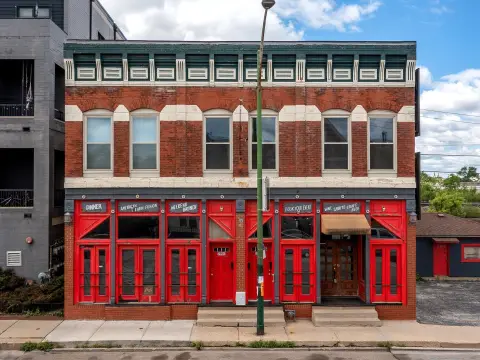
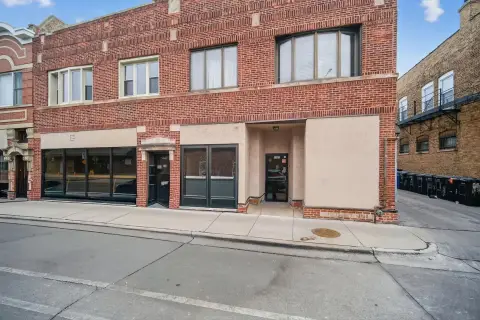

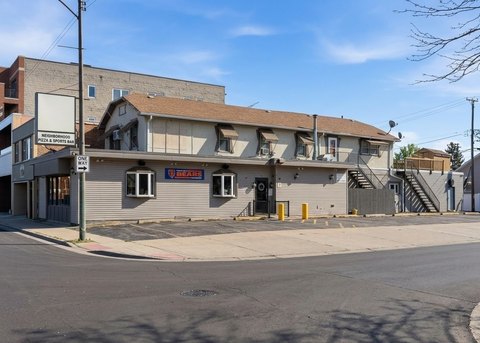



Similar Off Market Nearby
- 1959 Kitchen & Bar — 230 W North Ave 2nd floor, Chicago, IL 60610
- Marge's Still — 1758 N Sedgwick St, Chicago, IL 60614
- The J. Parker — 1816 N Clark St, Chicago, IL 60614
- Elaine's Coffee Call — 1816 N Clark St, Chicago, IL 60614
- Rooftop Chicago — 1816 N Clark St, Chicago, IL 60614
Frequently Asked Questions
What type of property is this?
Bar & Pub - Two-story sports bar and grill in Lincoln Park.
Where is this bar & pub located?
The property is located at 2249 N Lincoln Avenue Chicago, IL.
What is the asking price?
The asking price for this property is $1,550,000.
What are key features of this property?
This property features: Includes Incidental Liquor and Retail Food licenses.; Prime location on Lincoln Avenue in Lincoln Park's dining and entertainment corridor.; Modern build‑out with **two full bars, large kitchen, and impressive AV system.**


