Renovated Triplex with Off-Street
123 Laban Street Providence, RI 02909
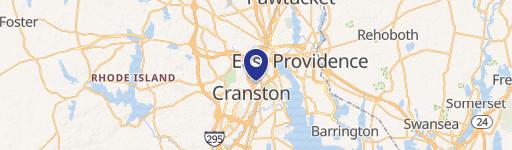
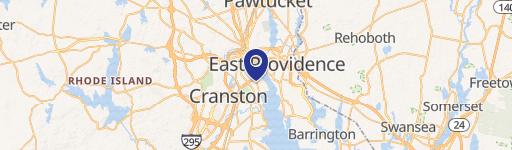
123 Laban Street, Providence, RI, 02909
$675,000
For Sale
$675,000
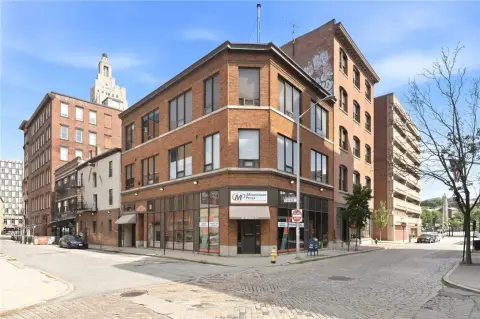
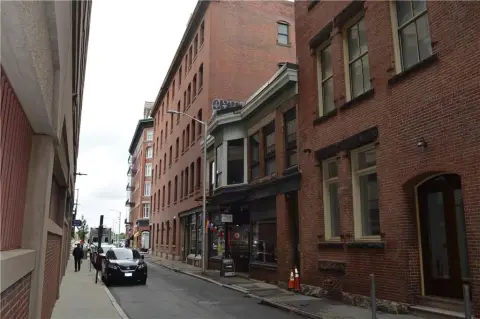
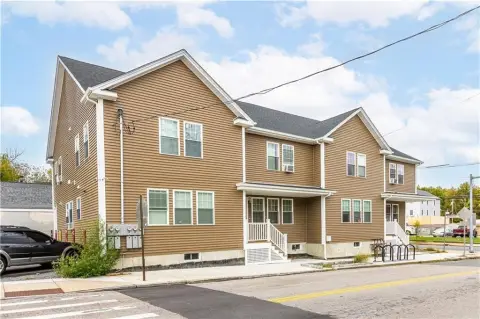
Triplex in Providence with recently renovated second and third floors, new exterior updates, and off-street parking.
Property Size2,322 SF
Price / SF$290.70
Days on Market8
Property Features for 123 Laban Street
General Information
- Standard status
- Active
- Size
- 2,322 SF
- Property subtype
- Multifamily
Building Details
- Year Built
- 1900
Listing agency
Circle 100 Real Estate
(401) 336-6083
Listed by
Elvis Santana
Source
Lockandkeyre
Added: Jul 15 Updated: Jul 21 at 3:28AM Checked: Jul 22 at 4:56AM
Displayed information is deemed reliable but is not guaranteed and should be independently verified. All listing content including descriptions, pricing, images are the copyrighted material of Circle 100 Real Estate
Investment Insights
Based on property information with market context.
This triplex at 123 Laban Street offers multiple levels of living space with recent interior improvements. The second and third floors have been recently renovated, and the partially finished basement provides additional usable space. Recent exterior and systems updates include new vinyl siding, new gutters, two new water tanks, a 6-camera surveillance system, and a repaved driveway designed to support off-street parking. The roof was replaced in 2019 by the prior owner.
Located in Providence, Rhode Island, the property combines maintained upgrades with additional space for continued improvements depending on your approach.
Overall, it’s a multifamily structure with a practical layout across floors and a property set up for day-to-day convenience, highlighted by the updated exterior, surveillance, and dedicated parking area.
Located in Providence, Rhode Island, the property combines maintained upgrades with additional space for continued improvements depending on your approach.
Overall, it’s a multifamily structure with a practical layout across floors and a property set up for day-to-day convenience, highlighted by the updated exterior, surveillance, and dedicated parking area.
Key Highlights
- Triplex at 123 Laban Street in Providence (Year built 1900).
- Second and third floors are recently renovated and currently generating market rents.
- Exterior updates include new vinyl siding and new gutters.
Local Financial Insights For Multifamily LT 5
Simulate Cap Rate and NOI
NOI Build-Up
- Vacancy
- income lost from leasable area expected to sit empty during the year — subtracted from gross rent.
- EGI (Effective Gross Income)
- gross rent minus vacancy losses — the realistic income before paying operating costs.
- OpEx (Operating Expenses)
- recurring costs to operate the property (property tax, insurance, utilities, maintenance, management) — excludes financing and capital improvements.
- NOI (Net Operating Income)
- income a property generates after operating costs but before financing and taxes.
| Component | $ | $/SF |
|---|---|---|
| Gross rent | $59.9k | $25.80 |
| − Vacancy | −$3.9k | −$1.68 |
| EGI | $56.0k | $24.12 |
| − OpEx | −$16.8k | −$7.24 |
| NOI | $39.2k | $16.89 |
2,322 SF · lease $25.80/SF/yr · vacancy 6.50% · expense 30.00%
Alternative Uses
Best Use
Multifamily LT 5
$560.1K
$490.1K – $653.5K
NOI $39,210 @ 7.0% cap · market cap 5.81%
Second Best
Apartment 5plus
$503.1K
$440.2K – $587.0K
NOI $35,219 @ 7.0% cap · market cap 5.22%
Theoretical Best
Office A
$776.8K
$679.7K – $906.3K
NOI $54,378 @ 7.0% cap · market cap 8.06%
Zoning and permitted uses should be independently verified with local authorities.
Property Analytics
Location Intelligence
Current Use by Public Records
Triplexes
Similar For Sale Nearby

FAQs
What type of property is this?
Triplex - Triplex in Providence with recently renovated second and third floors, new exterior updates, and off-street parking.
Where is this triplex located?
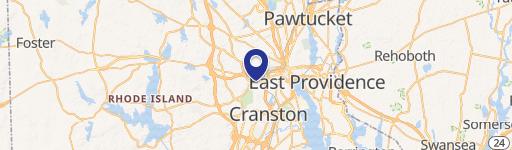
The property is located at 123 Laban Street Providence, RI.
What is the asking price?
The asking price for this property is $675,000.
What are key features of this property?
This property features: Triplex at 123 Laban Street in Providence (Year built 1900).; Second and third floors are recently renovated and currently generating market rents.; Exterior updates include new vinyl siding and new gutters.


