Renovated Mixed-Use
For Sale
$1,199,000
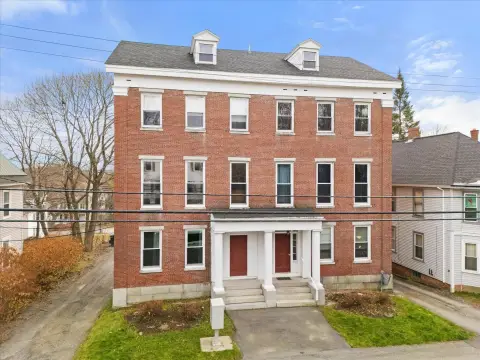
123-127 Franklin Street, Bangor, ME 04401
Four updated apartments accompany a tavern and restaurant component in downtown Bangor’s Development District.
Property Size13,200 SF
Price / SF$90.83
Days on Market230

Ask AI about this property
Review the available facts, identify missing information and prepare questions for the agent.
Property Features for 123-127 Franklin Street
General Information
Standard status
Active
Size
13,200 SF
Property subtype
Commercial
Lease Term
[]
Building Details
Year Built
1912
Listing Agency:
ERA Dawson-Bradford Co.
Listed By:
Stephen Sprague
(207) 319-8129
Source:
Portsiderealestategroup
Added: Feb 27
Changed: Oct 11
Last Checked: Oct 14 at 11:51PM
Displayed information is deemed reliable but is not guaranteed and should be independently verified. All listing content including descriptions, pricing, images are the copyrighted material of ERA Dawson-Bradford Co.
Investment Insights
Based on property information with market context.
This 13,200-square-foot mixed-use building combines four residential apartments with a tavern and restaurant component at 123-127 Franklin Street. The apartments occupy the second and third floors and were renovated between 2015 and 2019. Unit sizes range from 800 SF to 1,000 SF, with hardwood floors, large windows, and washer and dryer hookups. The unit mix includes two-bedroom and three-bedroom layouts, with select units offering dens and additional baths.
Commercial space includes a dining area, bar, and kitchen. Improvements to the commercial areas were completed between 2020 and 2021, including updated kitchen suppression systems, while cosmetic renovations are underway in the first-floor restaurant and bar area. Benjamin’s Pub occupies the lower-level tavern and restaurant space, and the first-floor commercial area is leased by Benjamins.
The property is located in Bangor’s Development District and includes a natural gas furnace installed in 2012. The building façade was repaired and repainted in 2019 using City of Bangor façade grant funds, and the property remains eligible for additional façade grants with up to 50% cost share.
Commercial space includes a dining area, bar, and kitchen. Improvements to the commercial areas were completed between 2020 and 2021, including updated kitchen suppression systems, while cosmetic renovations are underway in the first-floor restaurant and bar area. Benjamin’s Pub occupies the lower-level tavern and restaurant space, and the first-floor commercial area is leased by Benjamins.
The property is located in Bangor’s Development District and includes a natural gas furnace installed in 2012. The building façade was repaired and repainted in 2019 using City of Bangor façade grant funds, and the property remains eligible for additional façade grants with up to 50% cost share.
Key Highlights
- 13,200‑square‑foot mixed‑use building at 123‑127 Franklin Street
- Four apartments renovated between 2015 and 2019
- Apartment layouts range from 800 SF to 1,000 SF
Financial Insights
Estimated NOI and Cap Rate
NOI / Yr
$94,595
Cap Rate
7.89%
Suggested Prices Based on Cap Rates
Cap Rate 5%
$1,891,900
$1.9M
Cap Rate 7%
$1,351,357
$1.4M
Cap Rate 9%
$1,051,056
$1.1M
Market Conditions
NOI Build-Up for 13,200 SF
Gross rent
$166.3K $12.60/SF
− Vacancy
−$15.0K −$1.13/SF
EGI
$151.4K $11.47/SF
− OpEx
−$56.8K −$4.30/SF
NOI
$94.6K $7.17/SF
Area
Penobscot County, ME
Vacancy
9.00%
Lease Rate
$12.60 /SF/Yr
Expense Ratio
37.50%
Simulate Cap Rate and NOI
Suggested Prices Based on Cap Rates
Cap Rate 5%
$1,891,900
Cap Rate 7%
$1,351,357
Cap Rate 9%
$1,051,056
Alternative Uses
Best Use
Specialty Retail
$2.57M
$2.25M – $3.00M
NOI $179,820 @ 7.0% cap · market cap 15.00%
Second Best
Apartment 5plus
$1.59M
$1.39M – $1.85M
NOI $111,261 @ 7.0% cap · market cap 9.28%
Theoretical Best
Office A
$4.26M
$3.73M – $4.97M
NOI $298,426 @ 7.0% cap · market cap 24.89%
Zoning and permitted uses should be independently verified with authorities.
How Realmo checks its estimates
Property Analytics
Unlock full access to Insights
Subscribe to Realmo Intelligence
Open Analytics
Current Use
Location Intelligence
Trade Area within ½ mile
2,014
Businesses Nearby
Explore this area
Business Placement
Demographics for 04401, ME
44,608
Population
20,932
Households
2.1
Avg Household Size
40
Median Age
37%
College-Educated
96%
High-School Grad
100.1 sq mi
ZIP Area
446
Density / Sq Mi
$66,136
Median Household Income
$40,863
Median Earnings
$1,048
Median Rent
$229,600
Median Home Value
Check the figures for this property
Cap Rate, Value Estimation, Potential NOI and more
View Realmo Analytics
Market
Vacancy Rate% for Multifamily in Northeast region








Frequently Asked Questions
What type of property is this?
Mixed-use property - Four updated apartments accompany a tavern and restaurant component in downtown Bangor’s Development District.
Where is this mixed-use property located?
The property is located at 123-127 Franklin Street Bangor, ME.
What is the asking price?
The asking price for this property is $1,199,000.
What are key features of this property?
This property features: 13,200‑square‑foot mixed‑use building at 123‑127 Franklin Street; Four apartments renovated between 2015 and 2019; Apartment layouts range from 800 SF to 1,000 SF


