Apartment Building With
For Sale
$549,999
40 2nd St, Bangor, ME 04401
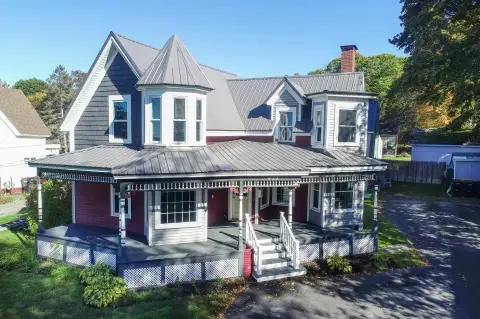
Operational lodging property with furnished rooms, private efficiencies, shared facilities, and a flexible month-to-month tenancy model.
Property Size3,852 SF
Price / SF$142.78
Days on Market90
Property Features for 40 2nd St
General Information
Standard status
Active
Size
3,852 SF
Building Details
Year Built
1897
Listing Agency:
CENTURY 21 Queen City Real Estate
Listed By:
Adam King
(207) 385-6850
Source:
Aroostookrealestate
Added: Jul 20
Changed: Oct 5
Last Checked: Oct 7 at 2:59PM
Displayed information is deemed reliable but is not guaranteed and should be independently verified. All listing content including descriptions, pricing, images are the copyrighted material of CENTURY 21 Queen City Real Estate

Ask AI about this property
Review the available facts, identify missing information and prepare questions for the agent.
Investment Insights
Based on property information with market context.
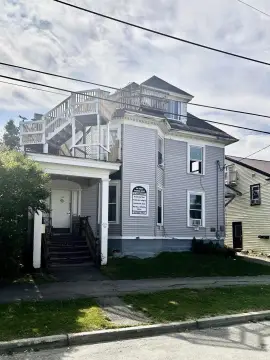
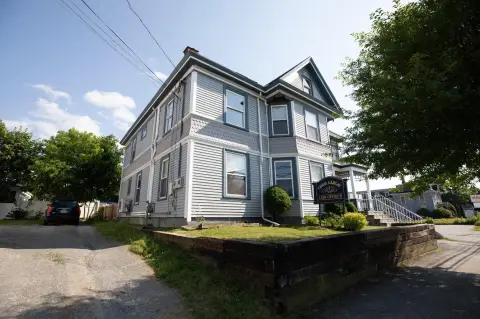
This 3,852-square-foot apartment building at 40 2nd St in Bangor includes nine furnished rooms arranged across three floors, along with two private efficiencies. The rooms share kitchen and bath facilities, while each efficiency has its own bathroom and kitchenette. Furnishings convey with the property, and the building has operated as a boarding house. Constructed in 1897, the property has annual inspections in place.
The asset is positioned near downtown Bangor, hospitals, public transportation, and major commuter routes. Month-to-month tenancy provides a flexible leasing structure, and the property is currently operational. Its room-based layout, private efficiencies, and shared amenities define a specialized multifamily configuration.
The asset is positioned near downtown Bangor, hospitals, public transportation, and major commuter routes. Month-to-month tenancy provides a flexible leasing structure, and the property is currently operational. Its room-based layout, private efficiencies, and shared amenities define a specialized multifamily configuration.
Key Highlights
- 3,852‑square‑foot building at 40 2nd St, Bangor, ME 04401
- Nine furnished rooms across three floors with shared kitchen and bath access
- Two private efficiencies, each with a bathroom and kitchenette
Financial Insights
Estimated NOI and Cap Rate
NOI / Yr
$32,468
Cap Rate
5.90%
Suggested Prices Based on Cap Rates
Cap Rate 5%
$649,360
$649.4K
Cap Rate 7%
$463,829
$463.8K
Cap Rate 9%
$360,756
$360.8K
Market Conditions
NOI Build-Up for 3,852 SF
Gross rent
$62.4K $16.20/SF
− Vacancy
−$3.4K −$0.87/SF
EGI
$59.0K $15.33/SF
− OpEx
−$26.6K −$6.90/SF
NOI
$32.5K $8.43/SF
Area
Penobscot County, ME
Vacancy
5.40%
Lease Rate
$16.20 /SF/Yr
Expense Ratio
45.00%
Simulate Cap Rate and NOI
Suggested Prices Based on Cap Rates
Cap Rate 5%
$649,360
Cap Rate 7%
$463,829
Cap Rate 9%
$360,756
Alternative Uses
Best Use
Apartment 5plus
$463.8K
$405.9K – $541.1K
NOI $32,468 @ 7.0% cap · market cap 5.90%
Second Best
—
—
no second resolved use
Theoretical Best
Office A
$1.24M
$1.09M – $1.45M
NOI $87,086 @ 7.0% cap · market cap 15.83%
Zoning and permitted uses should be independently verified with authorities.
How Realmo checks its estimates
Property Analytics
Unlock full access to Insights
Subscribe to Realmo Intelligence
Open Analytics
Current Use
Location Intelligence
Trade Area within ½ mile
1,932
Businesses Nearby
Explore this area
Business Placement
Demographics for 04401, ME
44,608
Population
20,932
Households
2.1
Avg Household Size
40
Median Age
37%
College-Educated
96%
High-School Grad
100.1 sq mi
ZIP Area
446
Density / Sq Mi
$66,136
Median Household Income
$40,863
Median Earnings
$1,048
Median Rent
$229,600
Median Home Value
Check the figures for this property
Cap Rate, Value Estimation, Potential NOI and more
View Realmo Analytics
Market
Vacancy Rate% for Multifamily in Northeast region






Frequently Asked Questions
What type of property is this?
Apartment building - Operational lodging property with furnished rooms, private efficiencies, shared facilities, and a flexible month-to-month tenancy model.
Where is this apartment building located?
The property is located at 40 2nd St Bangor, ME.
What is the asking price?
The asking price for this property is $549,999.
What are key features of this property?
This property features: 3,852‑square‑foot building at 40 2nd St, Bangor, ME 04401; Nine furnished rooms across three floors with shared kitchen and bath access; Two private efficiencies, each with a bathroom and kitchenette


