Restaurant Property with Adjacent
For Sale
$750,000
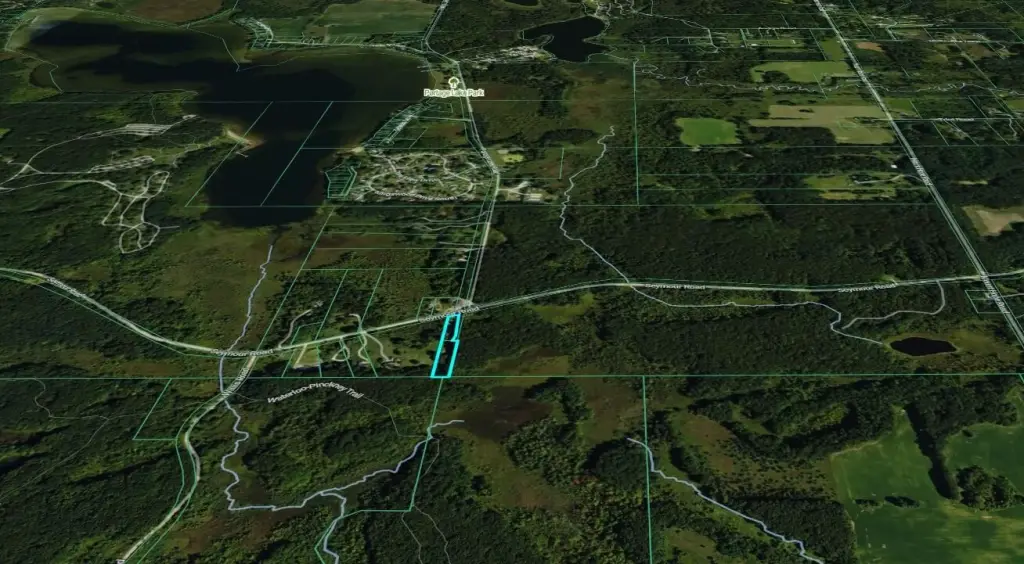
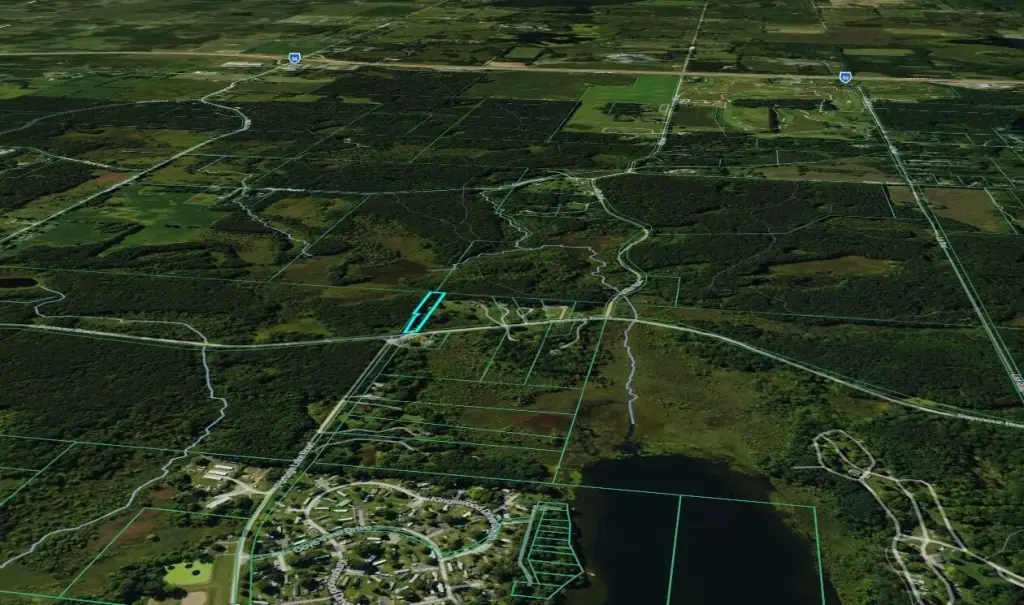
12229 Seymour Road, Grass Lake, MI 49240
Commercial Sale, Grass Lake, MI
Property Size5,310 SF
Lot Size1.09 Acres
Price / SF$141.24
Days on Market150
Property Features for 12229 Seymour Road
General Information
Property type
Commercial Sale
Property subtype
Other
Zoning description
C-1 and R-3
Bathrooms
2
Full bathrooms
2
Rooms
Bathroom 1, Bathroom 2
Elementary school district
Grass Lake
Middle school district
Grass Lake
High school district
Grass Lake
Standard status
Active
APN
000-10-05-351-001-02
Size
5,310 SF
Lot size
1.09 Acres
Taxes and HOA fees
Tax Year
2025
Tax Description
On file
Tax Annual Amount
11332
Legal Description
On file
Utilities
Utilities
Cable Available
Sewer type
Septic Tank
Heating system
Forced Air
Water source
Well
Amenities
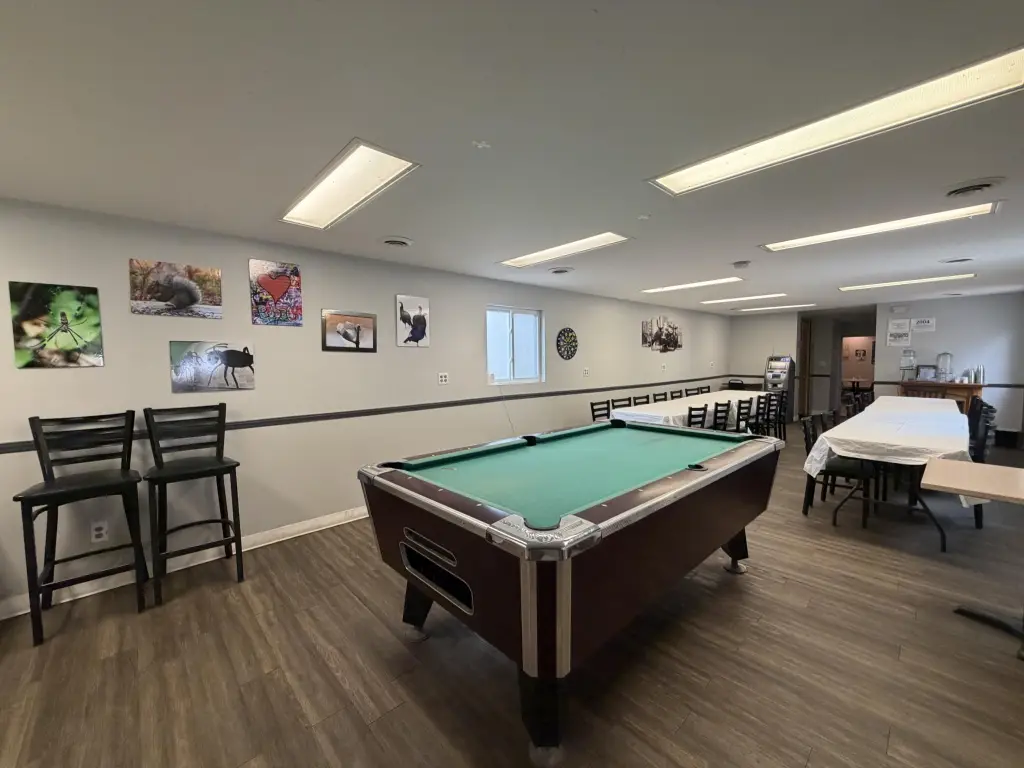
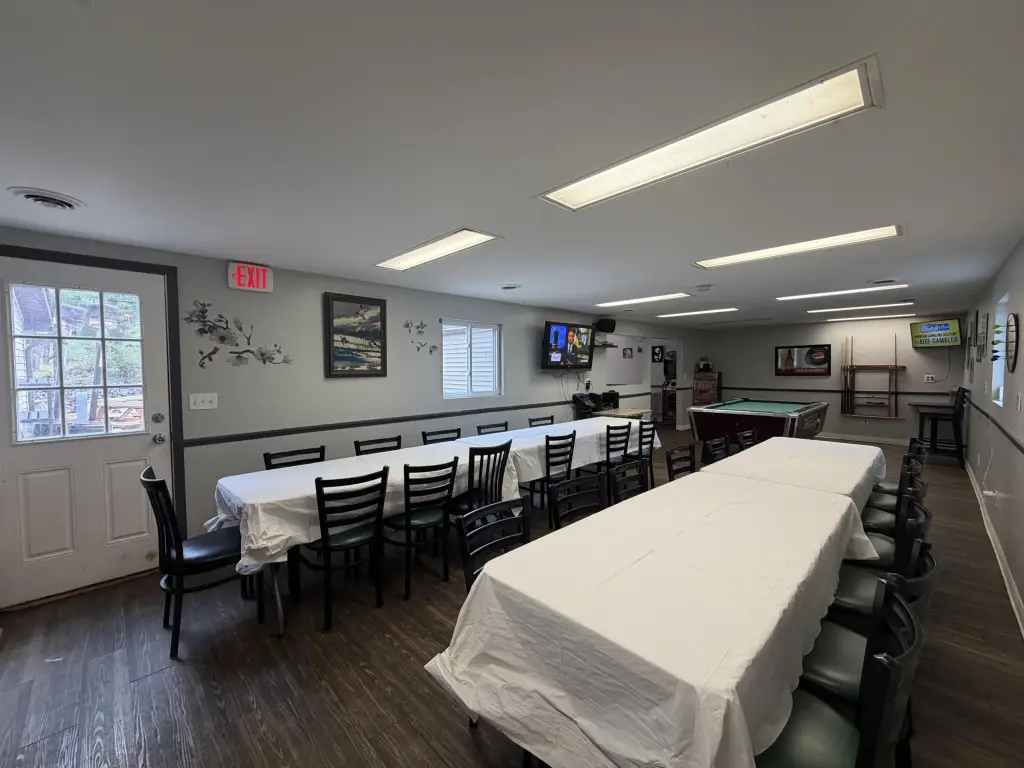
game room
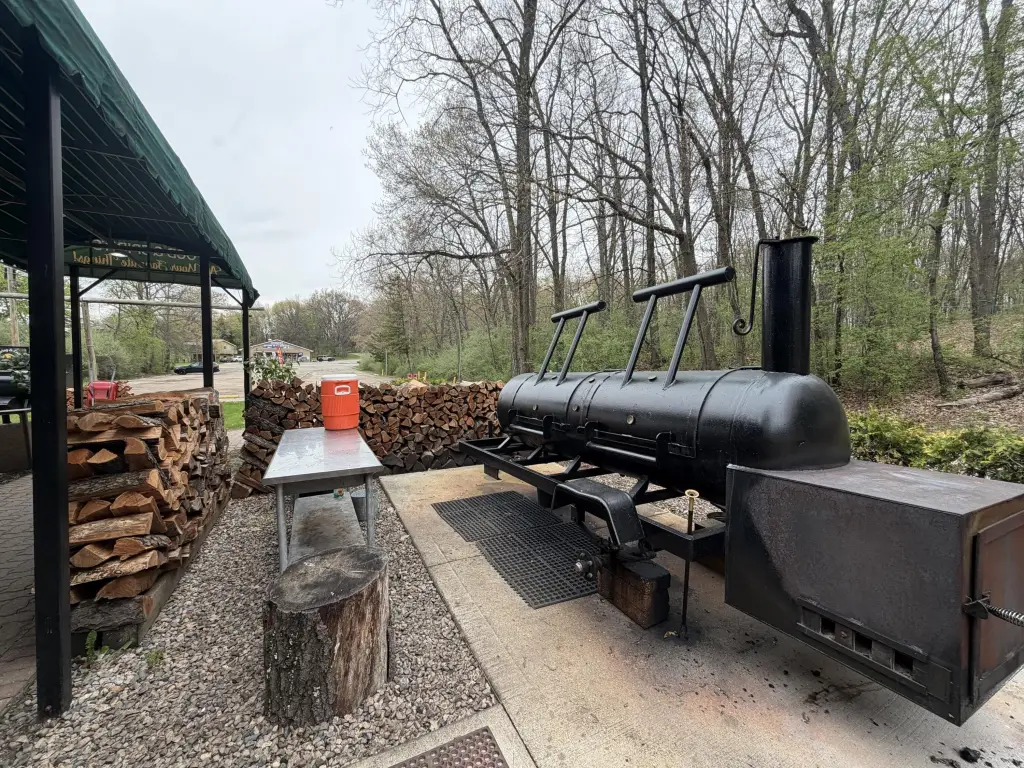
outdoor smoker station
decorative pond
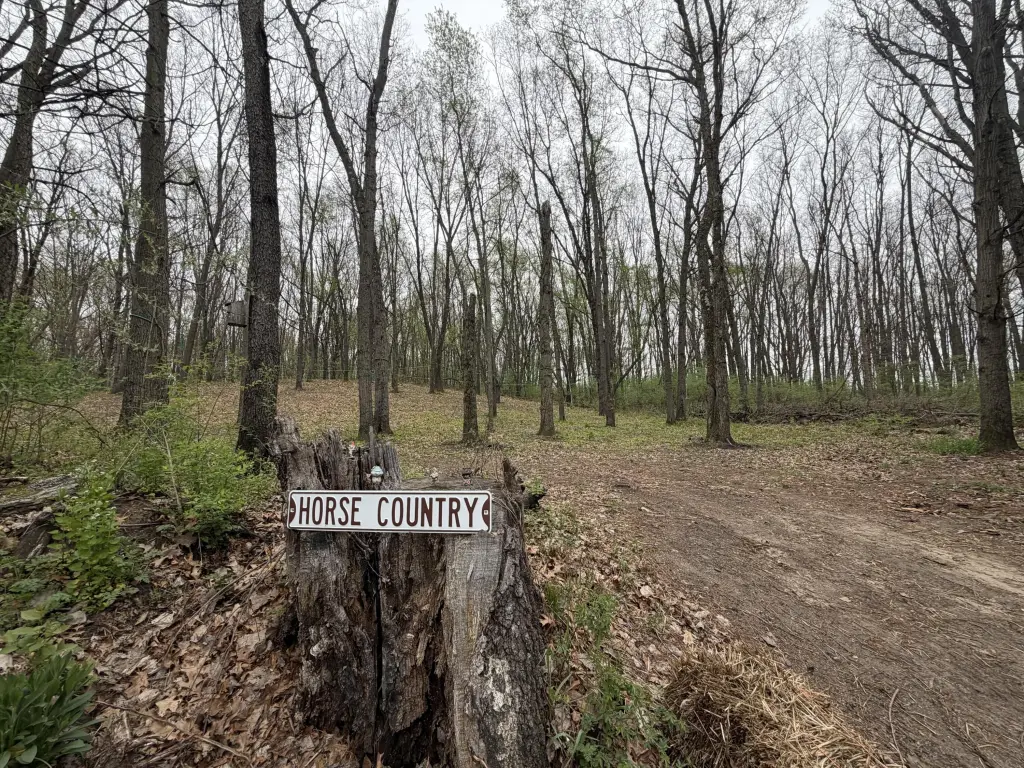
horse parking
Building Details
Year built
1993
Floors in Building
2
Building materials
Vinyl Siding
Listing Agency:
Swisher Commercial
(734) 663-0501
Listed By:
Charles Koenn · License #6506040186
(734) 926-0230
Added: May 14
Changed: Oct 8
Last Checked: Oct 10 at 8:06AM
MLS# 26024715
Copyright © 2026 Michigan Regional Information Center, LLC. All rights reserved. All information provided by the listing agent/broker is deemed reliable but is not guaranteed and should be independently verified.
Investment Insights
Based on property information with market context.
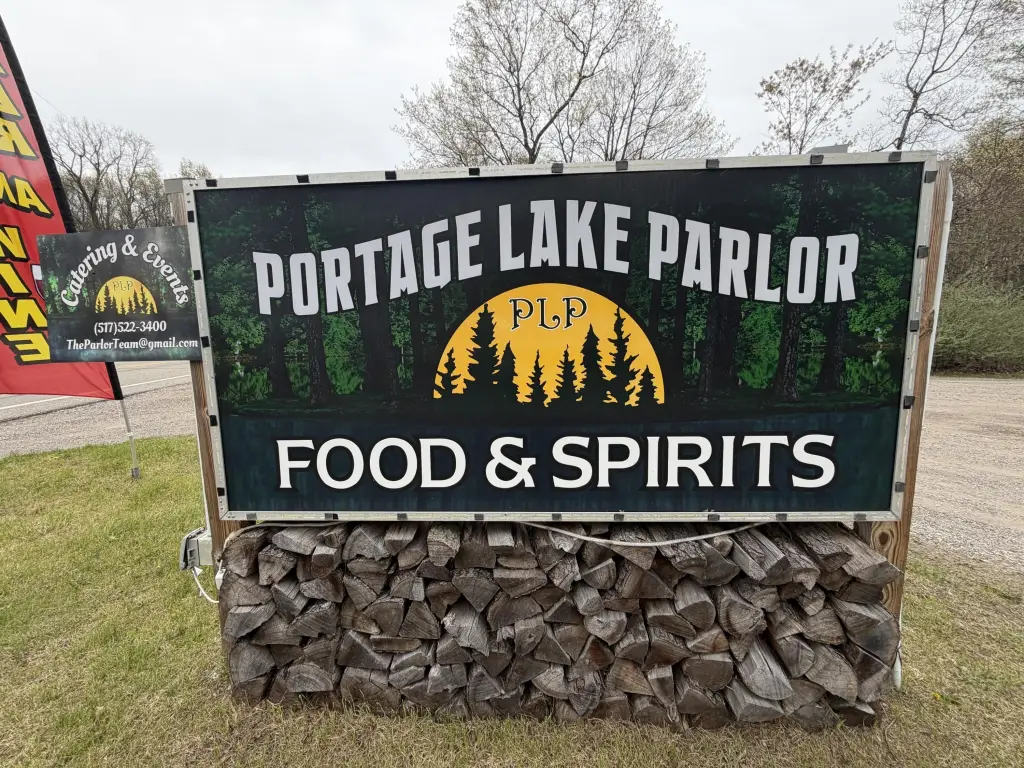
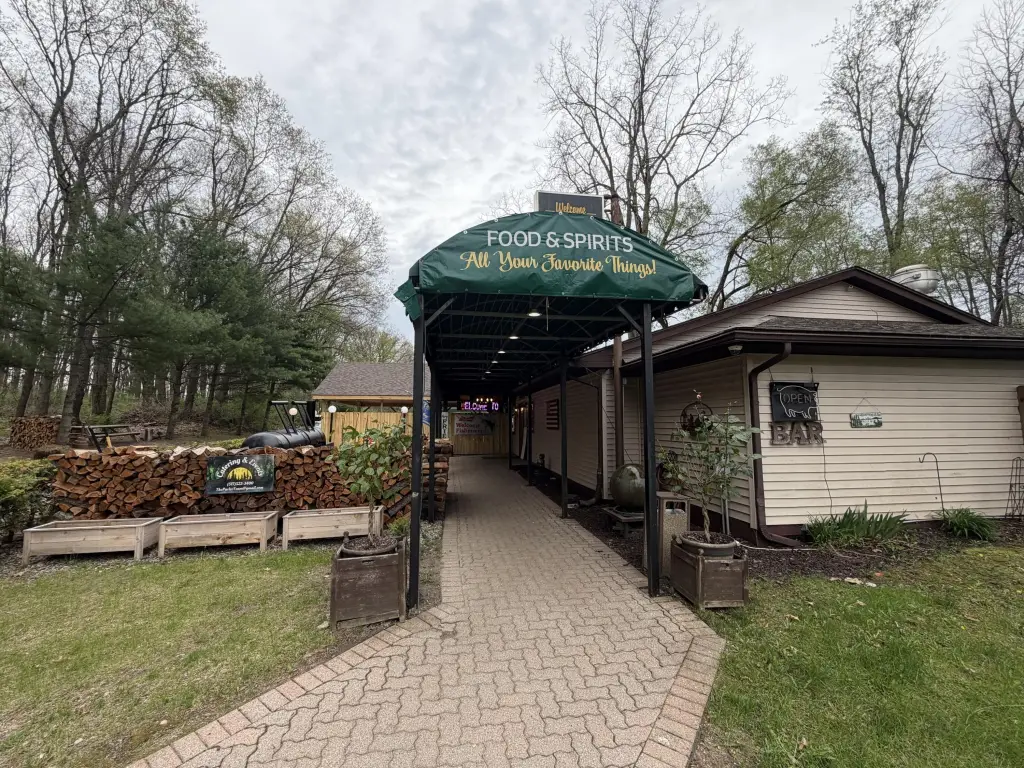
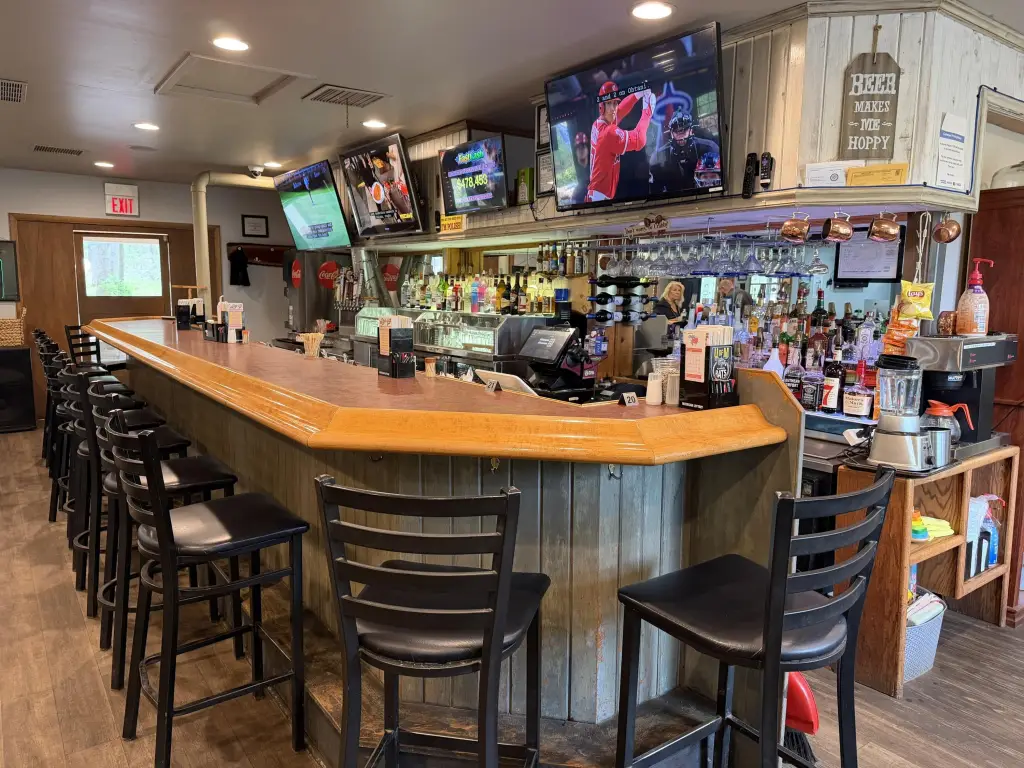
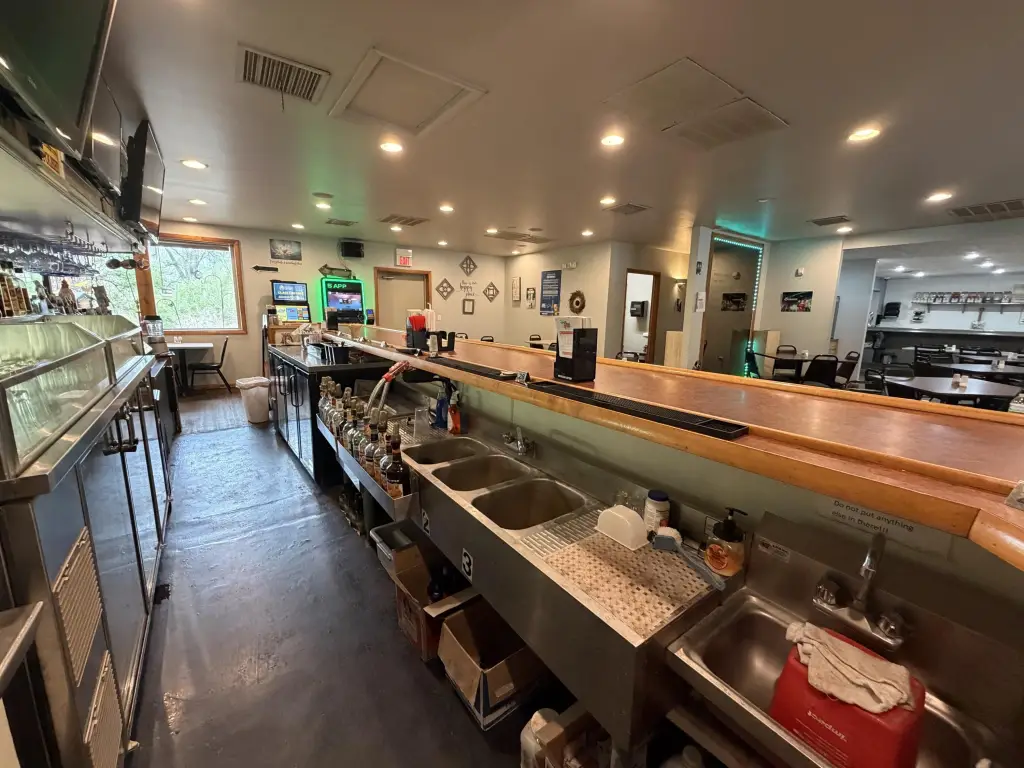
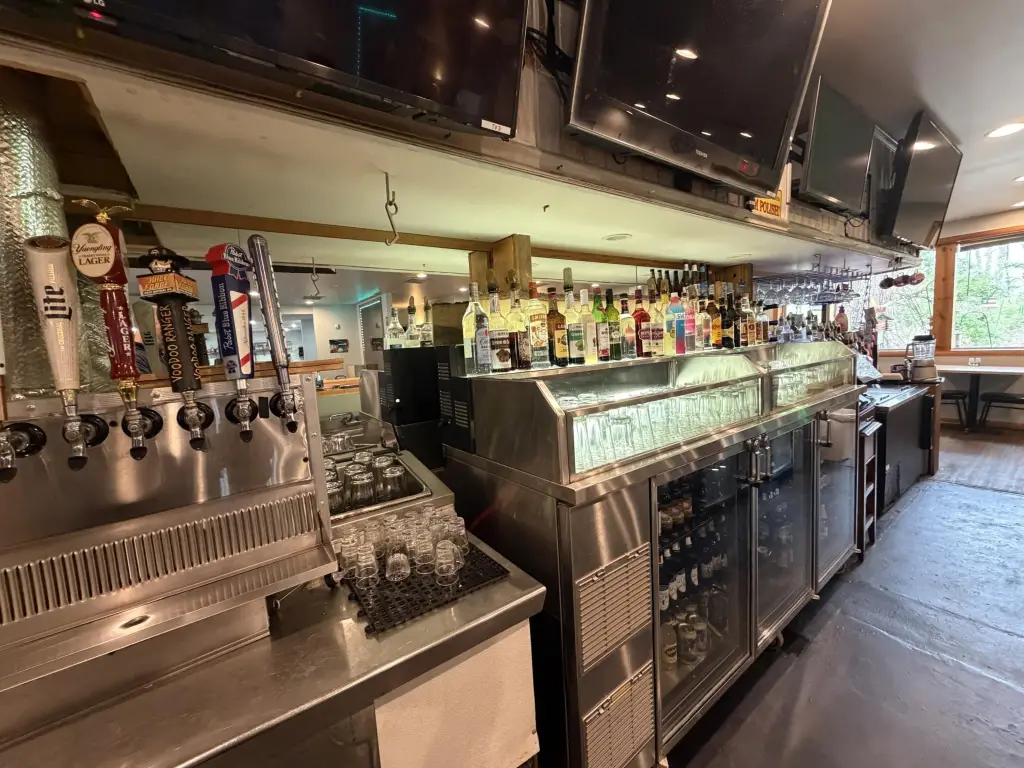
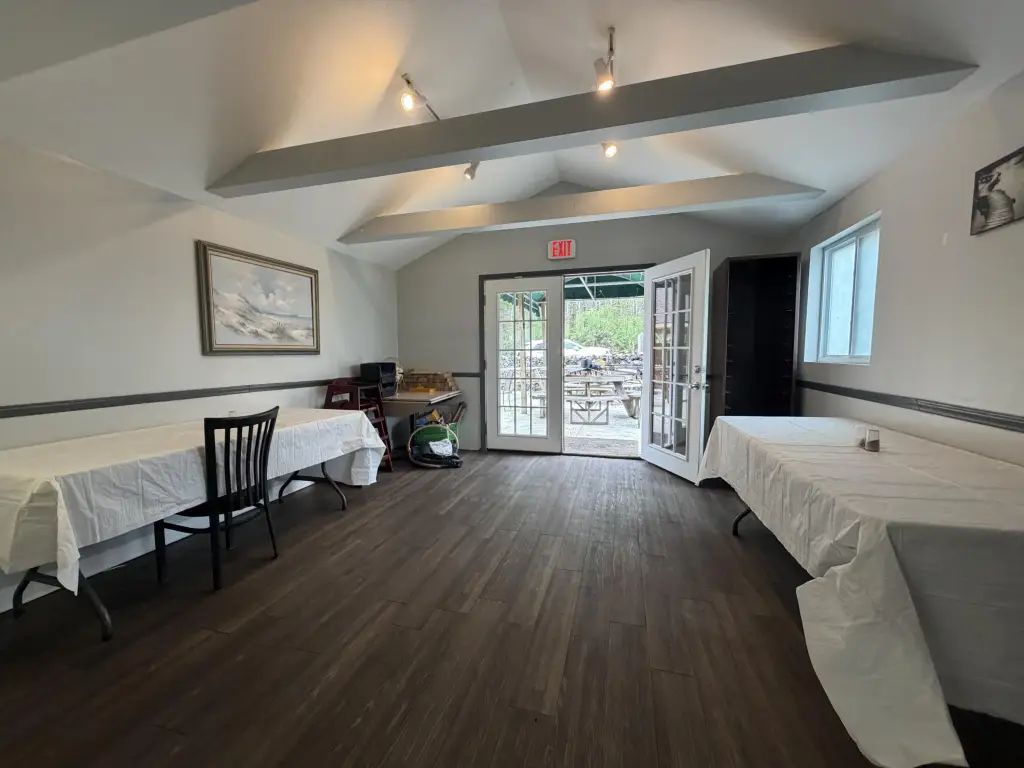
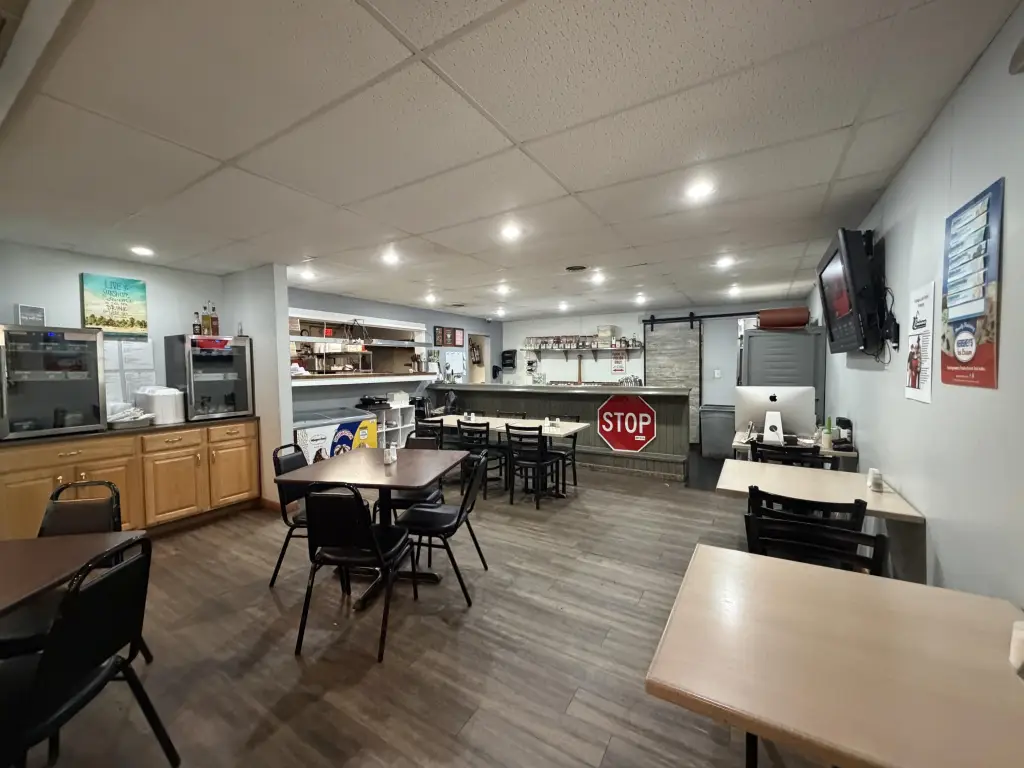
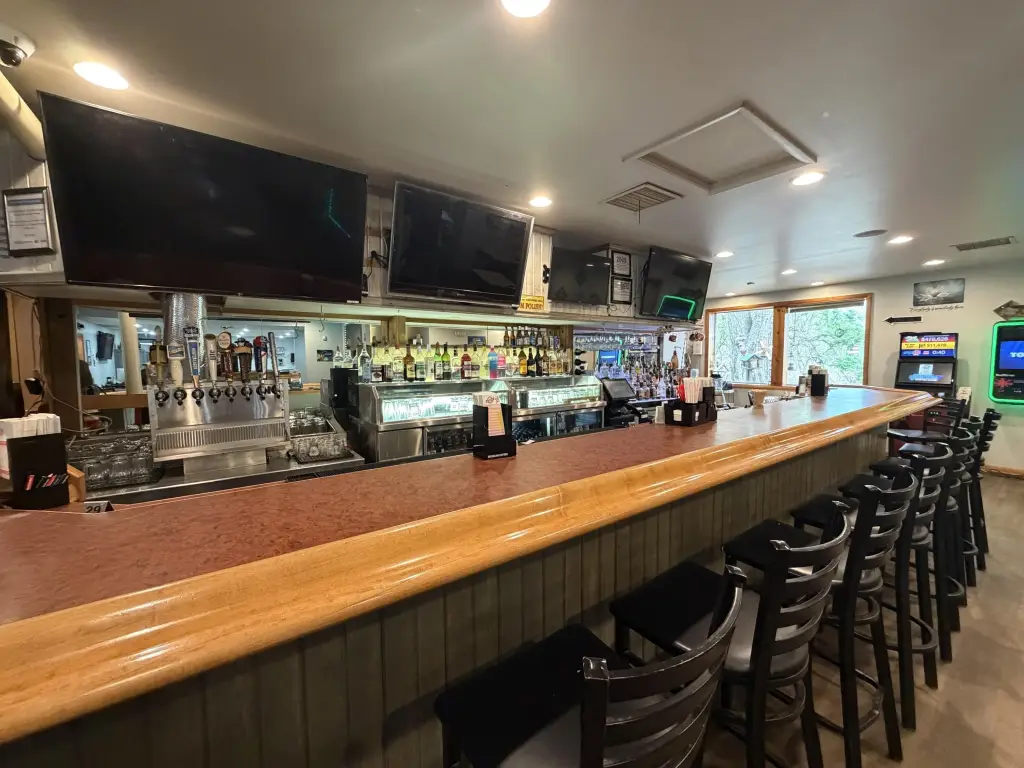
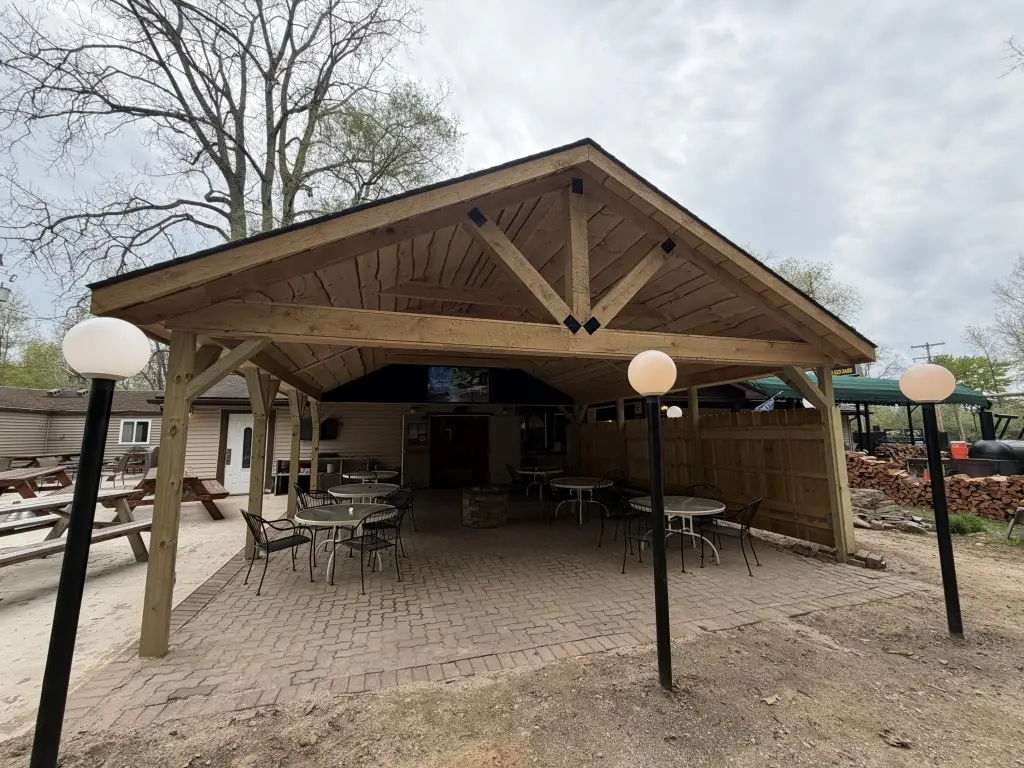
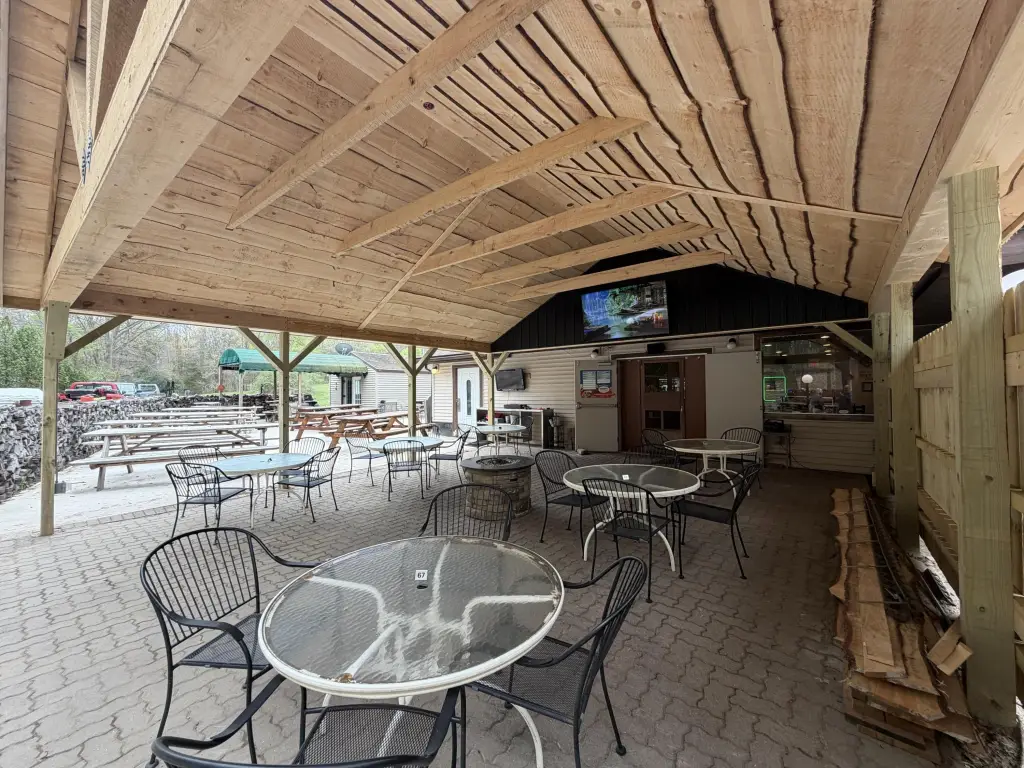
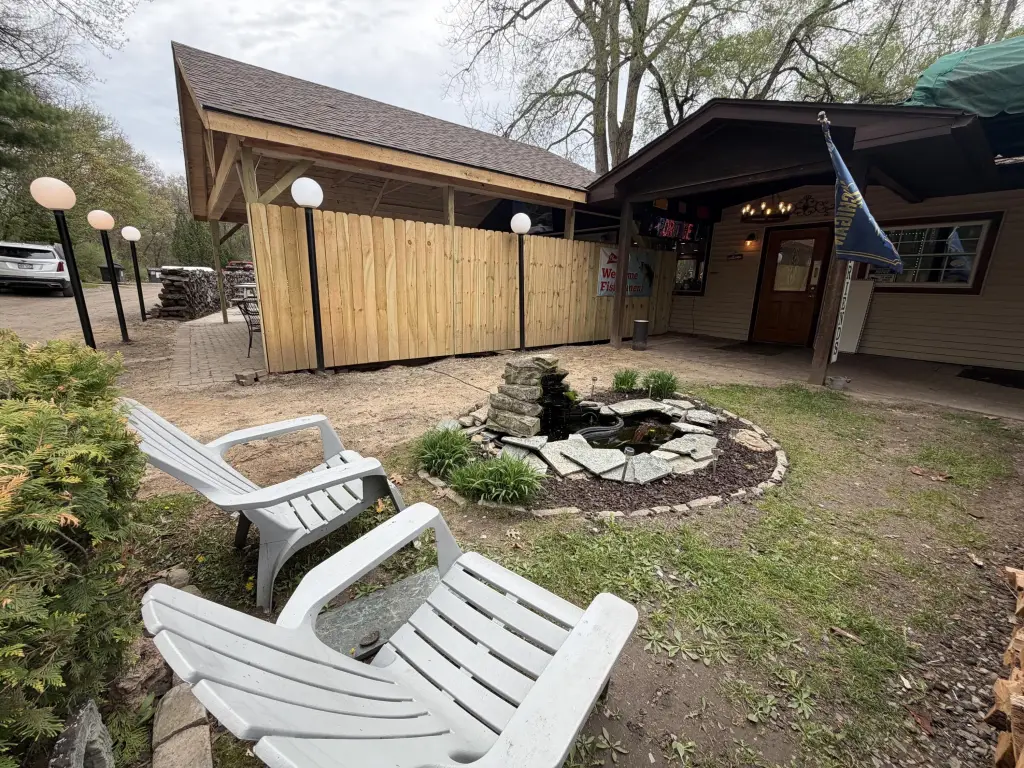
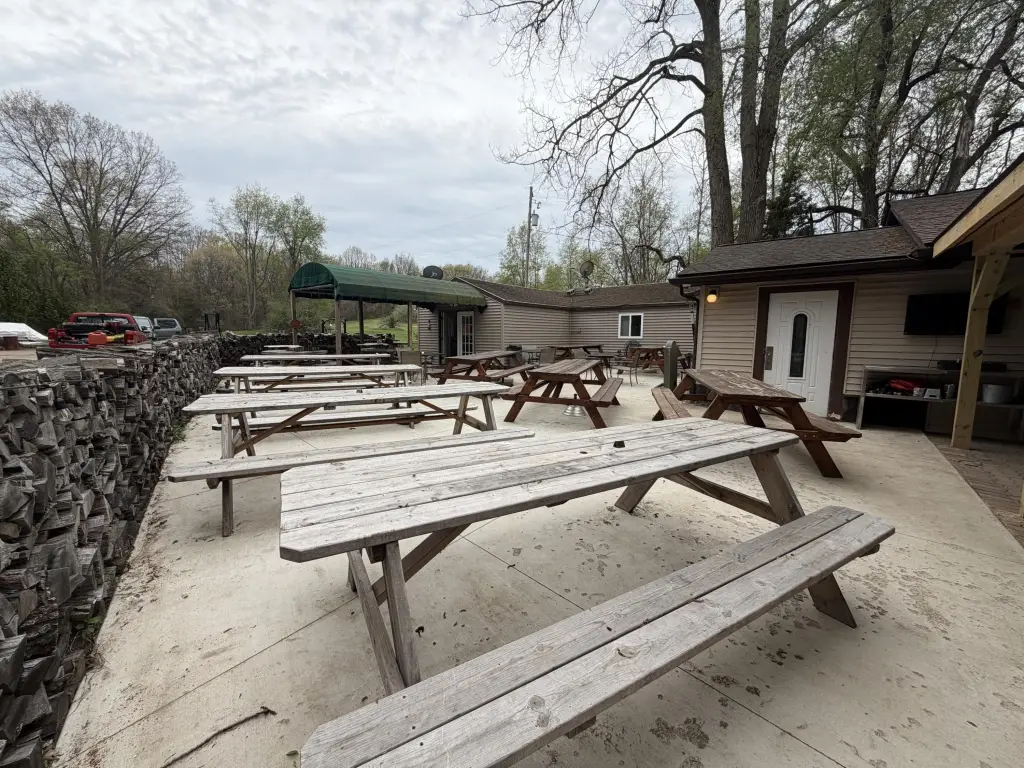
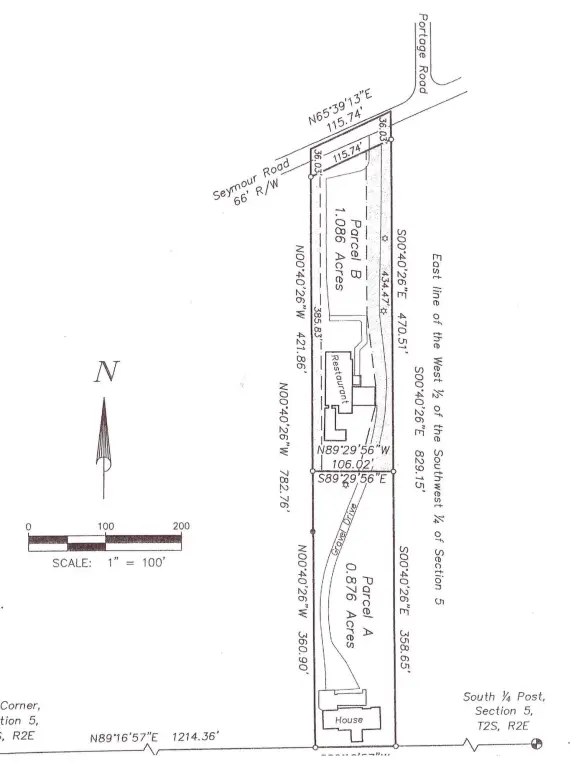
This restaurant and bar property includes a 3,414-square-foot commercial building constructed in 1993 and remodeled in 2009. The operation features an L-shaped bar, dining room, commercial kitchen, service and storage areas, POS zones, and a private game room. Exterior improvements include a covered patio pavilion, picnic seating, smoker station, landscaped grounds, decorative pond, fenced patio, and parking. The site contains 1.086 acres and is zoned C-1 for restaurant, bar, retail, and other commercial uses. Well and septic systems serve the property.
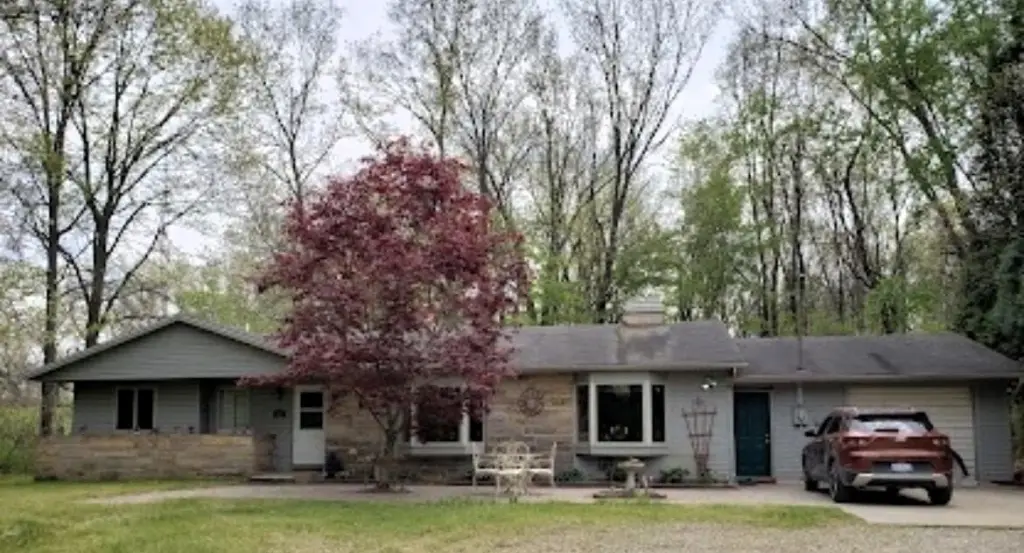
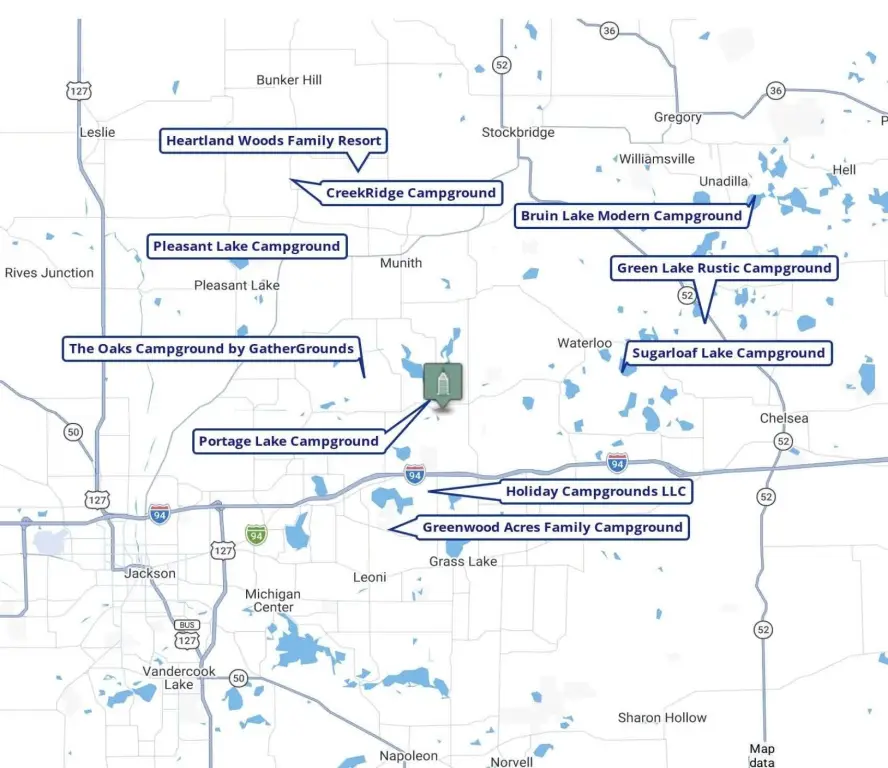
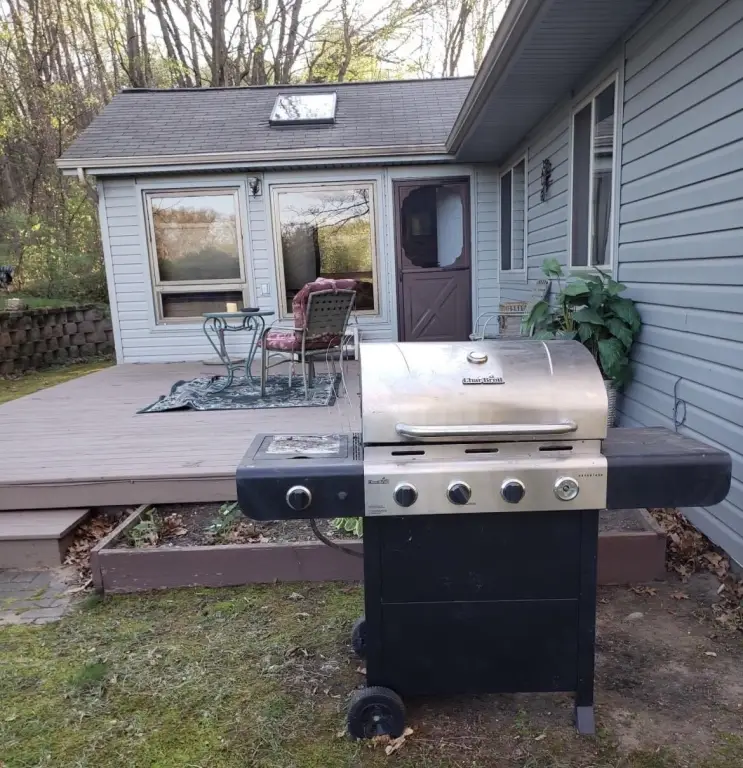
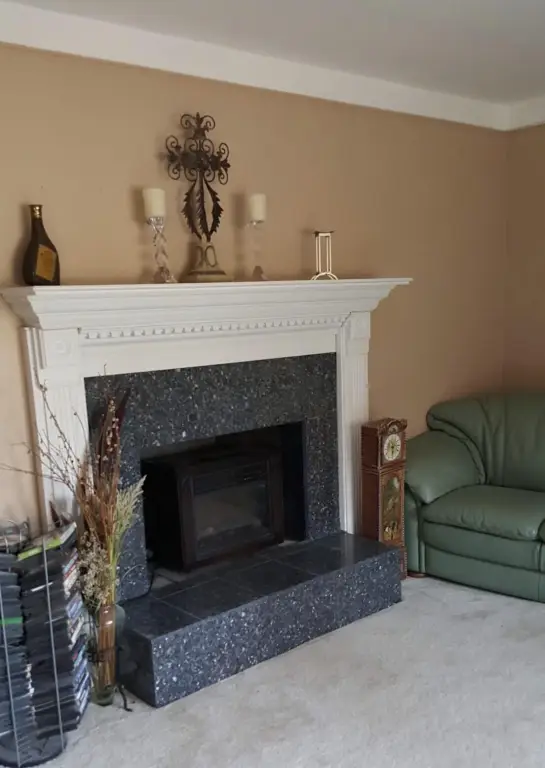
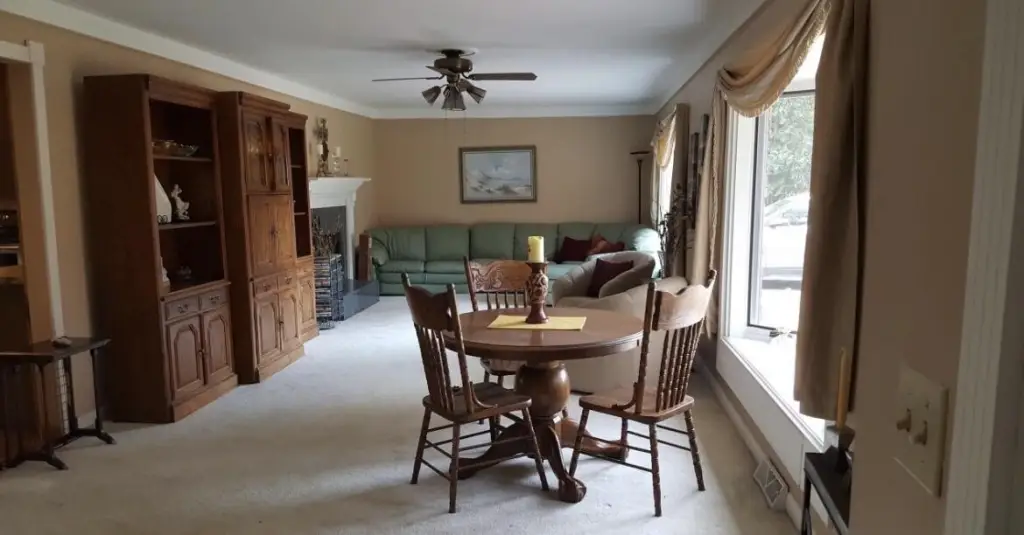
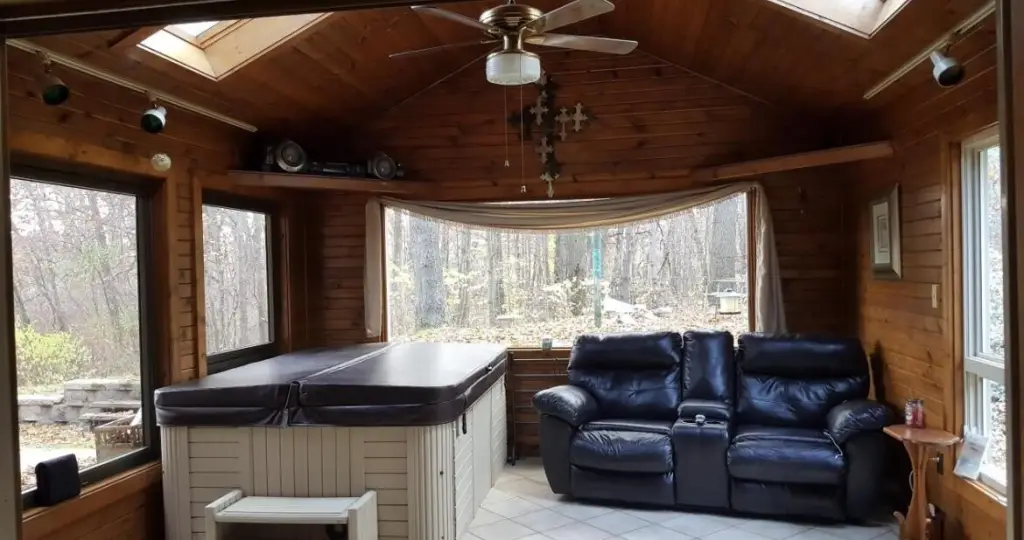
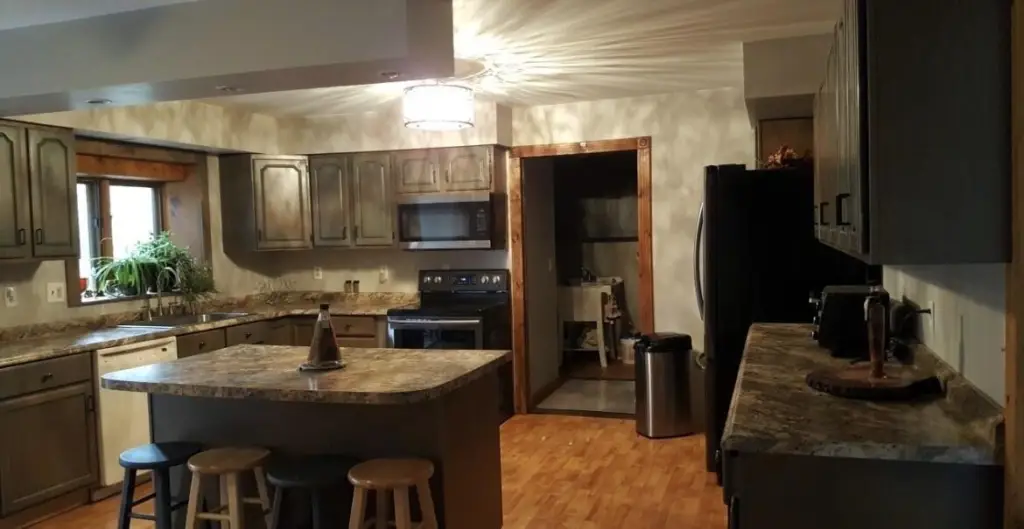
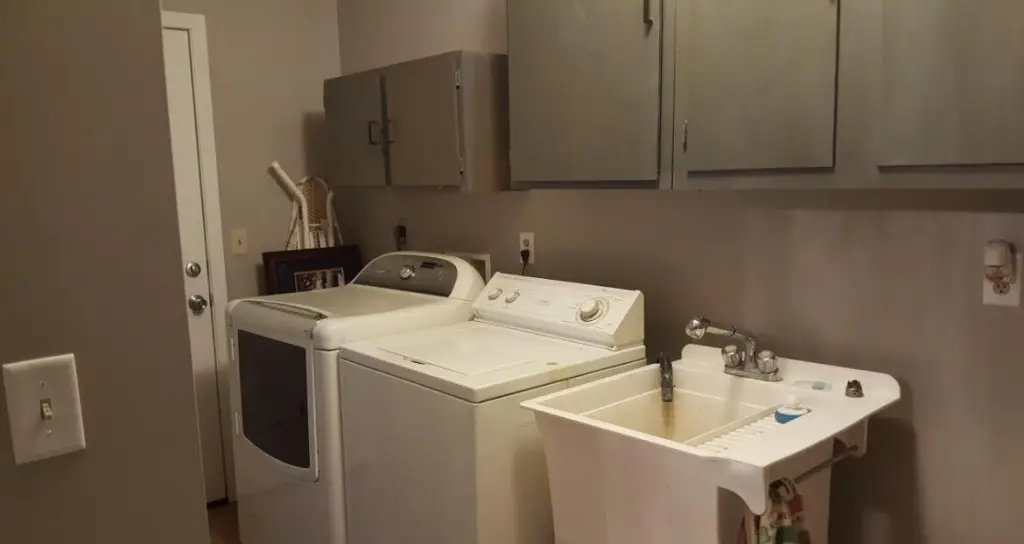
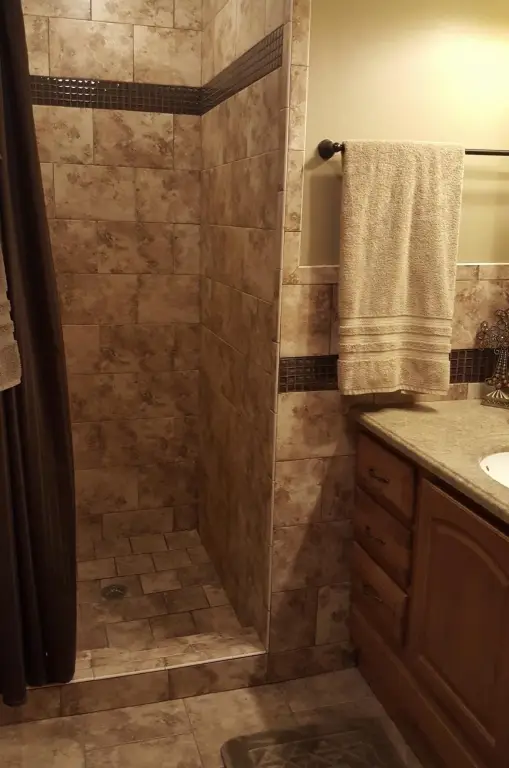
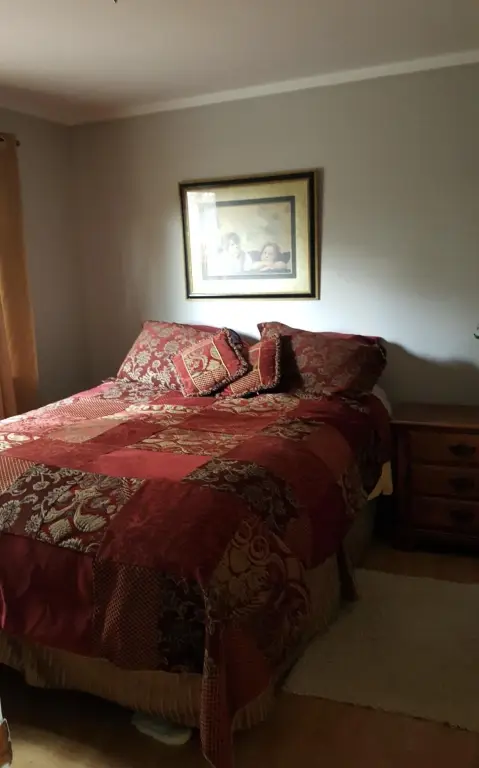
An adjacent 1,896-square-foot ranch residence, built in 1950, provides two bedrooms, 2.5 baths, a 450-square-foot basement, and a 480-square-foot attached garage. The home also includes forced heat and cooling, a deck, sunroom with hot tub, fireplace, and private driveway on a 0.876-acre lot. The property is located at 12229 Seymour Road in Grass Lake, near recreational, camping, lake, and state-land areas.
An adjacent 1,896-square-foot ranch residence, built in 1950, provides two bedrooms, 2.5 baths, a 450-square-foot basement, and a 480-square-foot attached garage. The home also includes forced heat and cooling, a deck, sunroom with hot tub, fireplace, and private driveway on a 0.876-acre lot. The property is located at 12229 Seymour Road in Grass Lake, near recreational, camping, lake, and state-land areas.
Key Highlights
- 3,414 SF restaurant/bar building built in 1993 and remodeled in 2009
- 1,896 SF adjacent ranch residence with 2 bedrooms and 2.5 baths
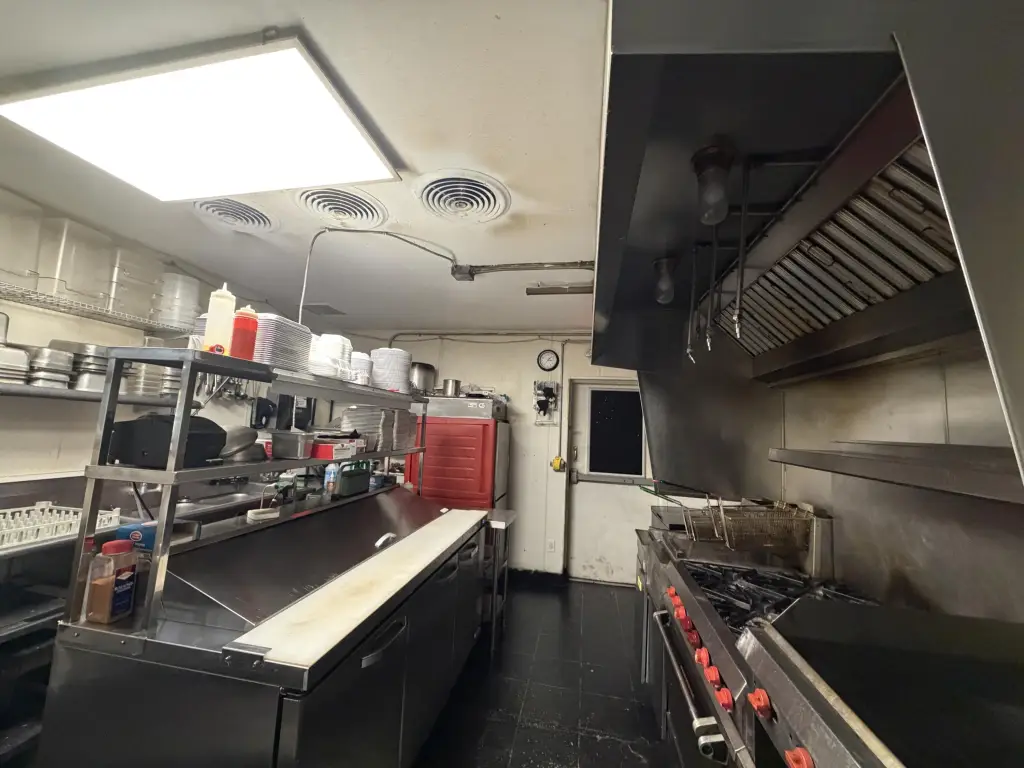
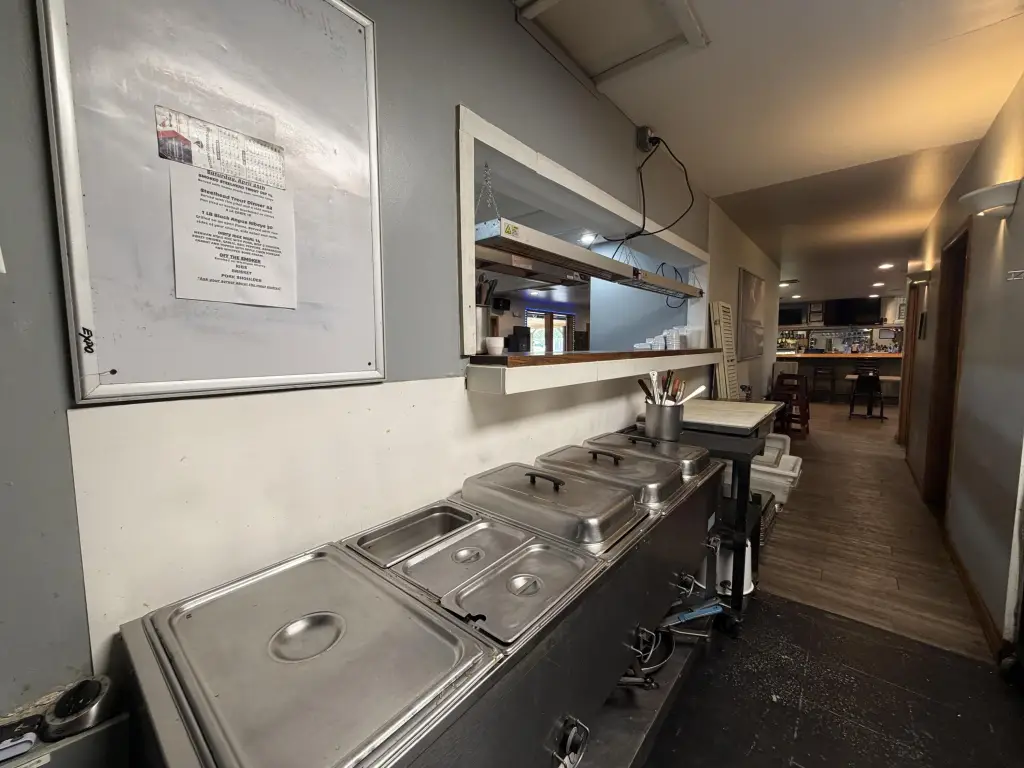
- Commercial kitchen with hood system, fryers, burners, refrigeration, and pass‑through window
Financial Insights
Estimated NOI and Cap Rate
NOI / Yr
$50,452
Cap Rate
6.73%
Suggested Prices Based on Cap Rates
Cap Rate 5%
$1,009,040
$1.0M
Cap Rate 7%
$720,743
$720.7K
Cap Rate 9%
$560,578
$560.6K
Market Conditions
NOI Build-Up for 5,310 SF
Gross rent
$73.3K $13.80/SF
− Vacancy
−$6.0K −$1.13/SF
EGI
$67.3K $12.67/SF
− OpEx
−$16.8K −$3.17/SF
NOI
$50.5K $9.50/SF
Area
Jackson County, MI
Vacancy
8.20%
Lease Rate
$13.80 /SF/Yr
Expense Ratio
25.00%
Simulate Cap Rate and NOI
Suggested Prices Based on Cap Rates
Cap Rate 5%
$1,009,040
Cap Rate 7%
$720,743
Cap Rate 9%
$560,578
Alternative Uses
Best Use
Specialty Retail
$720.7K
$630.7K – $840.9K
NOI $50,452 @ 7.0% cap · market cap 6.73%
Second Best
Mixed Use
$628.7K
$550.1K – $733.5K
NOI $44,007 @ 7.0% cap · market cap 5.87%
Theoretical Best
Office A
$847.7K
$741.7K – $988.9K
NOI $59,336 @ 7.0% cap · market cap 7.91%
Zoning and permitted uses should be independently verified with authorities.
Property Analytics
Unlock full access to Insights
Subscribe to Realmo Intelligence
Open Analytics
Current Use
Lease Details
Yes
Commercial hood
Location Intelligence
Trade Area within ½ mile
9
Businesses Nearby
Well-served
Demand for This Use
Explore this area
Business Placement
Demographics for 49240, MI
9,213
Population
4,050
Households
2.3
Avg Household Size
45
Median Age
33%
College-Educated
97%
High-School Grad
104.1 sq mi
ZIP Area
89
Density / Sq Mi
$95,307
Median Household Income
$49,705
Median Earnings
$1,178
Median Rent
$272,300
Median Home Value
Check the figures for this property
Cap Rate, Value Estimation, Potential NOI and more
View Realmo Analytics
Market
Vacancy Rate% for Retail in Midwest region

Questions? Ask Rey
Realmo’s AI knows this listing — price, zoning, demand, history. Ask anything.


Frequently Asked Questions
What type of property is this?
Conventional restaurant - Operating restaurant and bar with commercial kitchen, indoor and outdoor seating, and a neighboring ranch home.
Where is this conventional restaurant located?
The property is located at 12229 Seymour Road Grass Lake, MI.
What is the asking price?
The asking price for this property is $750,000.
What are key features of this property?
This property features: 3,414 SF restaurant/bar building built in 1993 and remodeled in 2009; 1,896 SF adjacent ranch residence with 2 bedrooms and 2.5 baths; Commercial kitchen with hood system, fryers, burners, refrigeration, and pass‑through window


