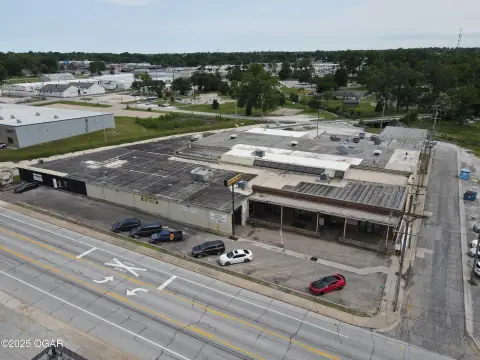
Freestanding Flex Space with Loading
For Sale
$225,000
Pending
1220 E 15th Street, Joplin, MO 64804
Commercial Sale, Joplin, MO
Property Size2,960 SF
Lot Size0.32 Acres
Days on Market78
Property Features for 1220 E 15th Street
General Information
Property type
Commercial Sale
Property subtype
Other
Bathrooms
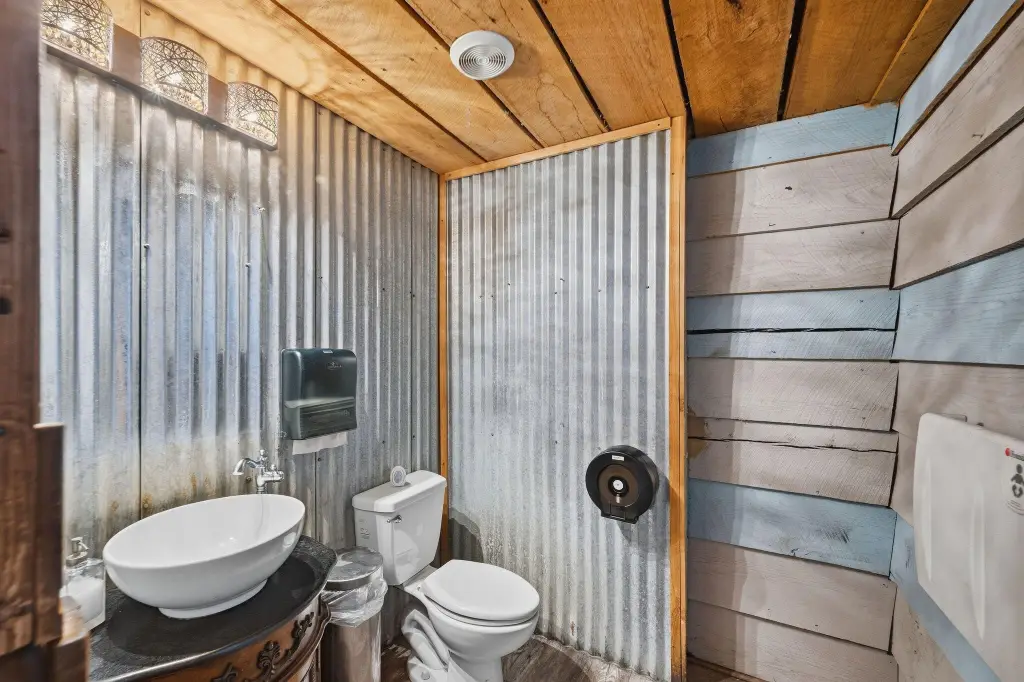
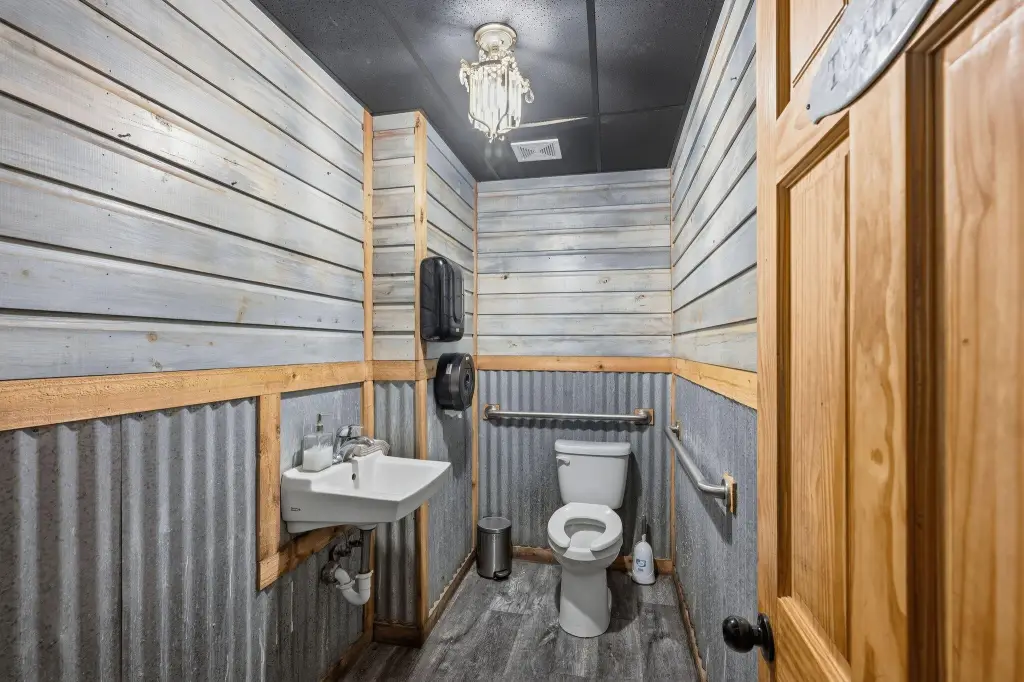
2
Full bathrooms
2
Rooms
Bathroom 1, Bathroom 2
Directions
from main st (43 HWY) and 15th st. go east on 15th st. 11 blocks or from Rangeline rd and 15th st. go west on 15th 11 blocks to property.
Standard status
Pending
APN
19-1.0-11-40-17-1.001
Lot size
0.32 Acres
Taxes and HOA fees
Tax Year
2024
Tax Description
Banker's 2nd E 93' Lot 1
Tax Annual Amount
1674
Legal Description
Banker's 2nd E 93' Lot 1
Utilities
Utilities
Water Available
Heating system
Electric (Heating)
Cooling system
Central Air
Building Details
Year built
1950
Roof type
Asphalt
Listing Agency:
Venture Group Real Estate
Listed By:
Venture Group Real Estate Team · License #2019046822
(417) 621-1883
Added: Jul 27
Changed: Sep 17
Last Checked: Oct 12 at 3:06PM
MLS# 60329929
Copyright © 2026 Southern Missouri Regional MLS, LLC (SOMO). All rights reserved. All information provided by the listing agent/broker is deemed reliable but is not guaranteed and should be independently verified.
Investment Insights
Based on property information with market context.
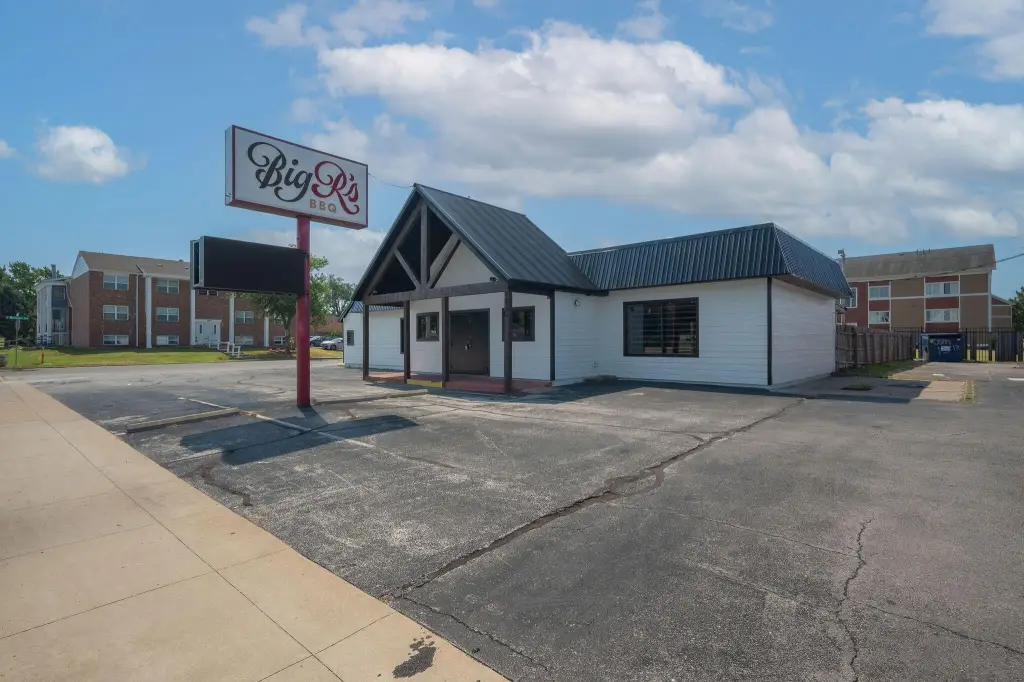
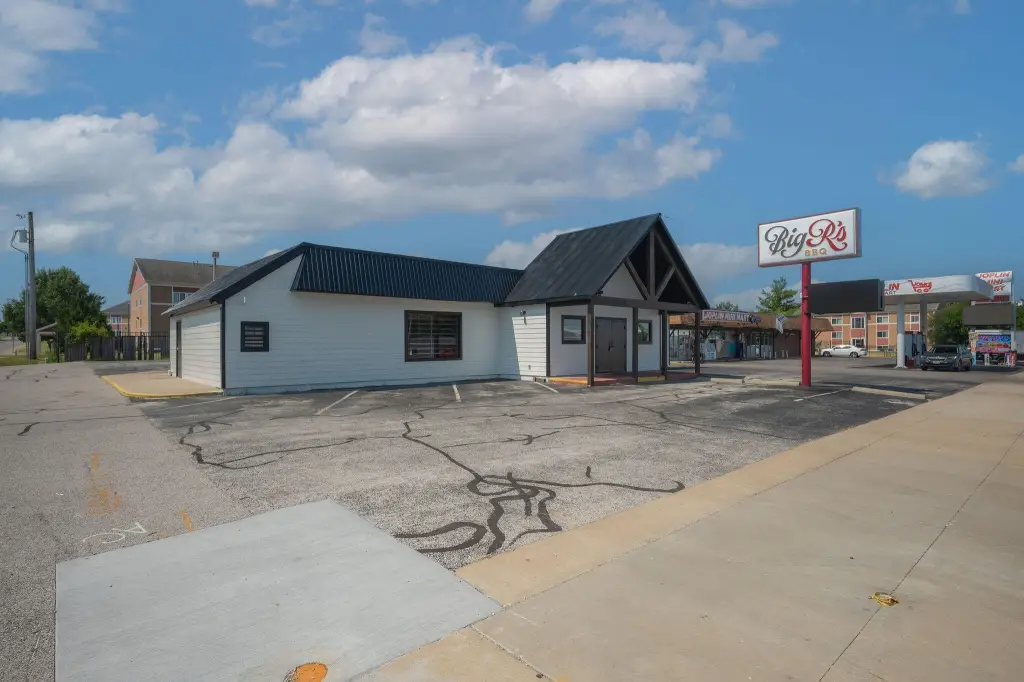
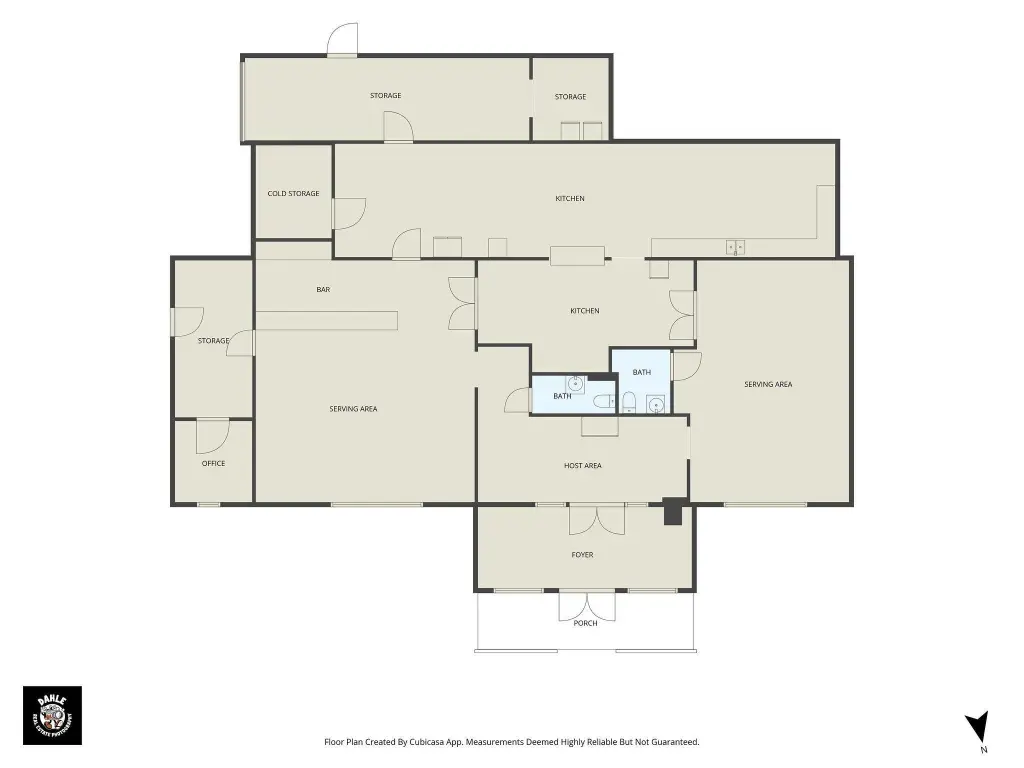
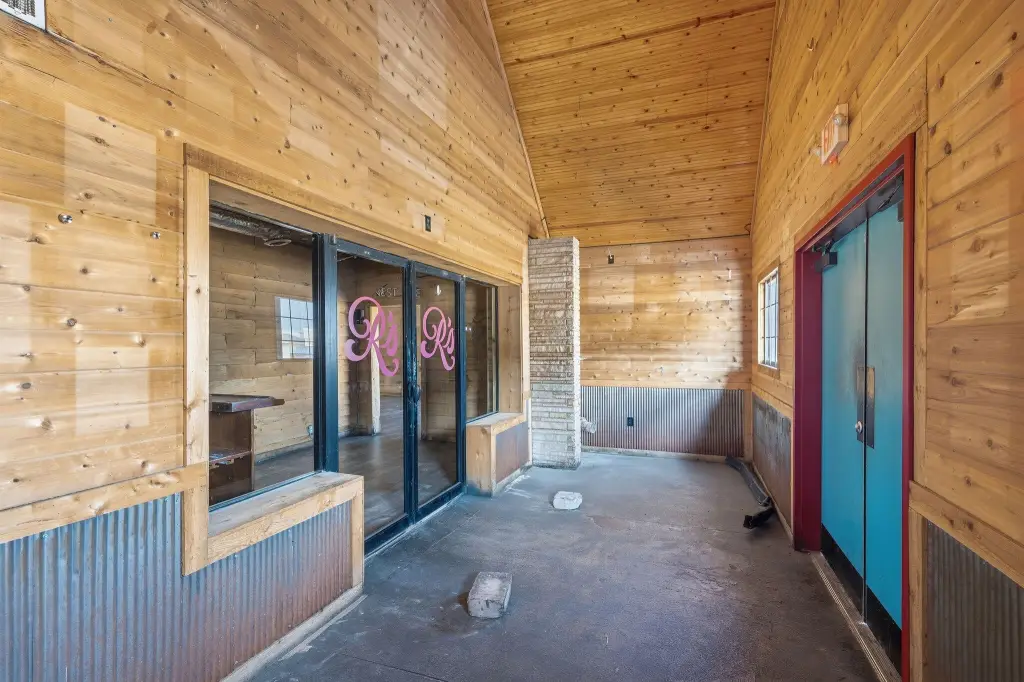
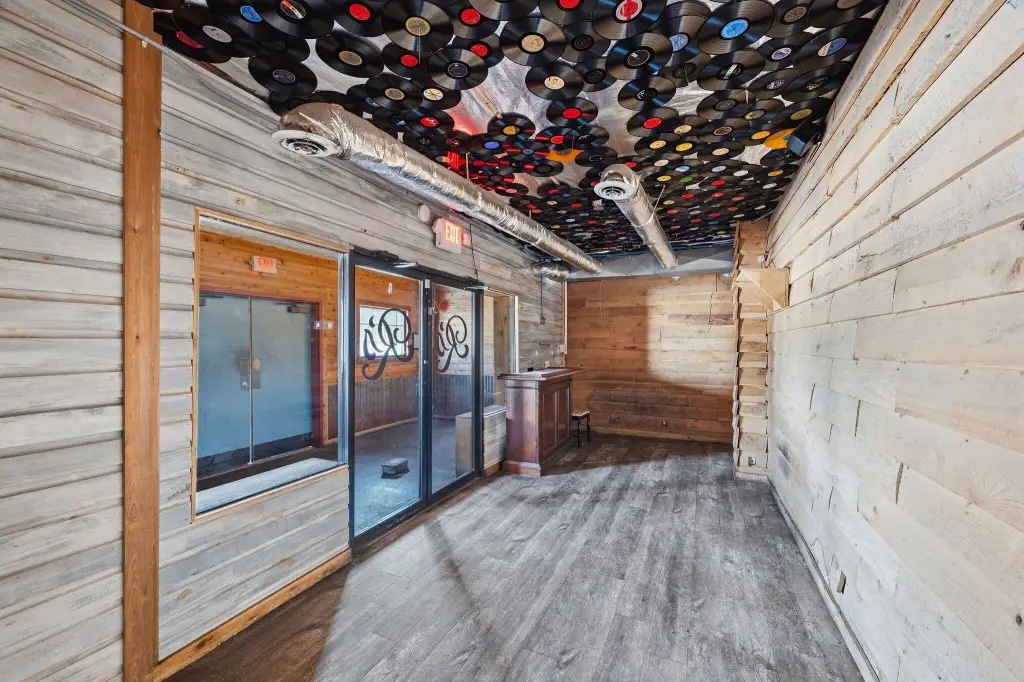
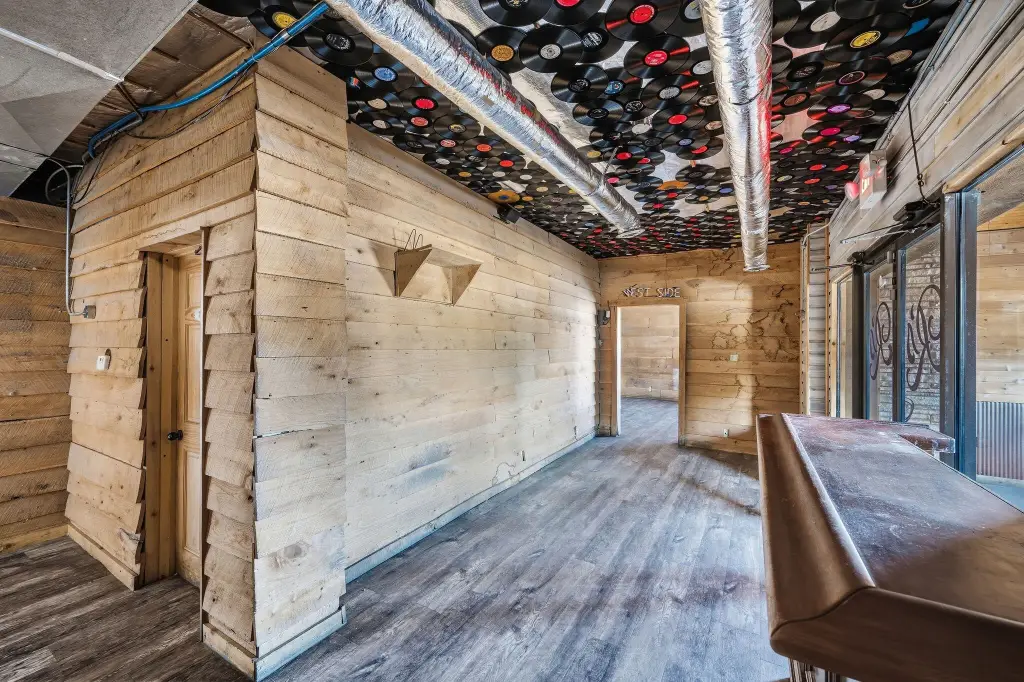
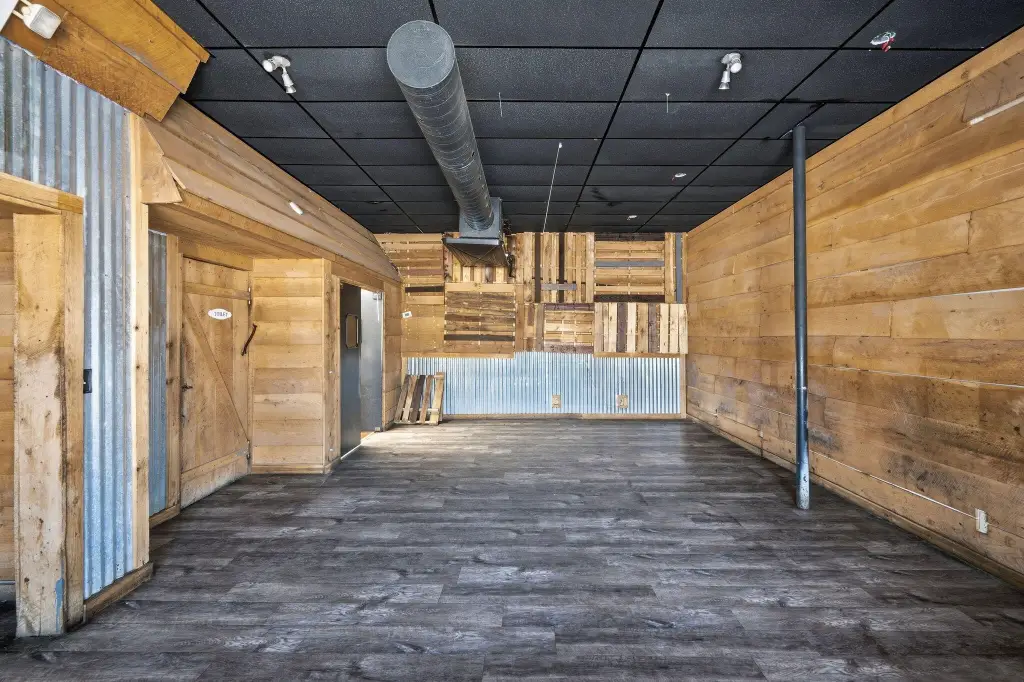
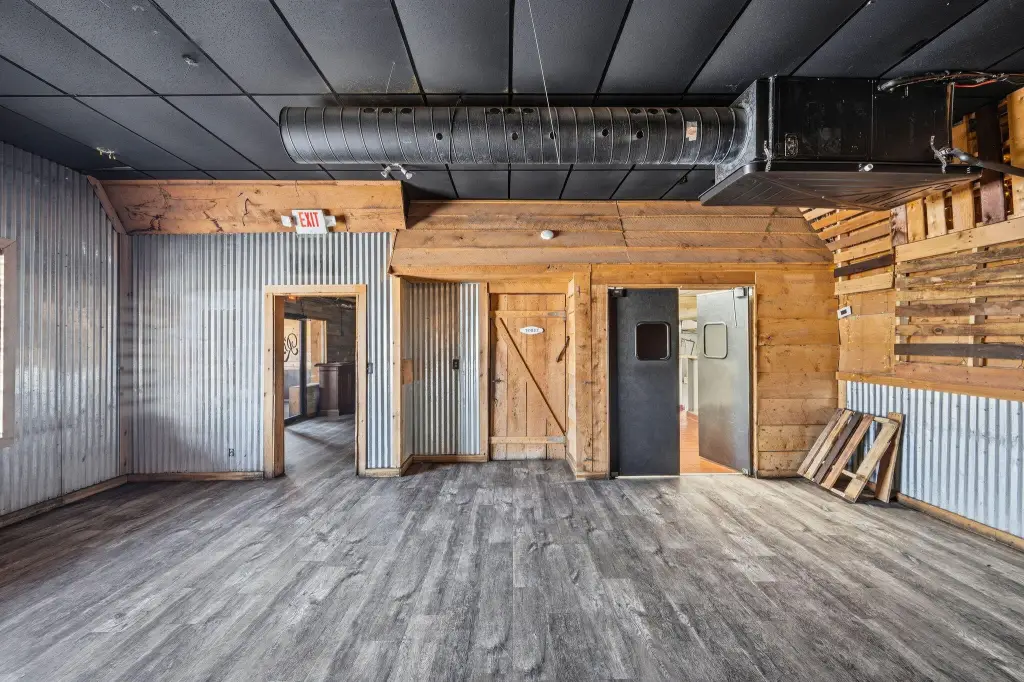
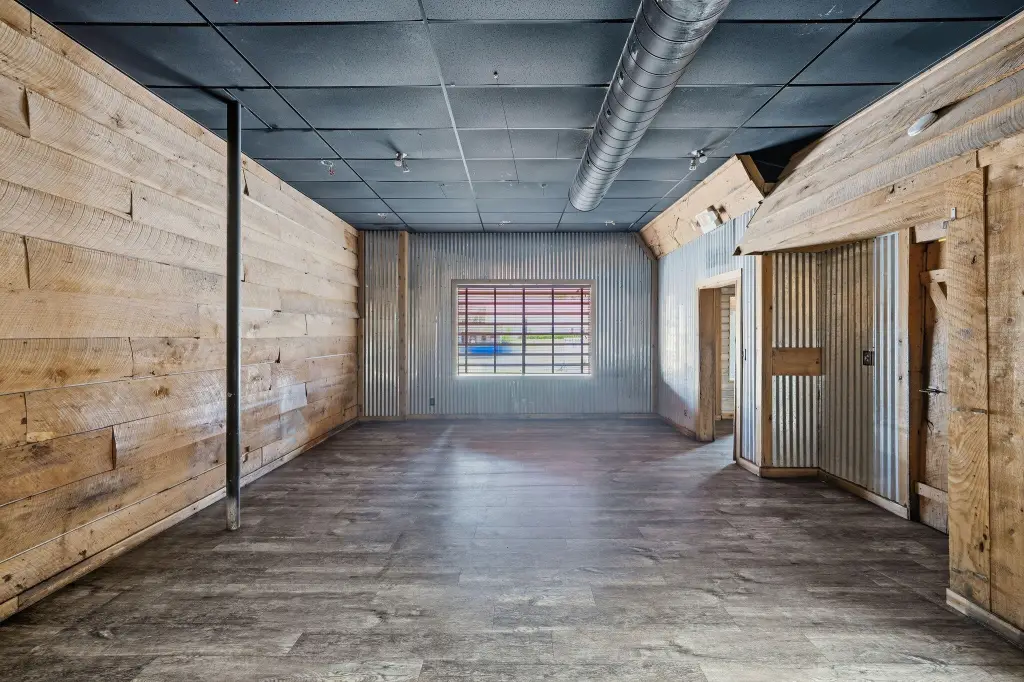
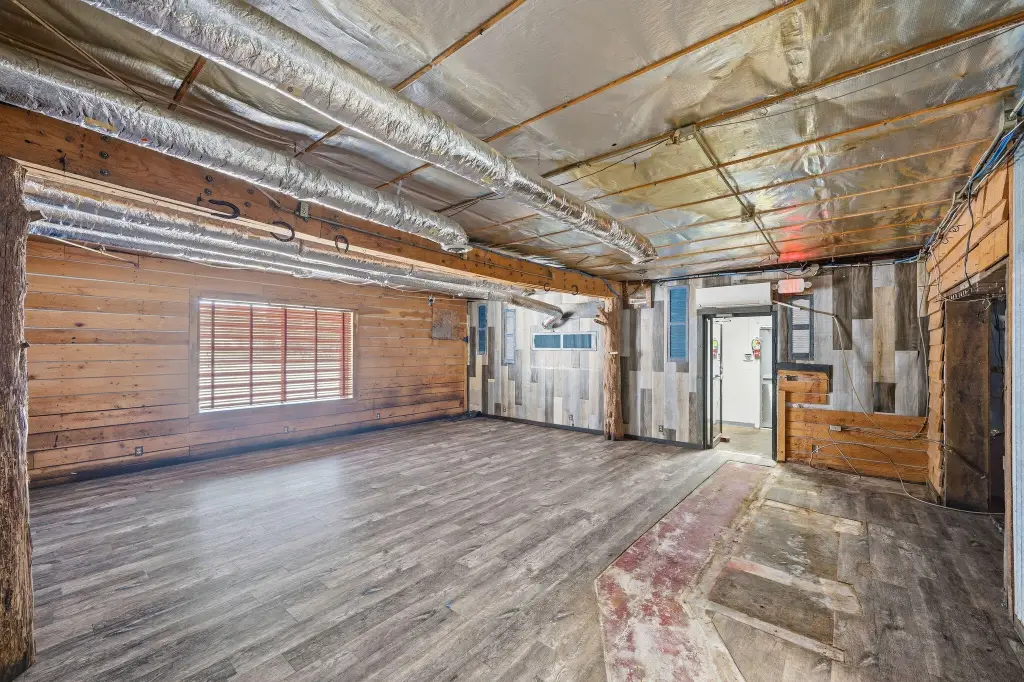
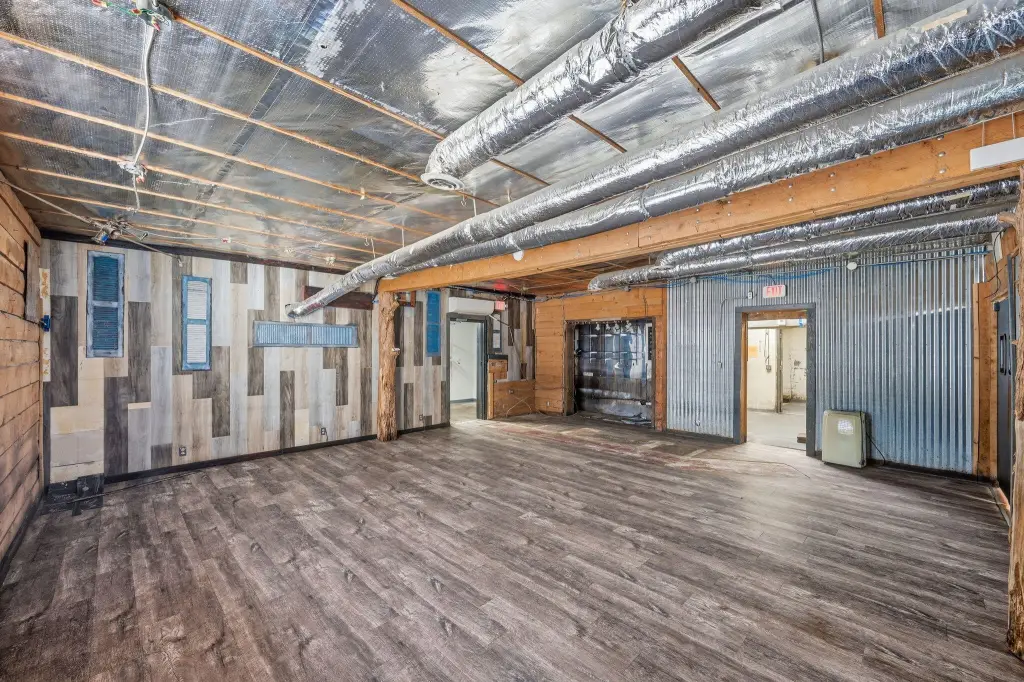
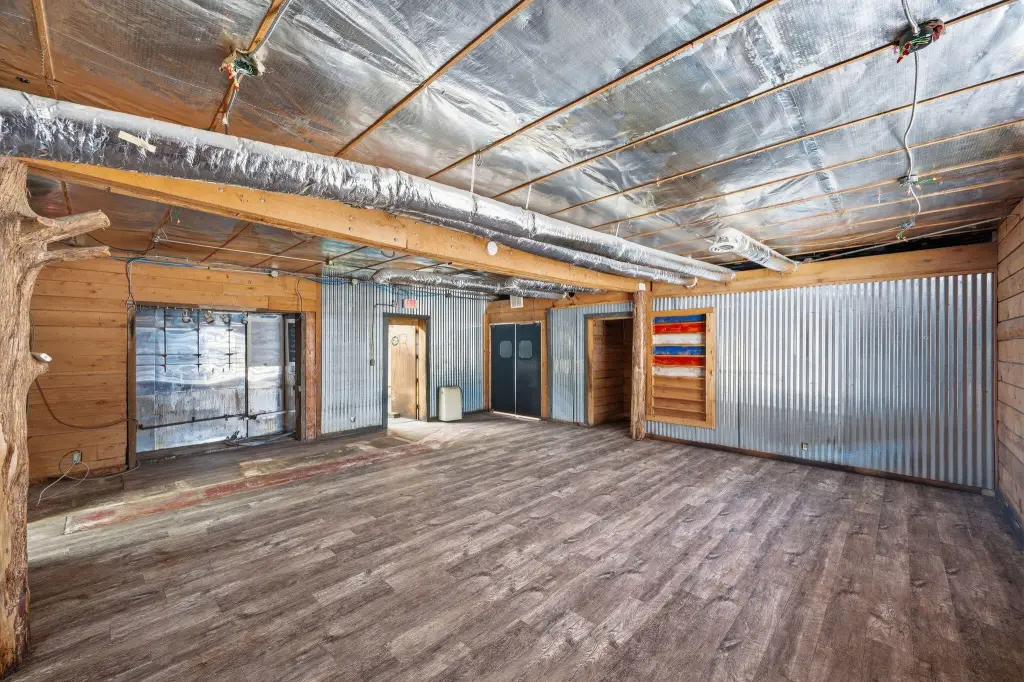
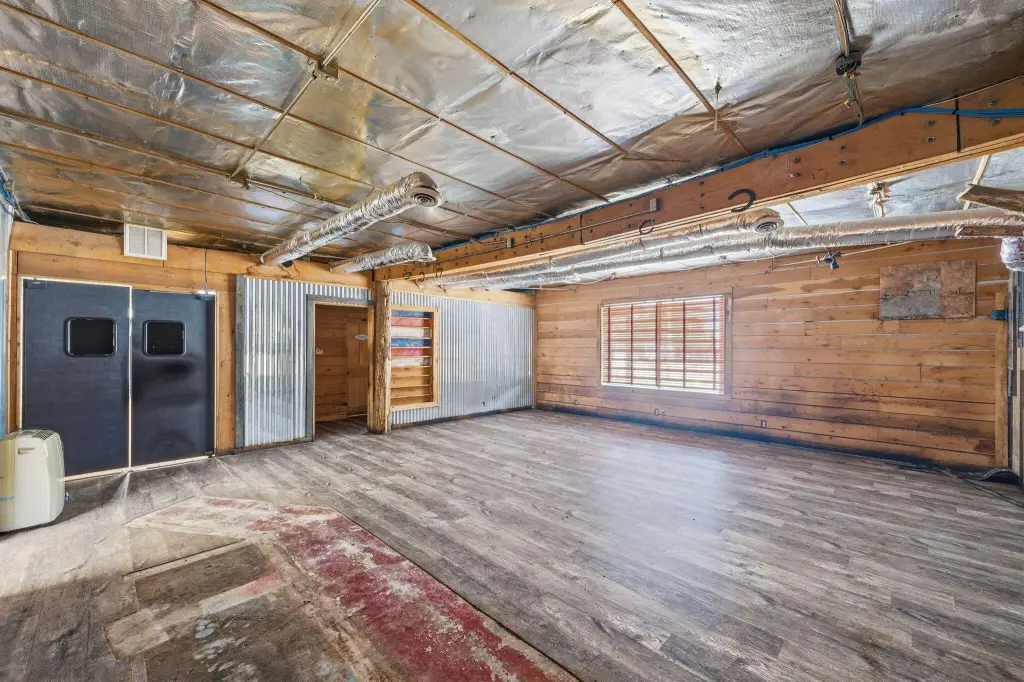
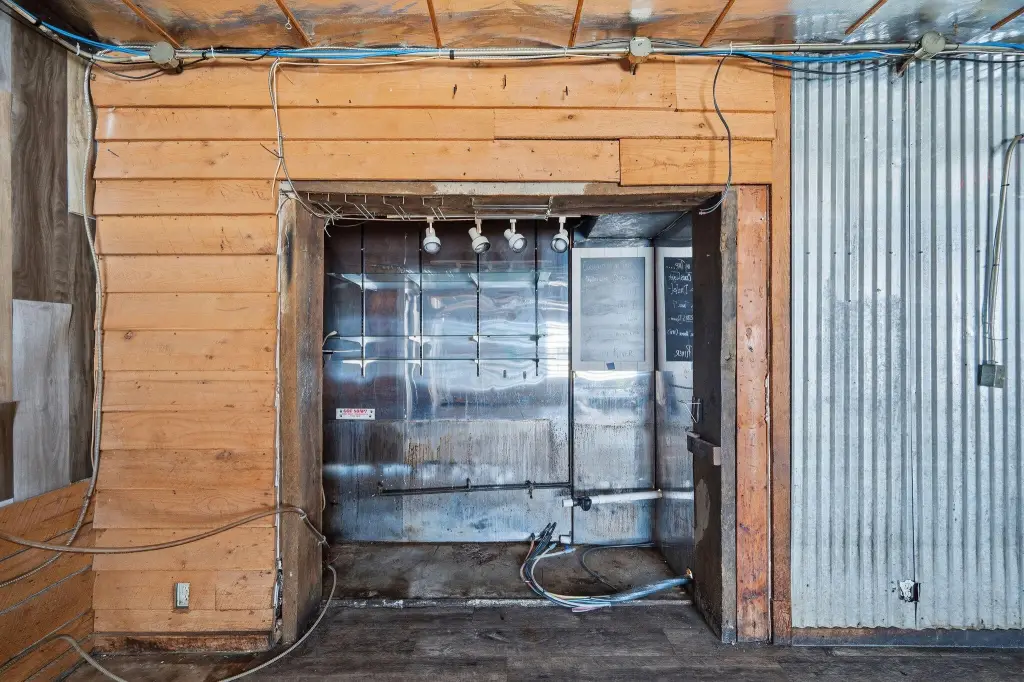
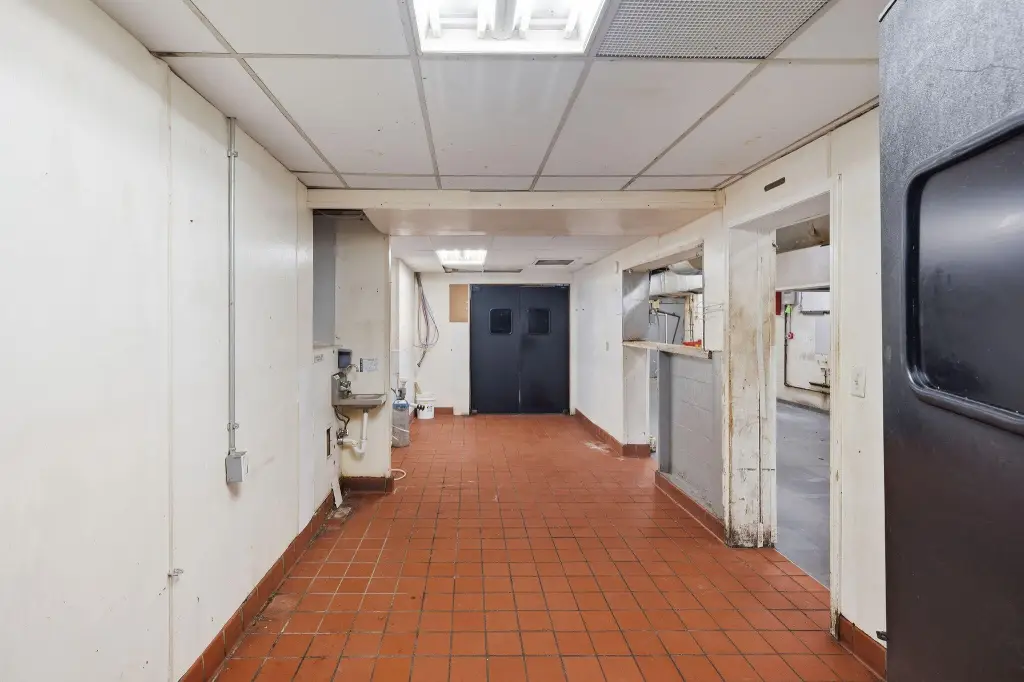
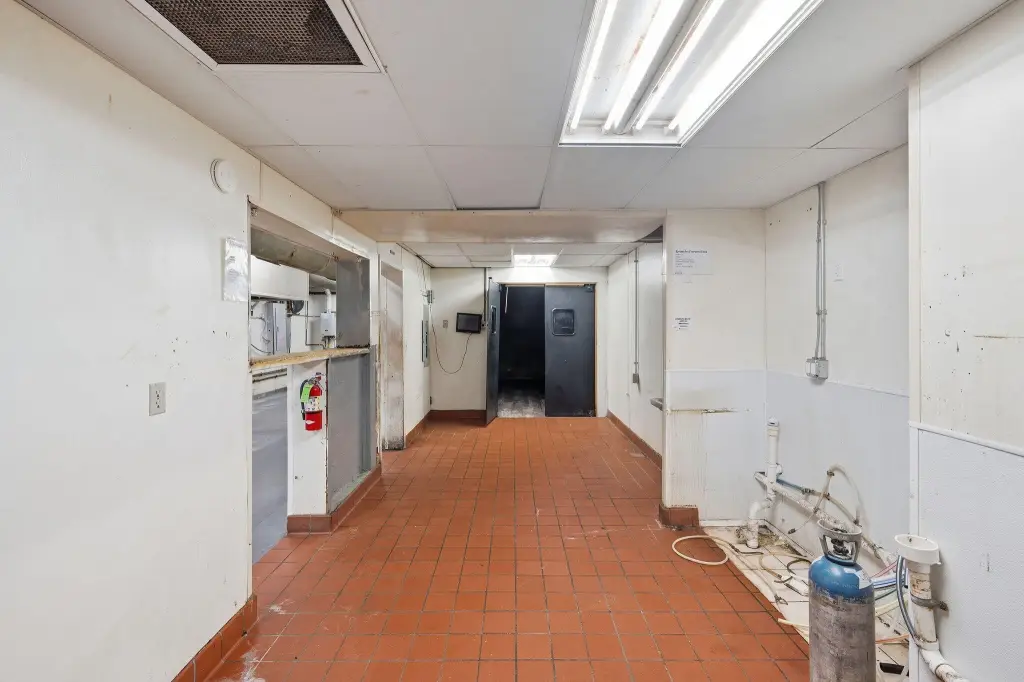
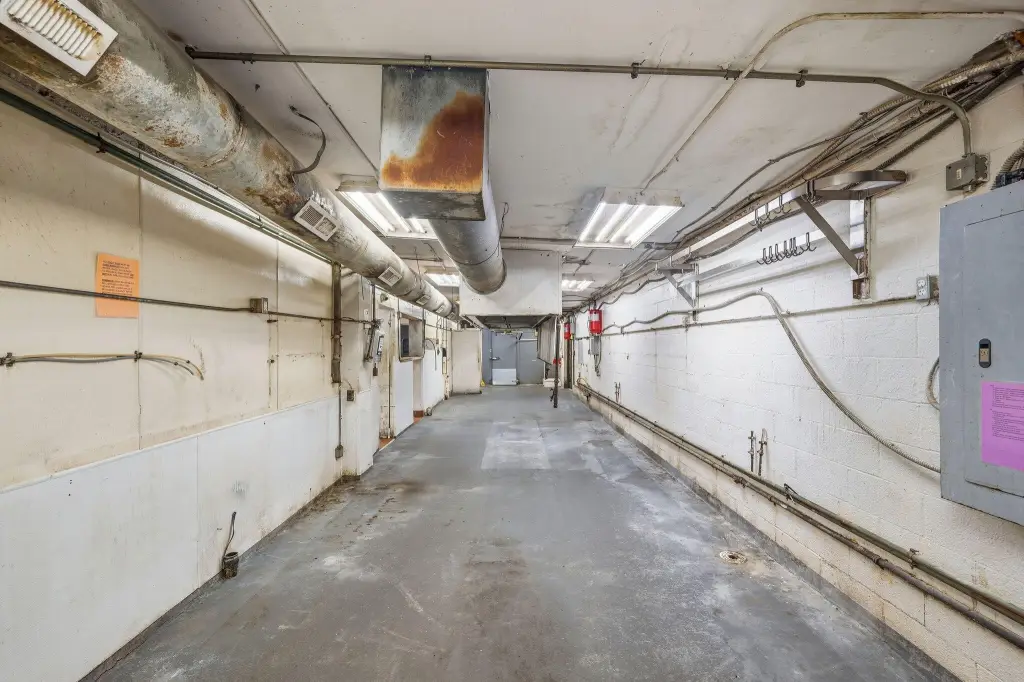
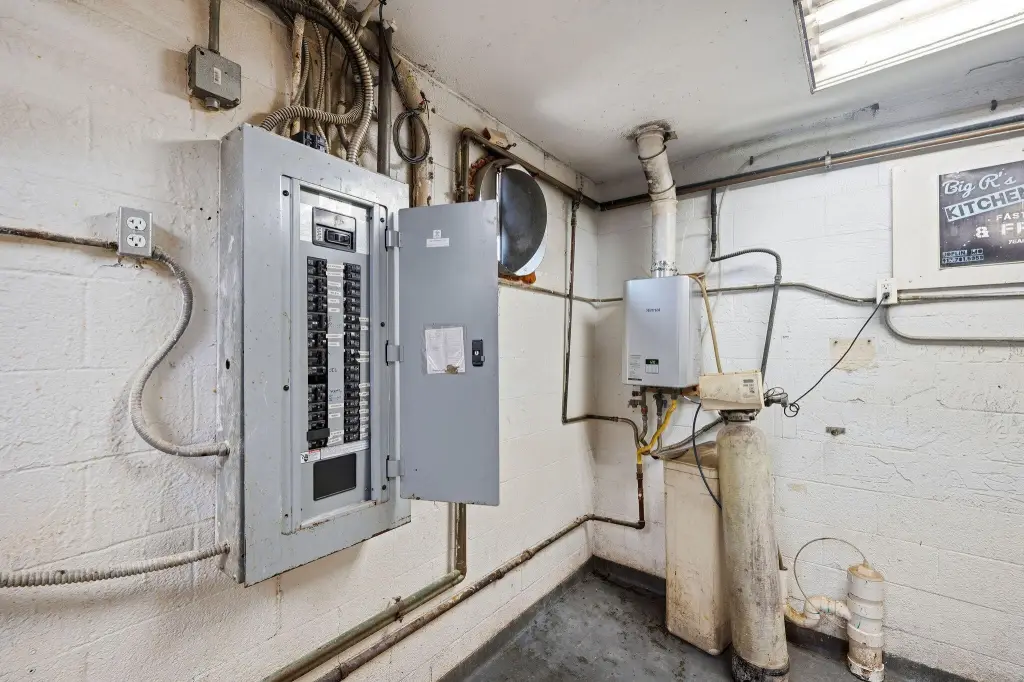
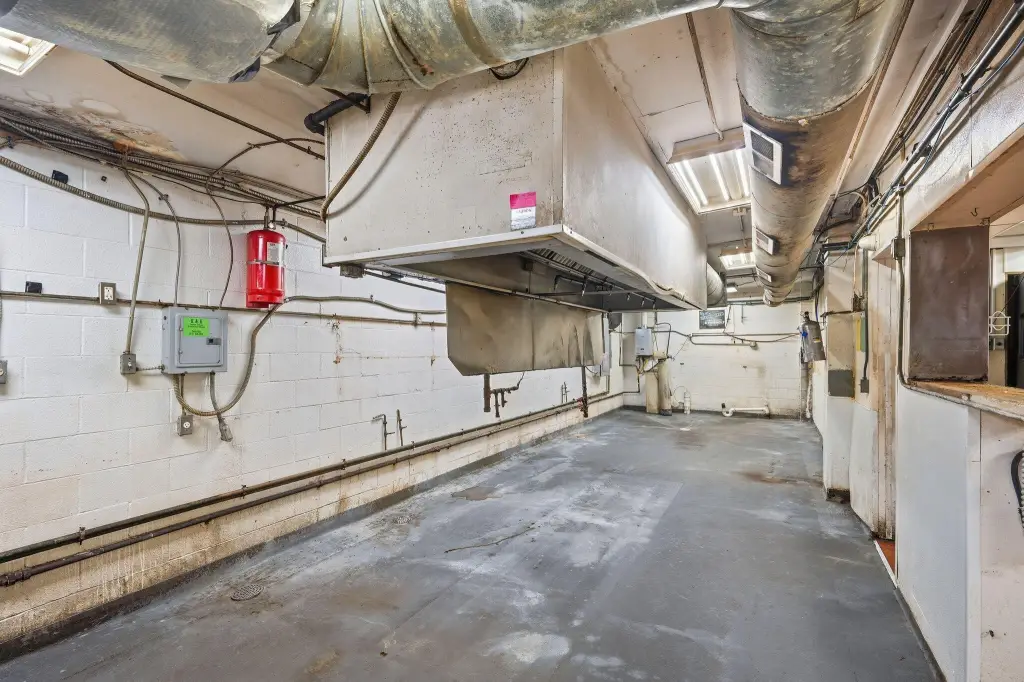
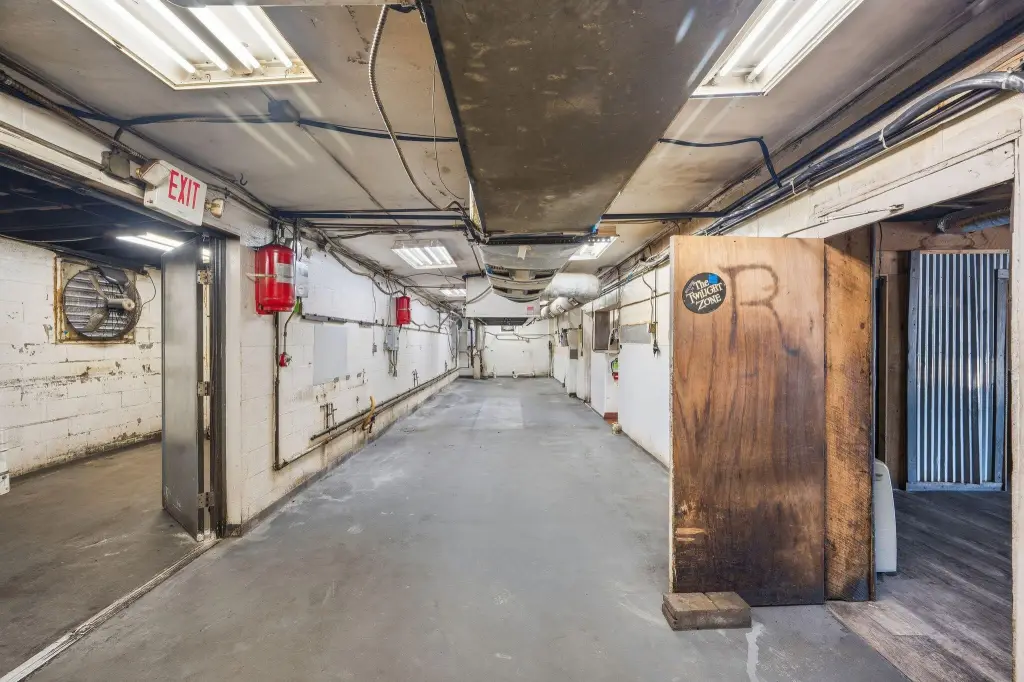
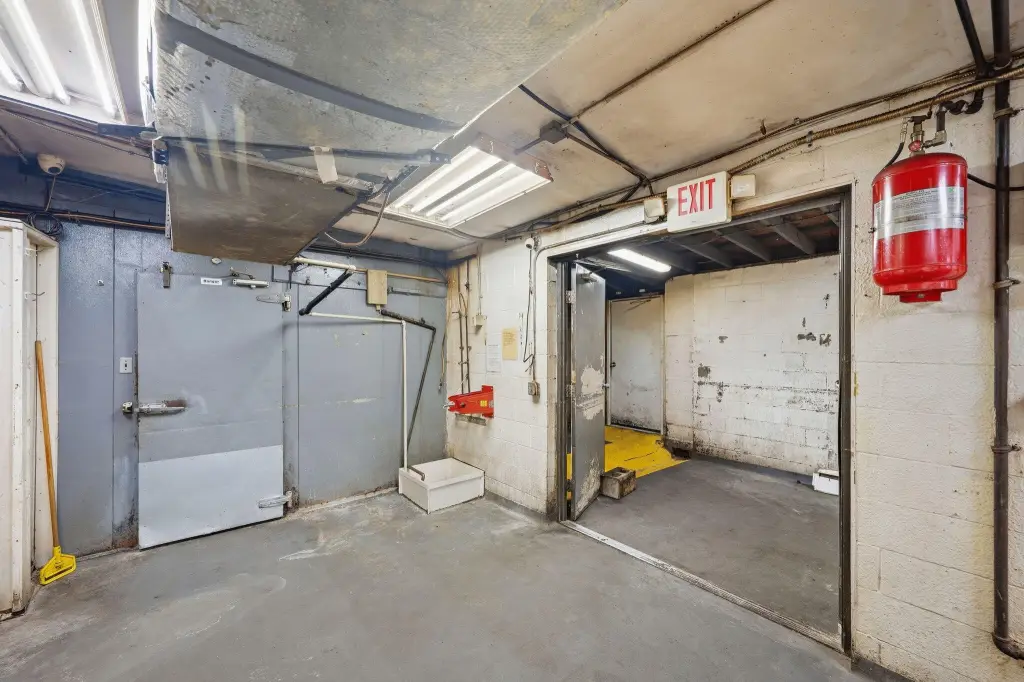
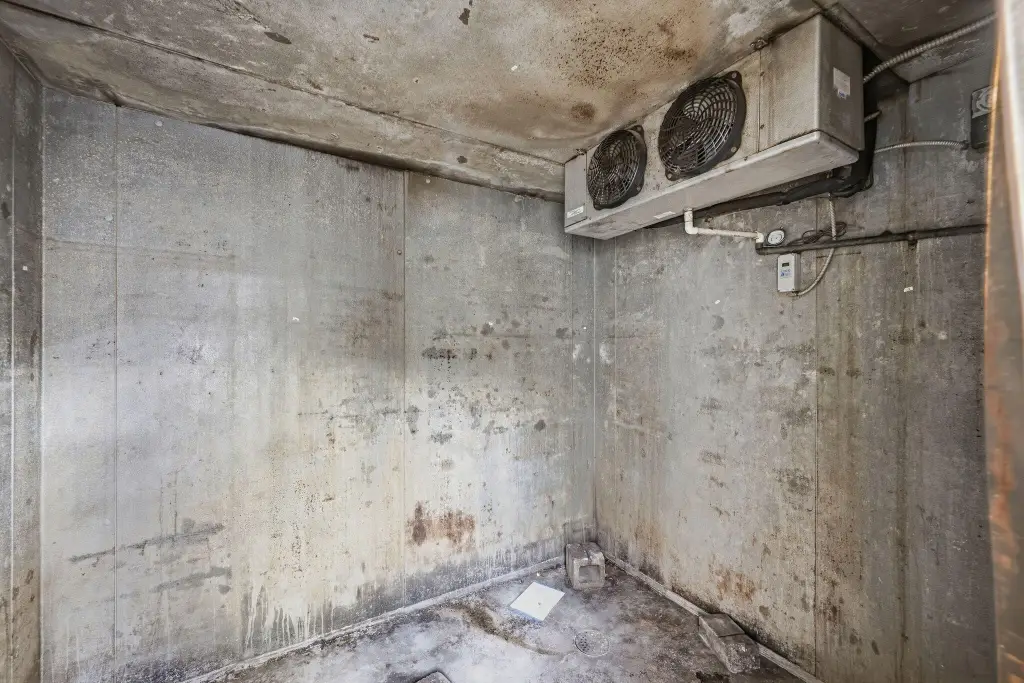
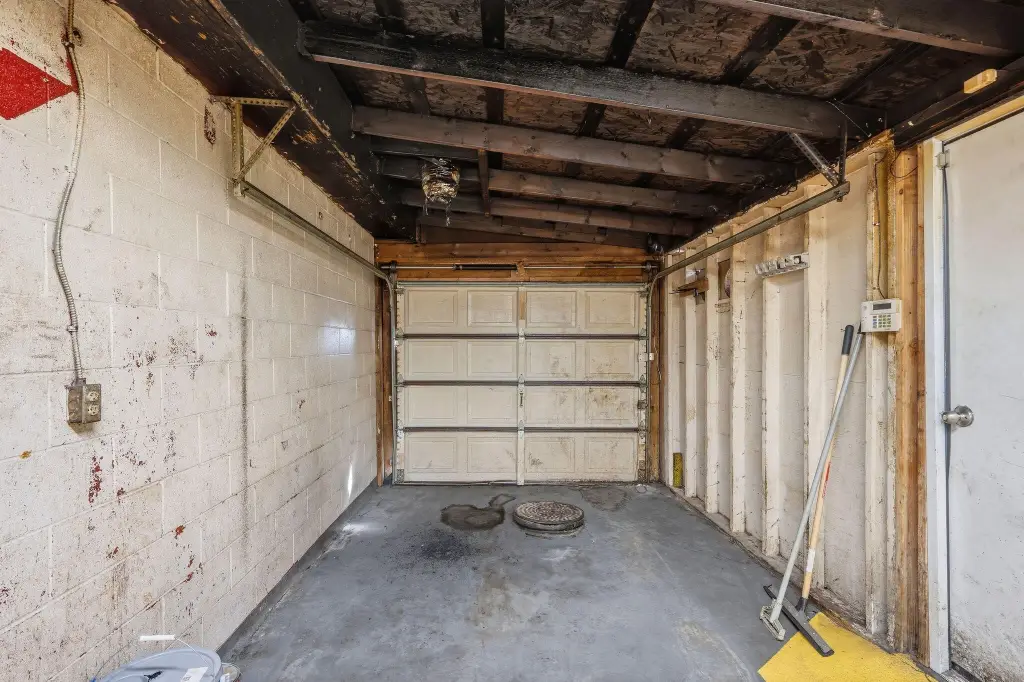
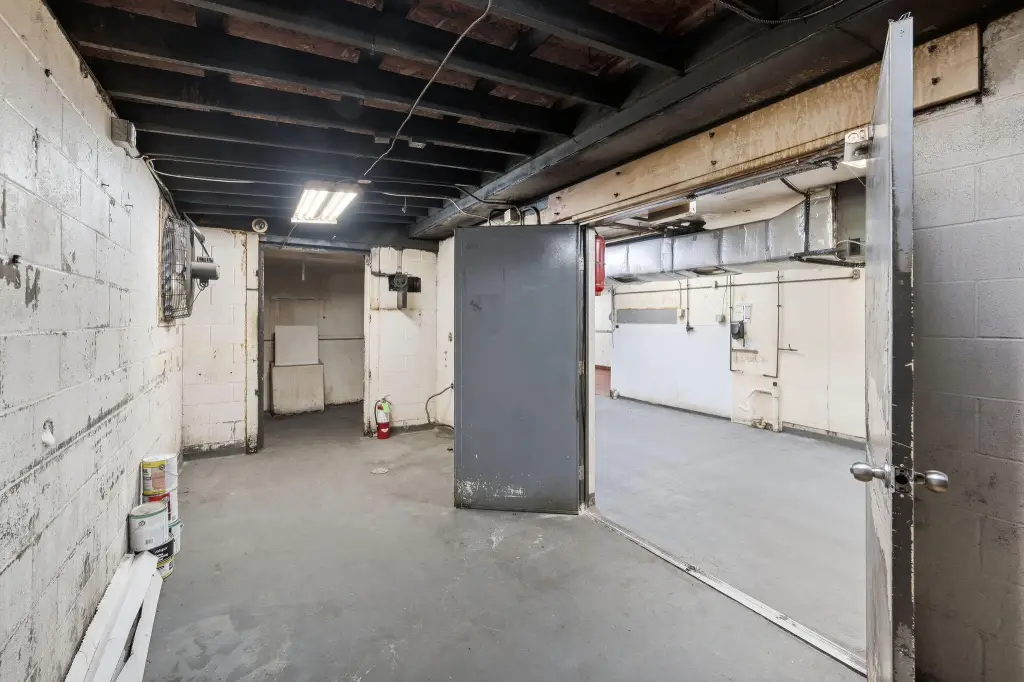
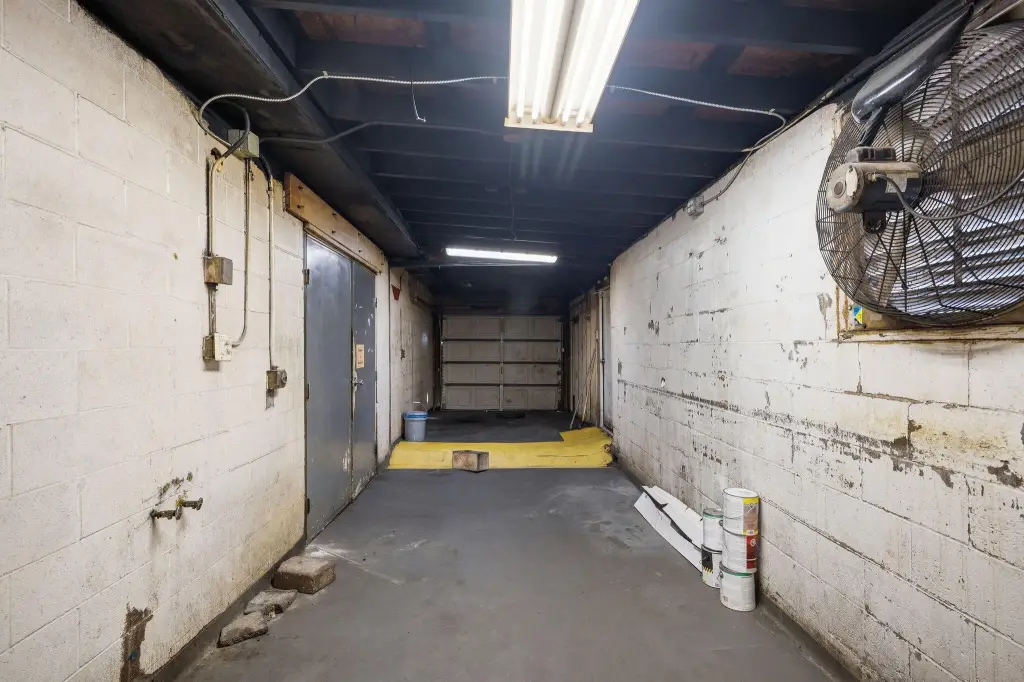
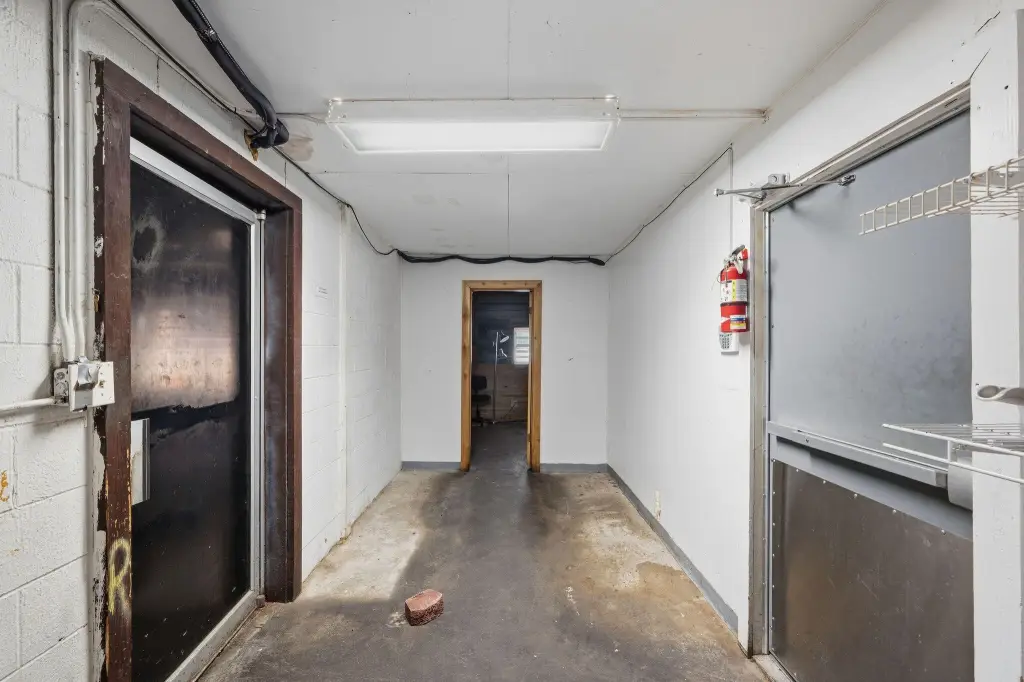
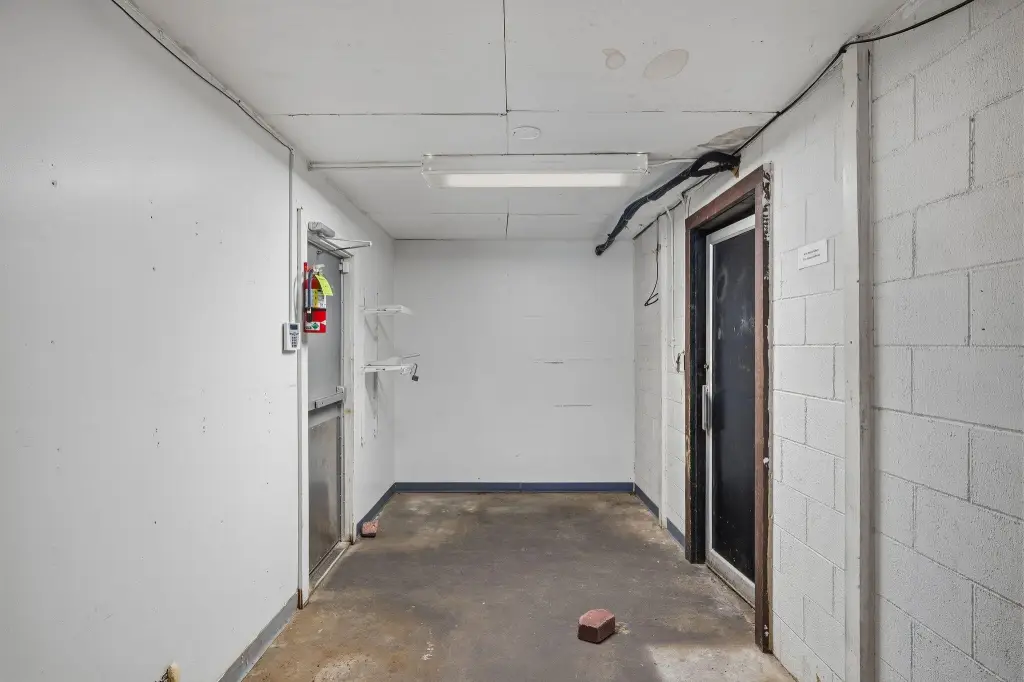
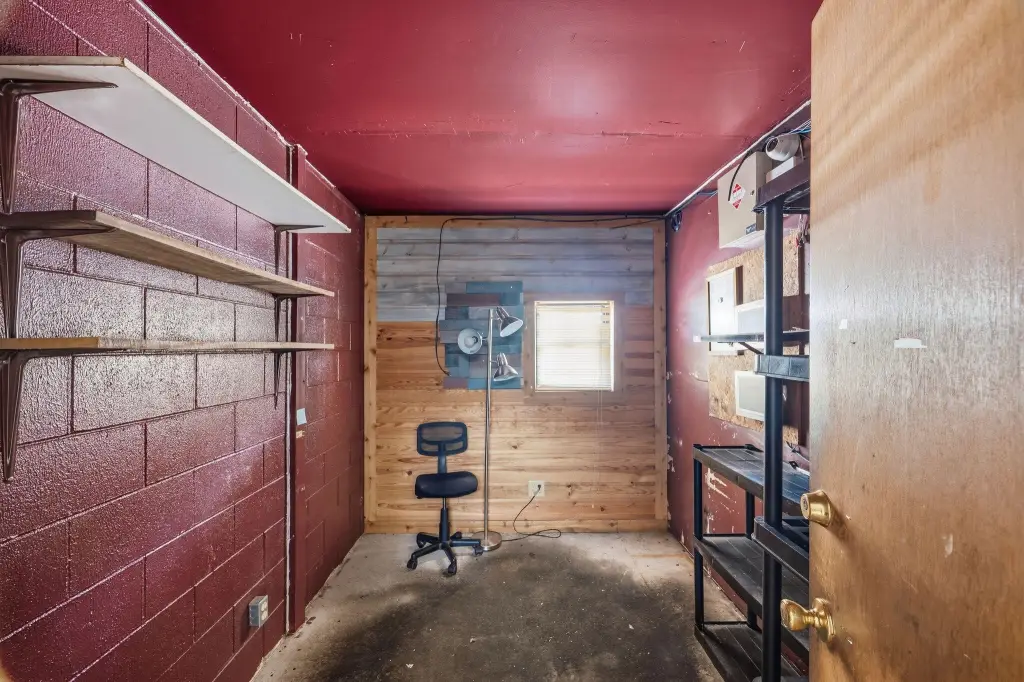
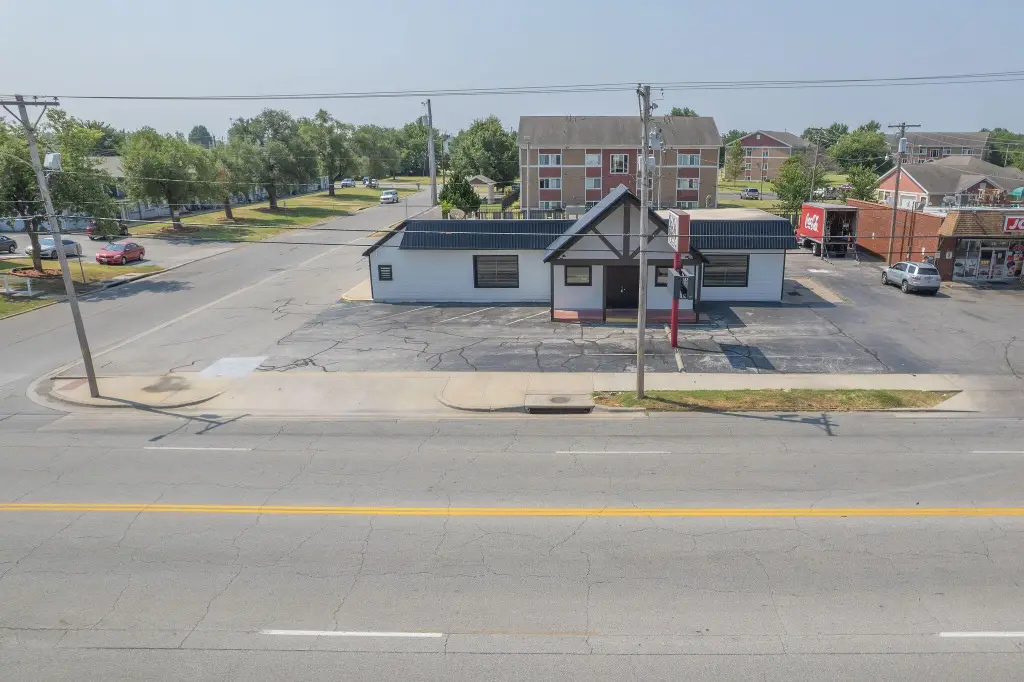
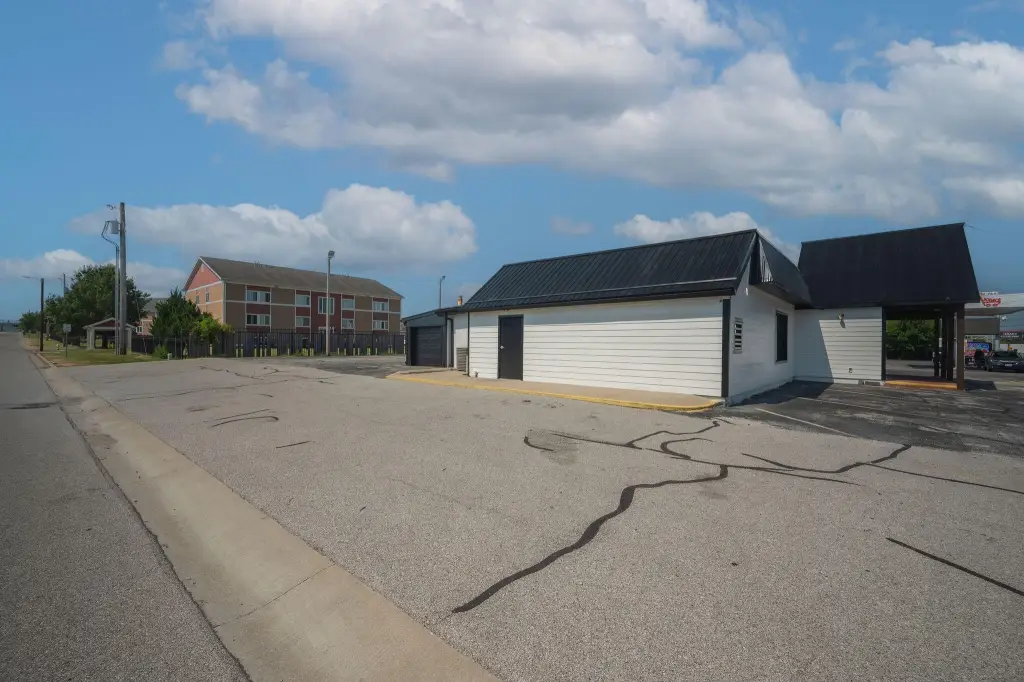
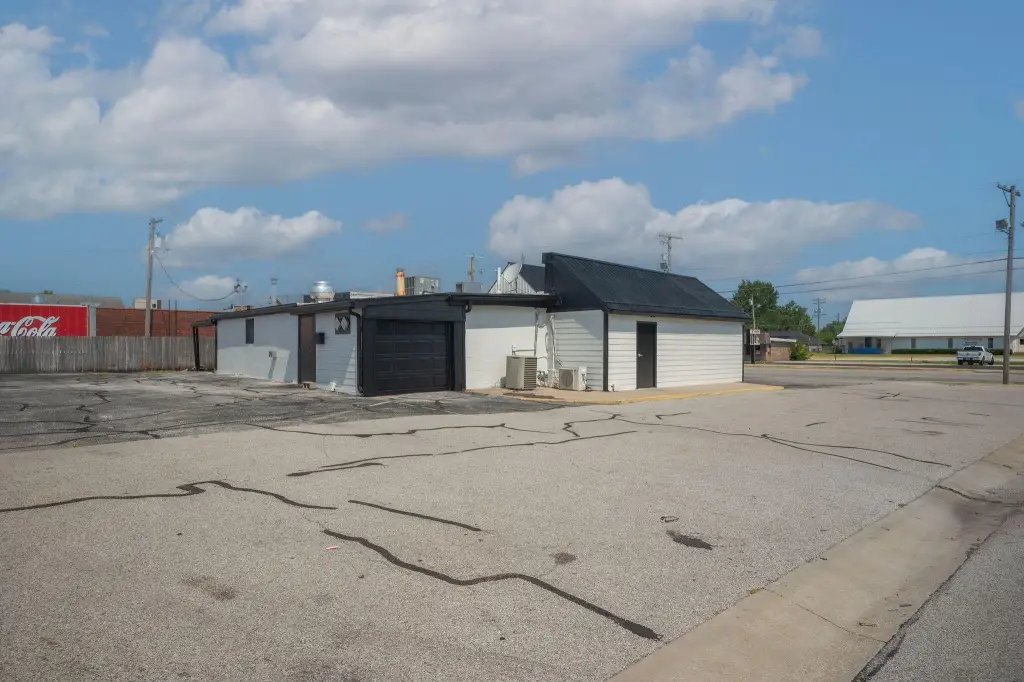
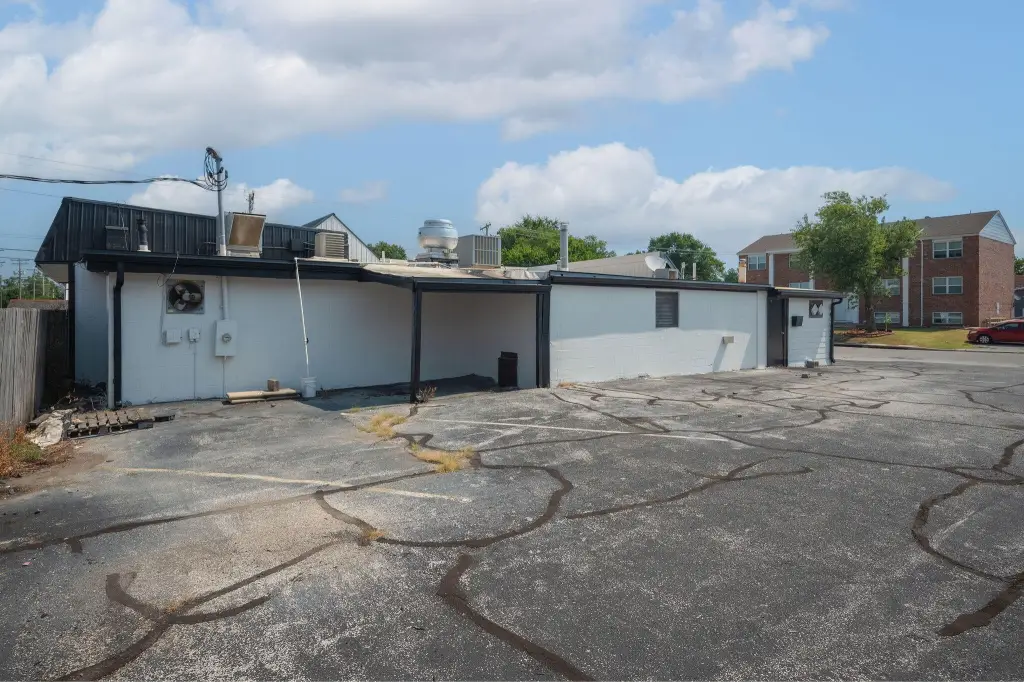
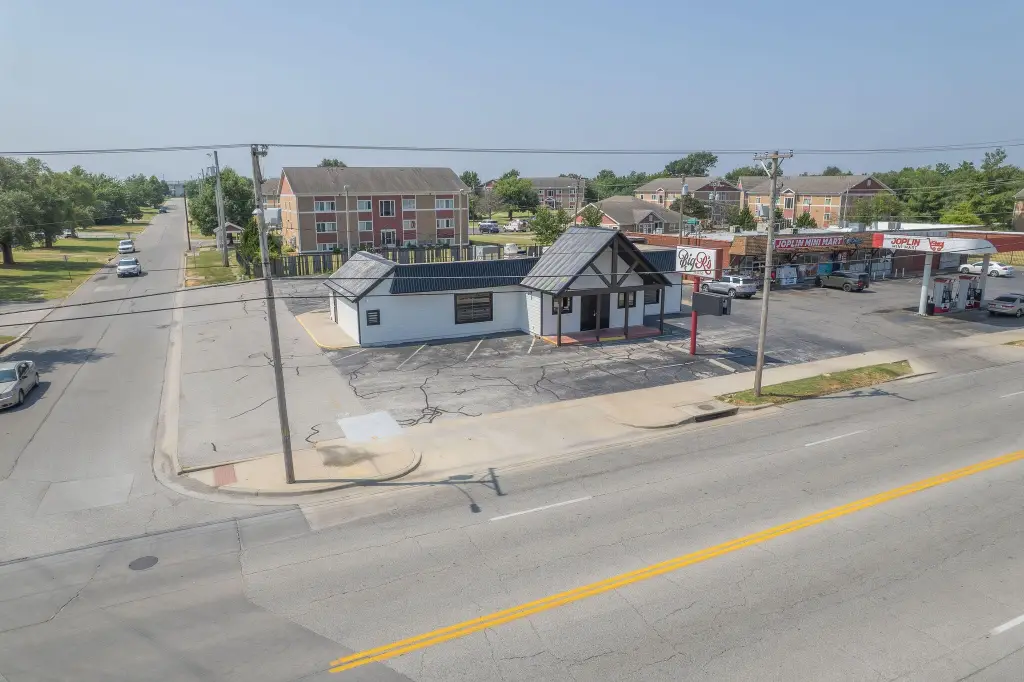
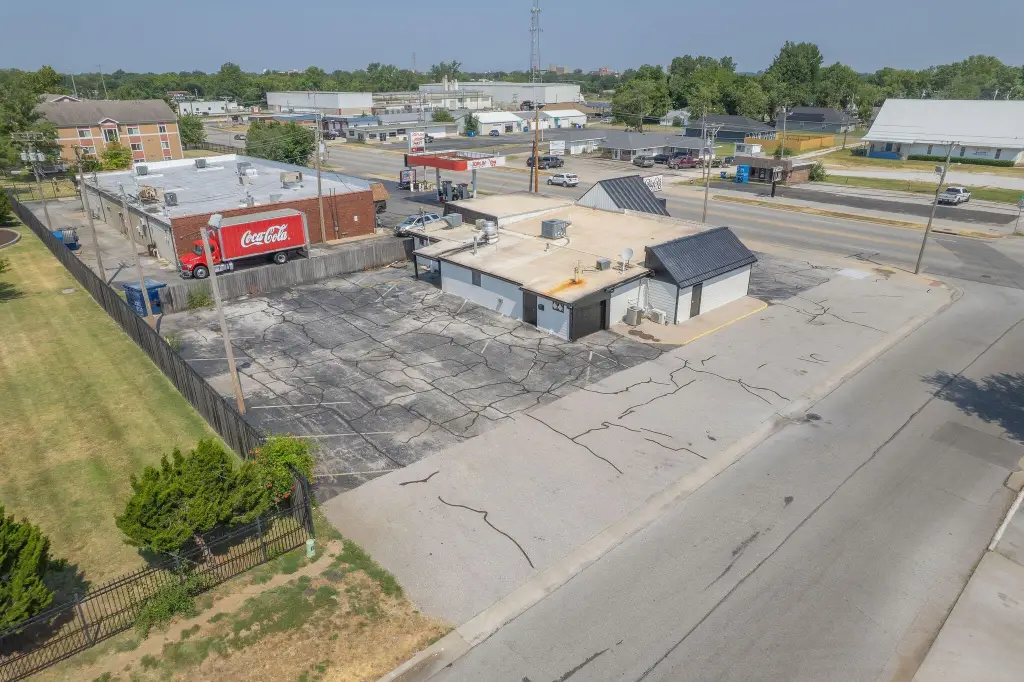
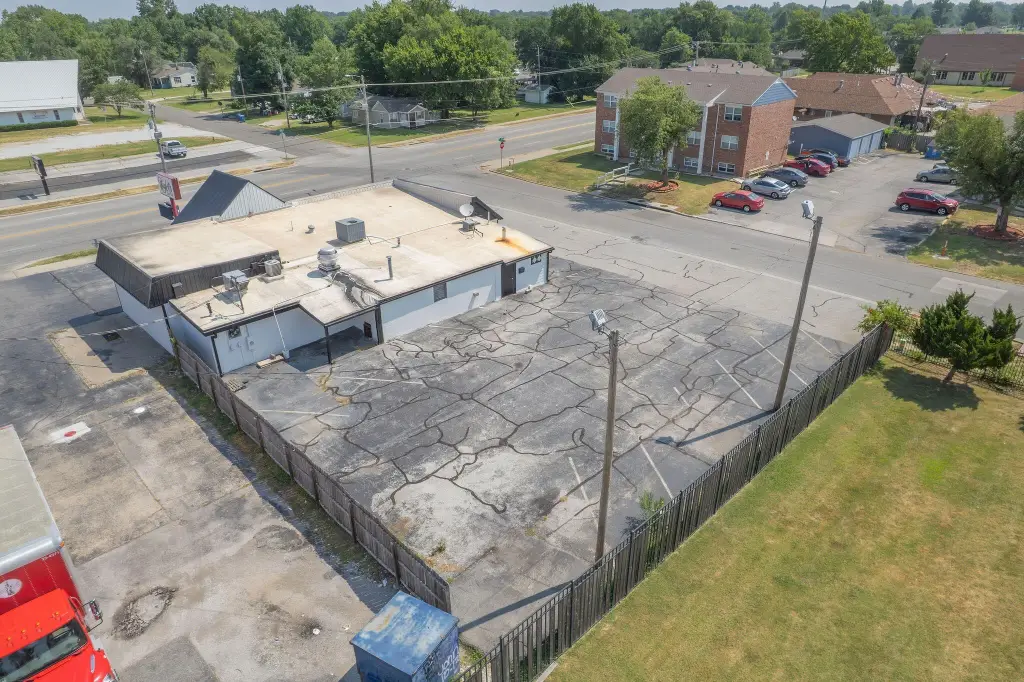
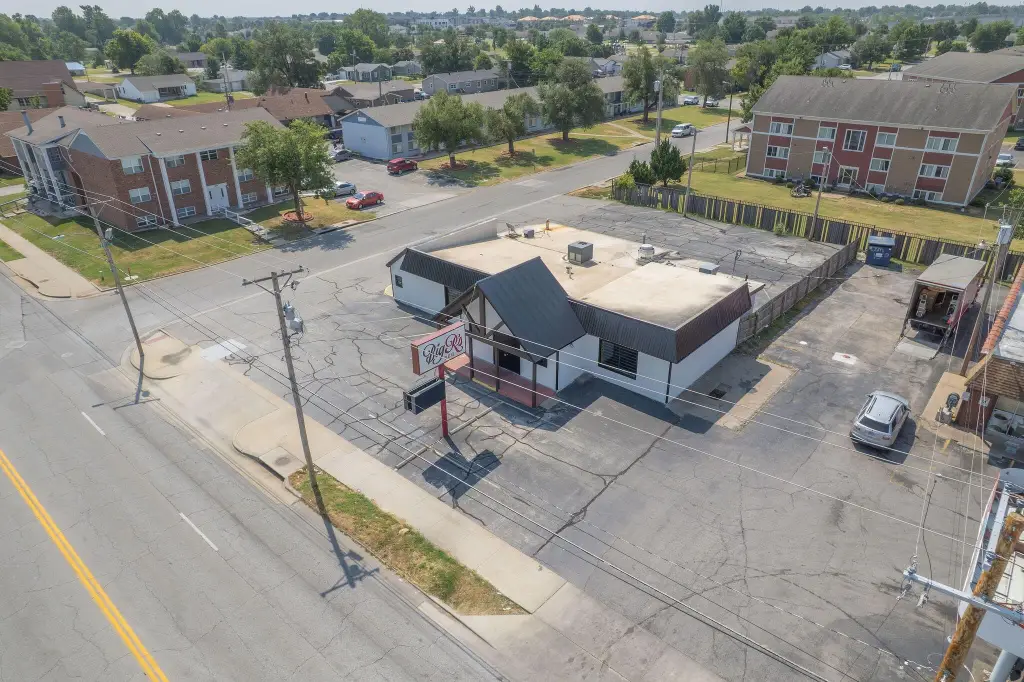
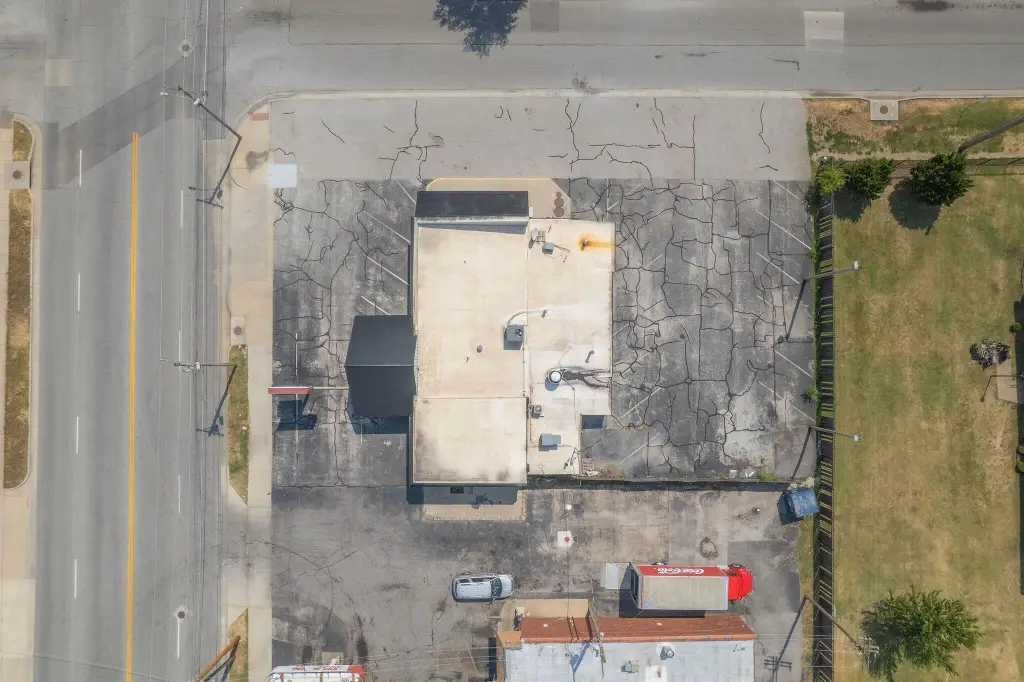
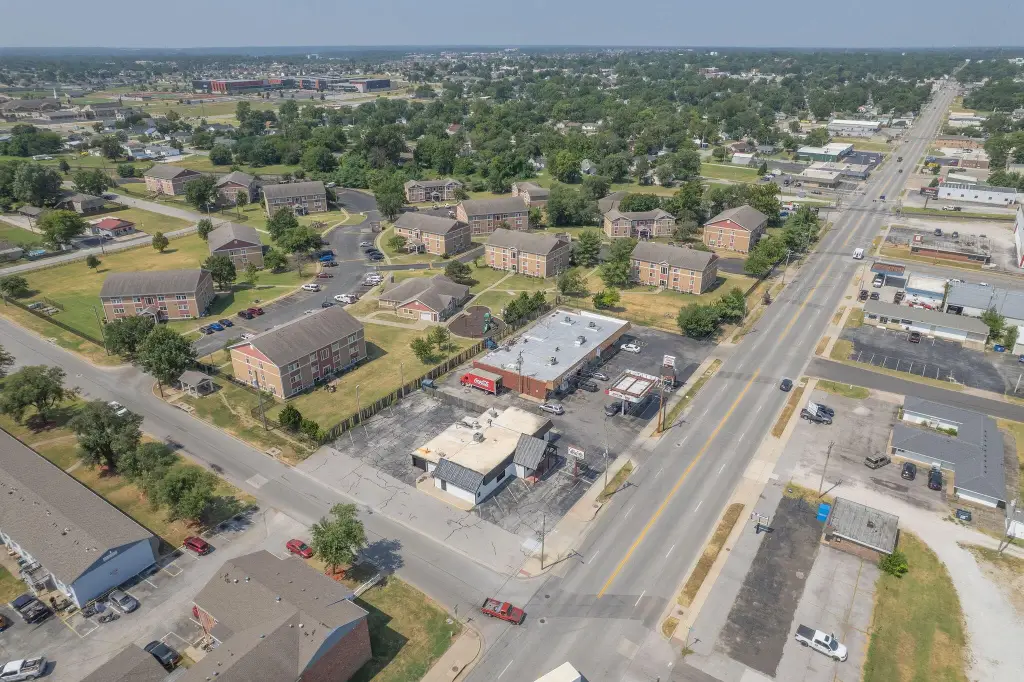
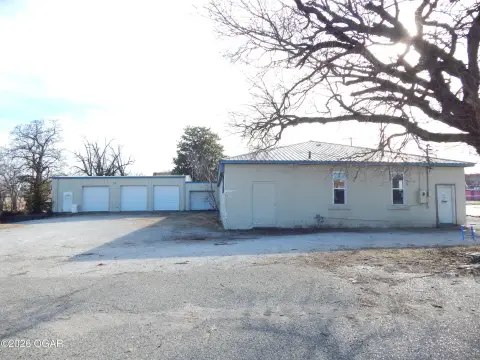
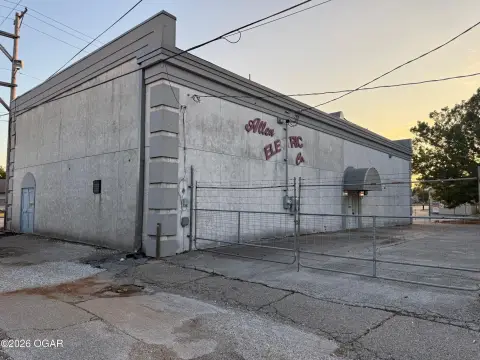
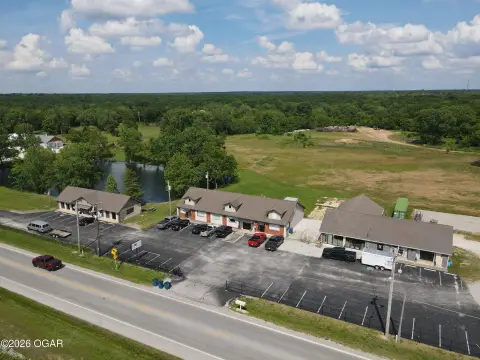
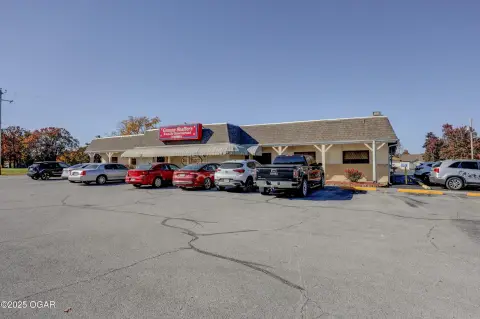
This freestanding flex space contains 2,960 square feet on approximately 0.32 acres. The interior has been cleared, creating an open configuration for a new owner to adapt. The building was originally arranged around a commercial kitchen footprint, multiple dining areas, a bar-style serving area, and rear loading access from Michigan Avenue. Central air, an asphalt roof, electric heating, and natural gas availability are also reported. Built in 1950, the property includes two bathrooms and is connected to municipal water and sewer.
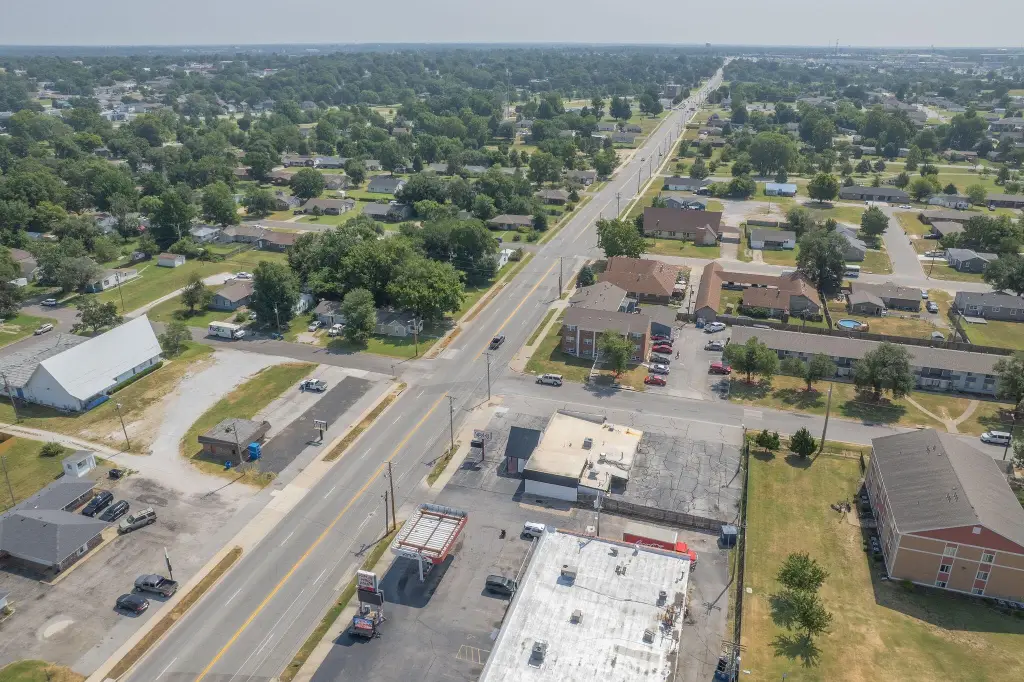
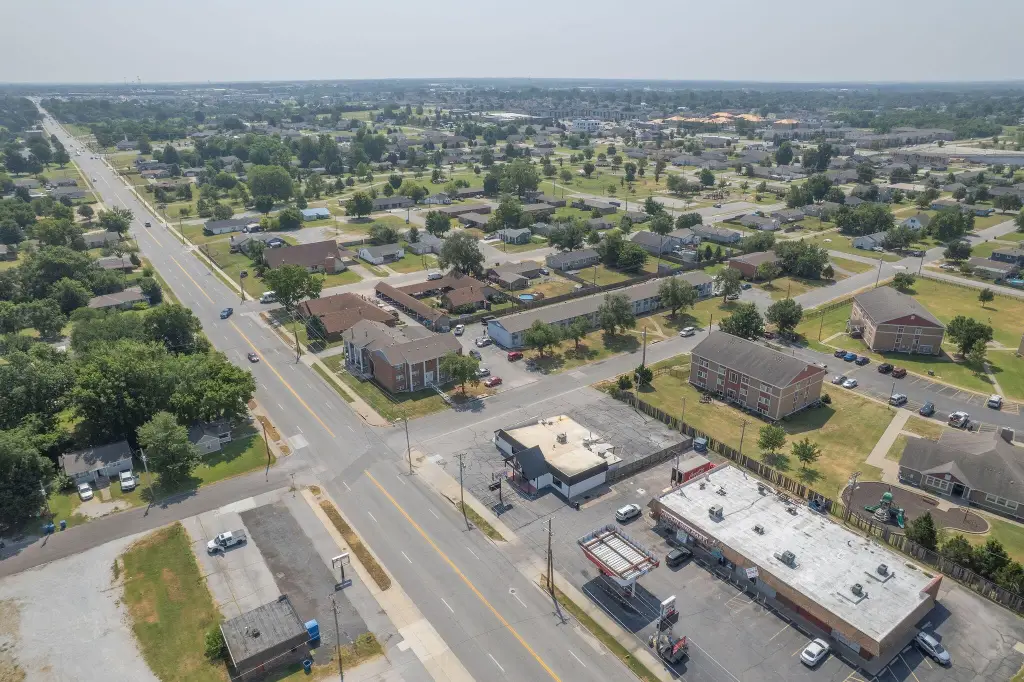
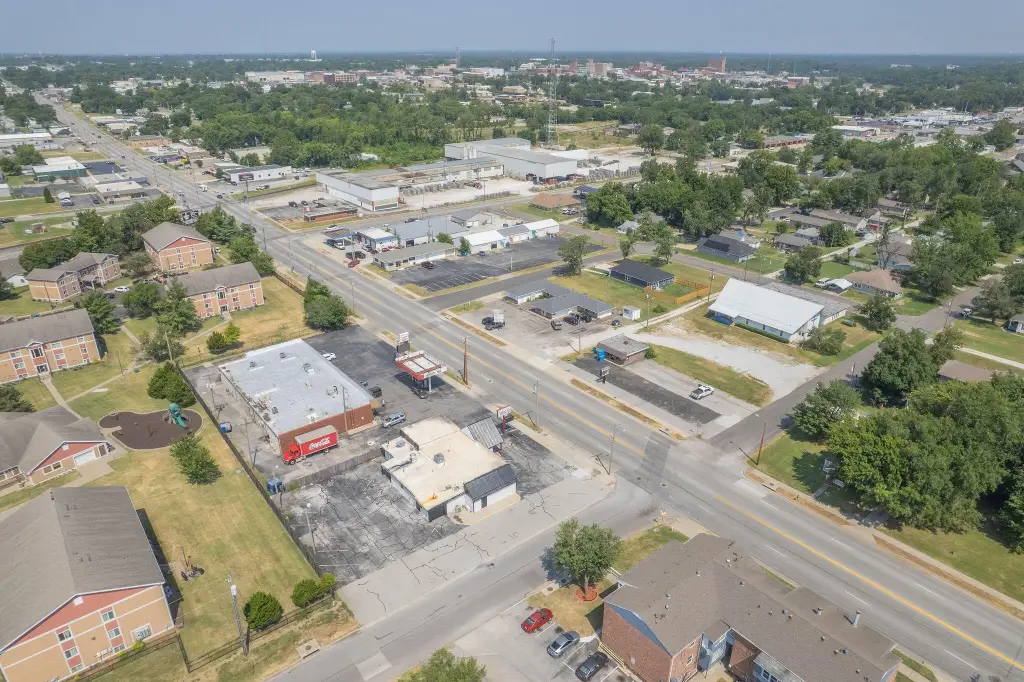
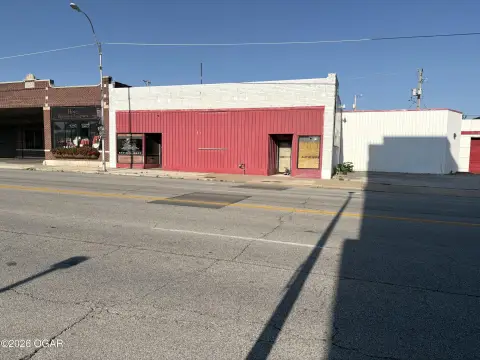
Located at 1220 E 15th Street in Joplin, Missouri, the building offers access to Rangeline Road and Main Street. Its rear loading area supports delivery access, while the existing commercial layout provides a foundation for future reconfiguration. The property is classified as flex space and is offered for sale.
Located at 1220 E 15th Street in Joplin, Missouri, the building offers access to Rangeline Road and Main Street. Its rear loading area supports delivery access, while the existing commercial layout provides a foundation for future reconfiguration. The property is classified as flex space and is offered for sale.
Key Highlights
- 2,960‑square‑foot freestanding building on approximately 0.32 acres
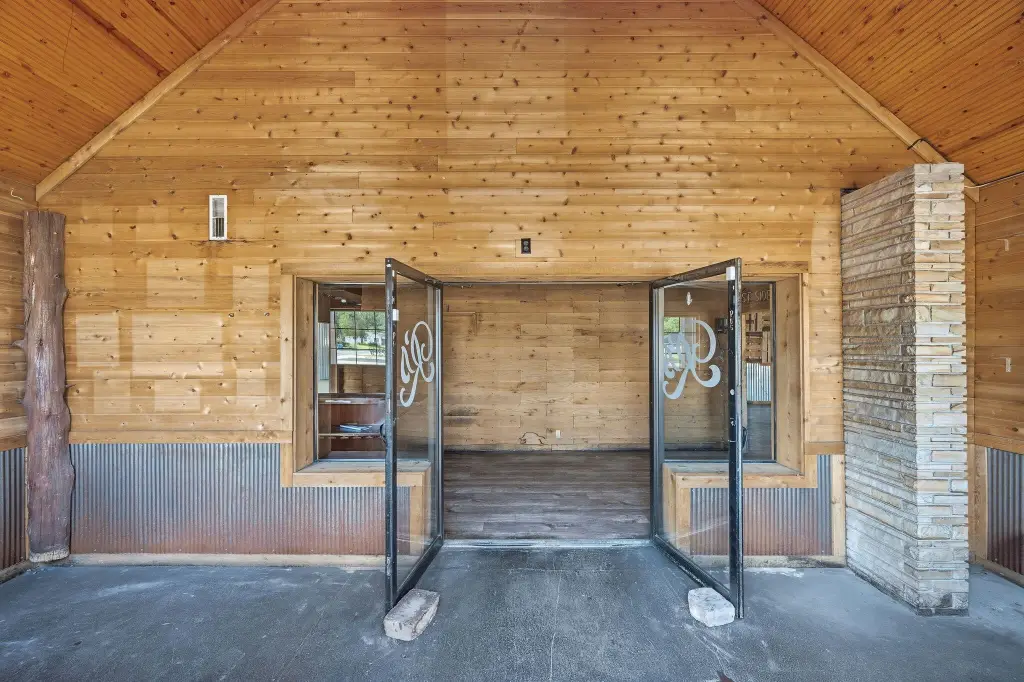
- Cleared, open interior ready for reconfiguration
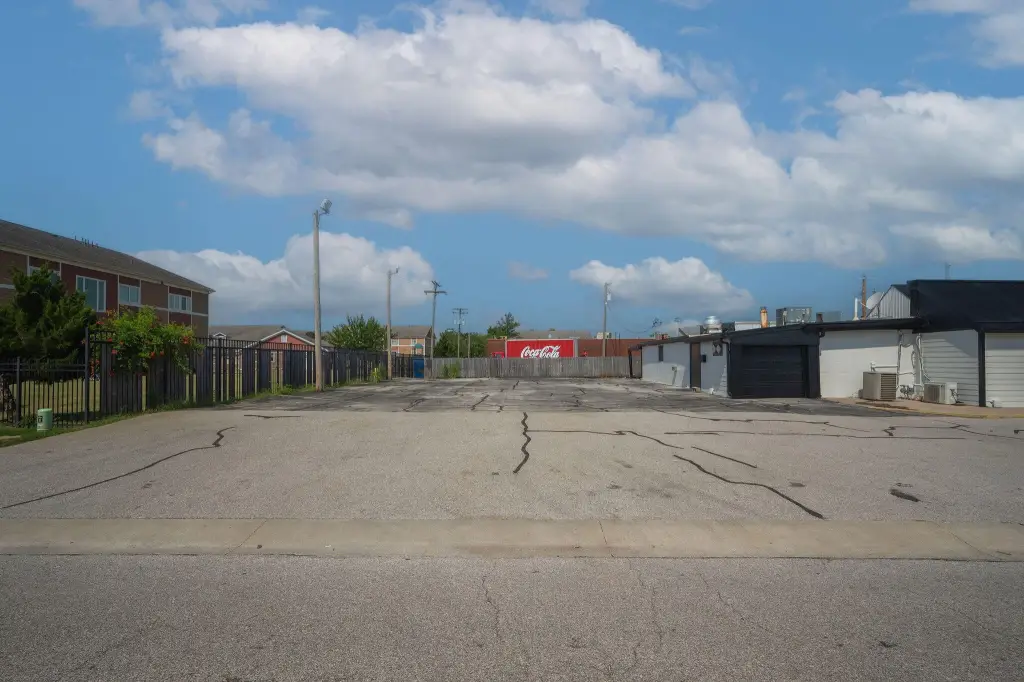
- Rear loading access from Michigan Avenue
Financial Insights
Estimated NOI and Cap Rate
NOI / Yr
$11,997
Cap Rate
5.33%
Suggested Prices Based on Cap Rates
Cap Rate 5%
$239,940
$239.9K
Cap Rate 7%
$171,386
$171.4K
Cap Rate 9%
$133,300
$133.3K
Market Conditions
NOI Build-Up for 2,960 SF
Gross rent
$17.8K $6.00/SF
− Vacancy
−$622 −$0.21/SF
EGI
$17.1K $5.79/SF
− OpEx
−$5.1K −$1.74/SF
NOI
$12.0K $4.05/SF
Area
Jasper County, MO
Vacancy
3.50%
Lease Rate
$6.00 /SF/Yr
Expense Ratio
30.00%
Simulate Cap Rate and NOI
Suggested Prices Based on Cap Rates
Cap Rate 5%
$239,940
Cap Rate 7%
$171,386
Cap Rate 9%
$133,300
Alternative Uses
Best Use
Specialty Retail
$427.5K
$374.0K – $498.7K
NOI $29,922 @ 7.0% cap · market cap 13.30%
Second Best
Industrial
$171.4K
$150.0K – $200.0K
NOI $11,997 @ 7.0% cap · market cap 5.33%
Theoretical Best
Office A
$893.1K
$781.4K – $1.04M
NOI $62,515 @ 7.0% cap · market cap 27.78%
Zoning and permitted uses should be independently verified with authorities.
How Realmo checks its estimates
Property Analytics
Unlock full access to Insights
Subscribe to Realmo Intelligence
Open Analytics
Current Use
Lease Details
Yes
Paved road access
Yes
Utilities to site
Location Intelligence
Trade Area within ½ mile
511
Businesses Nearby
Under-served
Demand for This Use
Explore this area
Business Placement
Demographics for 64804, MO
38,078
Population
16,844
Households
2.3
Avg Household Size
39
Median Age
28%
College-Educated
91%
High-School Grad
91.4 sq mi
ZIP Area
417
Density / Sq Mi
$62,081
Median Household Income
$34,780
Median Earnings
$886
Median Rent
$171,500
Median Home Value
Check the figures for this property
Cap Rate, Value Estimation, Potential NOI and more
View Realmo Analytics
Market
Vacancy Rate% for Industrial in Midwest region

Questions? Ask Rey
Realmo’s AI knows this listing — price, zoning, demand, history. Ask anything.

Frequently Asked Questions
What type of property is this?
Flex space - Cleared interior with central air, rear loading access, and municipal water and sewer.
Where is this flex space located?
The property is located at 1220 E 15th Street Joplin, MO.
What is the asking price?
The asking price for this property is $225,000.
What are key features of this property?
This property features: 2,960‑square‑foot freestanding building on approximately 0.32 acres; Cleared, open interior ready for reconfiguration; Rear loading access from Michigan Avenue


