Crown Heights Multifamily Investment
For Sale
$2,300,000
Pending
689 Lincoln 4A, Brooklyn, NY 11216
Income-producing 5-6 family building in Brooklyn's Crown Heights.
Property Size6,000 SF
Lot Size0.07 Acres
Days on Market309
Property Features for 689 Lincoln 4A
General Information
Standard status
Pending
Size
6,000 SF
Lot size
0.07 Acres
Property subtype
Commercial
Taxes and HOA fees
Annual Taxes
$13,766
Building Details
Building Size
6,000 SF
Year Built
1931
Units
6
Listing Agency:
Buyer Representation Office
Listed By:
Unrepresented Buyer
Source:
Elliman
Added: Dec 3, 2025
Changed: Oct 1
Last Checked: Oct 7 at 2:37PM
Displayed information is deemed reliable but is not guaranteed and should be independently verified. All listing content including descriptions, pricing, images are the copyrighted material of Buyer Representation Office
Investment Insights
Based on property information with market context.
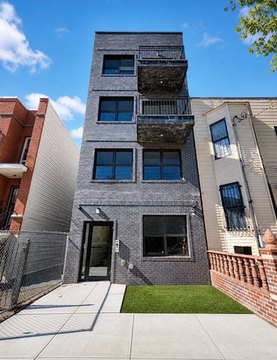
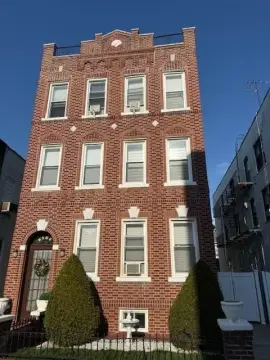
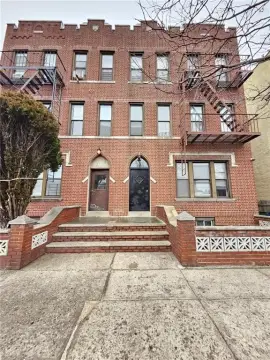
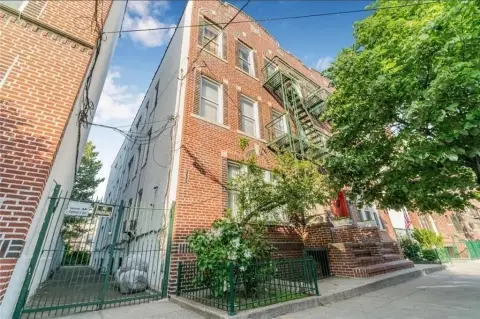
Located in the Crown Heights section of Brooklyn, New York, this property is configured as a 5-6 family building. It is designed to be an income-producing property. The building contains six two-bedroom apartments. Two apartments are located on each of the first, second, and third floors. Each unit includes one full bathroom, a living room/dining room combination, and a kitchen. The building features a spacious basement with above-ground windows and a walk-out door, providing access to outdoor space with greenery suitable for entertaining. The building size is 6000 square feet. Interior features include a living room/dining room. The property's appearance is rated as excellent, and it includes insulated doors.
Key Highlights
- Great income‑producing property
- Six 2‑bedroom apartments, each featuring a full bathroom, living room/dining combo, and kitchen
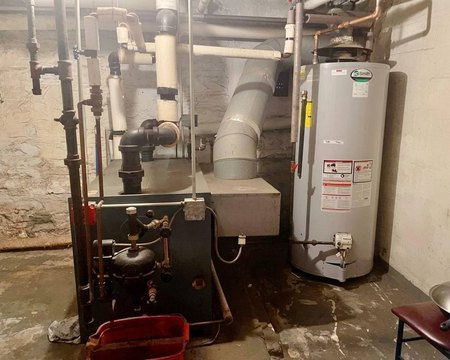
- Spacious basement with above‑ground windows and walk‑out access
Financial Insights
Estimated NOI and Cap Rate
NOI / Yr
$183,174
Cap Rate
7.96%
Suggested Prices Based on Cap Rates
Cap Rate 5%
$3,663,480
$3.7M
Cap Rate 7%
$2,616,771
$2.6M
Cap Rate 9%
$2,035,267
$2.0M
Market Conditions
NOI Build-Up for 6,000 SF
Gross rent
$339.8K $56.64/SF
− Vacancy
−$6.8K −$1.13/SF
EGI
$333.0K $55.51/SF
− OpEx
−$149.9K −$24.98/SF
NOI
$183.2K $30.53/SF
Area
Brooklyn, NY
Vacancy
2.00%
Lease Rate
$56.64 /SF/Yr
Expense Ratio
45.00%
Simulate Cap Rate and NOI
Suggested Prices Based on Cap Rates
Cap Rate 5%
$3,663,480
Cap Rate 7%
$2,616,771
Cap Rate 9%
$2,035,267
Alternative Uses
Best Use
Apartment 5plus
$2.62M
$2.29M – $3.05M
NOI $183,174 @ 7.0% cap · market cap 7.96%
Second Best
—
—
no second resolved use
Theoretical Best
Specialty Retail
$4.97M
$4.35M – $5.80M
NOI $347,760 @ 7.0% cap · market cap 15.12%
Zoning and permitted uses should be independently verified with authorities.
Property Analytics
Current Use
Location Intelligence
Trade Area within ½ mile
5,968
Businesses Nearby
Explore this area
Business Placement
Demographics for 11216, NY
61,251
Population
28,825
Households
2.1
Avg Household Size
34
Median Age
56%
College-Educated
91%
High-School Grad
1.0 sq mi
ZIP Area
61,251
Density / Sq Mi
$95,000
Median Household Income
$61,389
Median Earnings
$2,180
Median Rent
$1,398,400
Median Home Value
Market
Vacancy Rate% for Multifamily in Northeast region

Questions? Ask Rey
Realmo’s AI knows this listing — price, zoning, demand, history. Ask anything.







Frequently Asked Questions
What type of property is this?
Apartment building - Income-producing 5-6 family building in Brooklyn's Crown Heights.
Where is this apartment building located?
The property is located at 689 Lincoln 4A Brooklyn, NY.
What is the asking price?
The asking price for this property is $2,300,000.
What are key features of this property?
This property features: Great income‑producing property; Six 2‑bedroom apartments, each featuring a full bathroom, living room/dining combo, and kitchen; Spacious basement with above‑ground windows and walk‑out access


