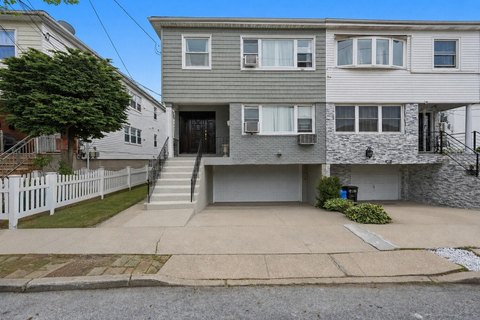
Spacious Jamaica Multi-Family
For Sale
$1,000,500
15042 116th Ave, Queens, NY 11434
Two-family house in South Jamaica with ample living space.
Property Size2,112 SF
Lot Size0.08 Acres
Days on Market314
Property Features for 15042 116th Ave
General Information
Standard status
Active
Size
2,112 SF
Lot size
0.08 Acres
Property subtype
Other
Taxes and HOA fees
Annual Taxes
$6,247
Building Details
Building Size
2,112 SF
Year Built
1993
Units
2
Listed By:
Sharon A. Fair Willis
(917) 613-0248
Source:
Elliman
Added: Nov 28, 2025
Changed: Oct 2
Last Checked: Oct 7 at 2:20PM
Displayed information is deemed reliable but is not guaranteed and should be independently verified. All listing content including descriptions, pricing, images are the copyrighted material of Sharon A. Fair Willis
Investment Insights
Based on property information with market context.
Located in South Jamaica, this two-family house was built in 1993 and offers 2,112 sq. ft. of living space. The property includes 6 bedrooms and 3 full bathrooms. Interior features consist of a large living/dining room area, an eat-in kitchen, and a den/family room. The full, finished basement provides additional versatile living space. Situated on a 3,500 sq. ft. lot, the home has a vinyl exterior. One parking space is included. The property is conveniently located near public transportation options, including bus and train routes, and is close to local amenities and schools. This property presents an excellent investment opportunity in Queens County.
Key Highlights
- Two‑family house ideal for large families or investment.
- Spacious with 2,112 sq. ft. of living space.
- Full, finished basement** providing versatile additional living space.
Financial Insights
Estimated NOI and Cap Rate
NOI / Yr
$51,627
Cap Rate
5.16%
Suggested Prices Based on Cap Rates
Cap Rate 5%
$1,032,540
$1.0M
Cap Rate 7%
$737,529
$737.5K
Cap Rate 9%
$573,633
$573.6K
Market Conditions
NOI Build-Up for 2,112 SF
Gross rent
$97.6K $46.20/SF
− Vacancy
−$3.7K −$1.76/SF
EGI
$93.9K $44.44/SF
− OpEx
−$42.2K −$20.00/SF
NOI
$51.6K $24.44/SF
Area
Queens County, NY
Vacancy
3.80%
Lease Rate
$46.20 /SF/Yr
Expense Ratio
45.00%
Simulate Cap Rate and NOI
Suggested Prices Based on Cap Rates
Cap Rate 5%
$1,032,540
Cap Rate 7%
$737,529
Cap Rate 9%
$573,633
Alternative Uses
Best Use
Apartment 5plus
$737.5K
$645.3K – $860.5K
NOI $51,627 @ 7.0% cap · market cap 5.16%
Second Best
Multifamily LT 5
$499.4K
$437.0K – $582.6K
NOI $34,957 @ 7.0% cap · market cap 3.49%
Theoretical Best
Office A
$1.56M
$1.36M – $1.82M
NOI $108,989 @ 7.0% cap · market cap 10.89%
Zoning and permitted uses should be independently verified with authorities.
Property Analytics
Unlock full access to Insights
Subscribe to Realmo Intelligence
Open Analytics
Current Use
Location Intelligence
Trade Area within ½ mile
660
Businesses Nearby
Explore this area
Business Placement
Demographics for 11434, NY
66,964
Population
23,787
Households
2.8
Avg Household Size
40
Median Age
22%
College-Educated
87%
High-School Grad
3.2 sq mi
ZIP Area
20,926
Density / Sq Mi
$76,668
Median Household Income
$46,742
Median Earnings
$1,409
Median Rent
$585,600
Median Home Value
Check the figures for this property
Cap Rate, Value Estimation, Potential NOI and more
View Realmo Analytics
Market
Vacancy Rate% for Multifamily in Northeast region

Questions? Ask Rey
Realmo’s AI knows this listing — price, zoning, demand, history. Ask anything.




Frequently Asked Questions
What type of property is this?
Duplex - Two-family house in South Jamaica with ample living space.
Where is this duplex located?
The property is located at 15042 116th Ave Queens, NY.
What is the asking price?
The asking price for this property is $1,000,500.
What are key features of this property?
This property features: Two‑family house ideal for large families or investment.; Spacious with **2,112 sq. ft. of living space.**; Full, finished basement** providing versatile additional living space.


