Clean CO-OP Unit with
For Sale
$108,000
2106 NE 56th Ct 204, Fort Lauderdale, FL 33308
Second-floor CO-OP unit with tandem parking near beaches.
Property Size600 SF
Days on Market315
Property Features for 2106 NE 56th Ct 204
General Information
Standard status
Active
Size
600 SF
Property subtype
Residential
Taxes and HOA fees
Annual Taxes
$2,363
Building Details
Building Size
600 SF
Year Built
1966
Stories
11
Listed By:
Beth A Daly · License #667493
(954) 663-3180
Source:
Elliman
Added: Nov 28, 2025
Changed: Oct 8
Last Checked: Oct 7 at 1:37PM
Displayed information is deemed reliable but is not guaranteed and should be independently verified. All listing content including descriptions, pricing, images are the copyrighted material of Beth A Daly
Investment Insights
Based on property information with market context.
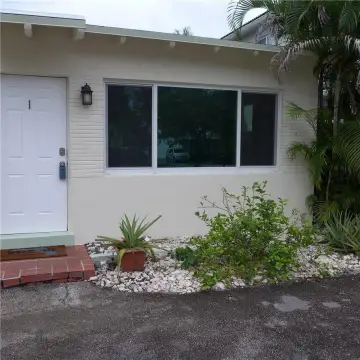
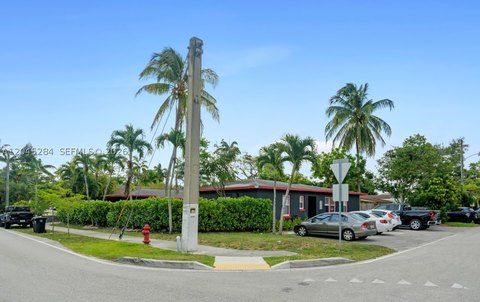
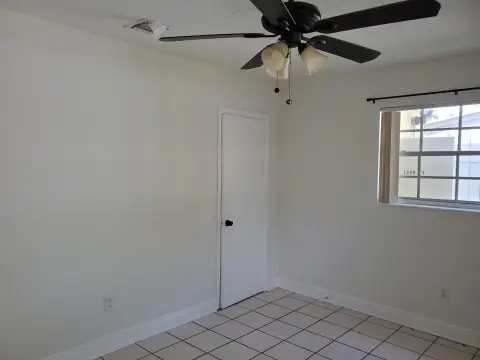
This bright and clean second-floor walk-up CO-OP unit includes tandem parking suitable for two small cars. Cash buyers are preferred, and rentals are not permitted. Pets are not allowed. The monthly maintenance fee is $270. The property is located a few blocks west of US 1, providing convenient access to beaches, groceries, hospitals, shopping, and highways. The surrounding neighborhood is peaceful, with nearby parks and a public library. The unit features spacious rooms with dual entry from the front and rear. Additional storage space is available on the second floor for bikes and other items. Residents can enjoy a tranquil backyard, as well as a heated pool. The unit includes a Zinsco electrical panel. The roof was replaced in 2014, and the sewer lines were updated in 2023. The complex is professionally managed. The property is approximately 2.5 miles from Lauderdale by the Sea beaches and entertainment area.
Key Highlights
- Low monthly maintenance fee of $270.
- Tandem parking space that fits 2 small cars.
- Convenient location close to beaches, groceries, hospitals, shopping, and highways.**
Financial Insights
Estimated NOI and Cap Rate
NOI / Yr
$9,010
Cap Rate
8.34%
Suggested Prices Based on Cap Rates
Cap Rate 5%
$180,200
$180.2K
Cap Rate 7%
$128,714
$128.7K
Cap Rate 9%
$100,111
$100.1K
Market Conditions
NOI Build-Up for 600 SF
Gross rent
$17.3K $28.80/SF
− Vacancy
−$899 −$1.50/SF
EGI
$16.4K $27.30/SF
− OpEx
−$7.4K −$12.29/SF
NOI
$9.0K $15.02/SF
Area
Fort Lauderdale, FL
Vacancy
5.20%
Lease Rate
$28.80 /SF/Yr
Expense Ratio
45.00%
Simulate Cap Rate and NOI
Suggested Prices Based on Cap Rates
Cap Rate 5%
$180,200
Cap Rate 7%
$128,714
Cap Rate 9%
$100,111
Alternative Uses
Best Use
Apartment 5plus
$128.7K
$112.6K – $150.2K
NOI $9,010 @ 7.0% cap · market cap 8.34%
Second Best
—
—
no second resolved use
Theoretical Best
Office A
$403.2K
$352.8K – $470.4K
NOI $28,224 @ 7.0% cap · market cap 26.13%
Zoning and permitted uses should be independently verified with authorities.
Property Analytics
Unlock full access to Insights
Subscribe to Realmo Intelligence
Open Analytics
Current Use
Location Intelligence
Trade Area within ½ mile
2,414
Businesses Nearby
Explore this area
Business Placement
Demographics for 33308, FL
29,519
Population
23,230
Households
1.3
Avg Household Size
57
Median Age
56%
College-Educated
96%
High-School Grad
4.6 sq mi
ZIP Area
6,417
Density / Sq Mi
$83,413
Median Household Income
$58,600
Median Earnings
$1,850
Median Rent
$536,900
Median Home Value
Check the figures for this property
Cap Rate, Value Estimation, Potential NOI and more
View Realmo Analytics
Market
Vacancy Rate% for Multifamily in South region

Questions? Ask Rey
Realmo’s AI knows this listing — price, zoning, demand, history. Ask anything.




Frequently Asked Questions
What type of property is this?
Apartment building - Second-floor CO-OP unit with tandem parking near beaches.
Where is this apartment building located?
The property is located at 2106 NE 56th Ct 204 Fort Lauderdale, FL.
What is the asking price?
The asking price for this property is $108,000.
What are key features of this property?
This property features: Low monthly maintenance fee of $270.; Tandem parking space that fits 2 small cars.; Convenient location close to beaches, groceries, hospitals, shopping, and highways.**


