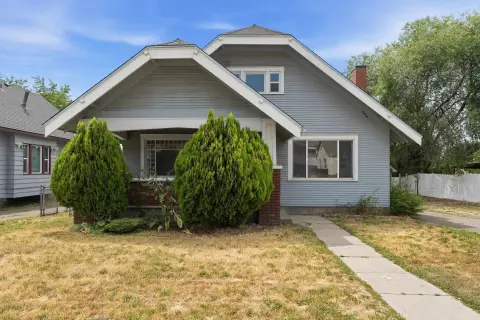
Updated Duplex with Detached
For Sale
$529,950
1203 S Walnut St, Spokane, WA 99204
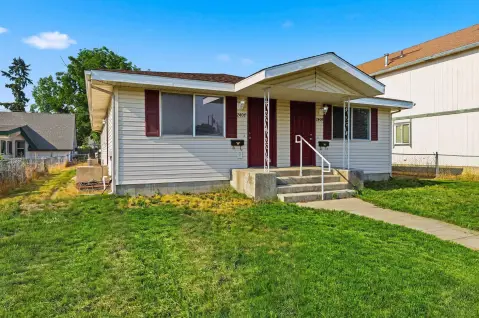
Recent exterior improvements and a separate garage add practical utility for residents.
Property Size3,432 SF
Price / SF$154.41
Days on Market64
Property Features for 1203 S Walnut St
General Information
Standard status
Active
Size
3,432 SF
Property subtype
Residential Income
Additional Details
Multifamily Units
2
Amenities
detached garage
Building Details
Buildings
1
Listing Agency:
RE/MAX Inland Empire
(509) 232-0824
Listed By:
Riley Long
(509) 217-0905
Source:
Exprealty
Added: Aug 4
Changed: Oct 1
Last Checked: Oct 5 at 10:24PM
Displayed information is deemed reliable but is not guaranteed and should be independently verified. All listing content including descriptions, pricing, images are the copyrighted material of RE/MAX Inland Empire
Investment Insights
Based on property information with market context.
This duplex includes a detached garage that can support parking or storage needs. Recent property improvements include a new roof, refreshed exterior paint, new sod, and other repairs completed over the past several months. One unit has new carpet and refinished oak hardwood flooring, adding updated interior finishes for occupants.
Located in Spokane’s Lower South Hill, the property is near parks, scenic trails, coffee shops, grocery stores, and other everyday conveniences. Its neighborhood setting provides access to a range of nearby services and recreational destinations for residents.
Located in Spokane’s Lower South Hill, the property is near parks, scenic trails, coffee shops, grocery stores, and other everyday conveniences. Its neighborhood setting provides access to a range of nearby services and recreational destinations for residents.
Key Highlights
- Duplex with a detached garage for parking or storage
- New roof and refreshed exterior paint
- New sod plus additional repairs and improvements
Financial Insights
Estimated NOI and Cap Rate
NOI / Yr
$39,260
Cap Rate
7.41%
Suggested Prices Based on Cap Rates
Cap Rate 5%
$785,200
$785.2K
Cap Rate 7%
$560,857
$560.9K
Cap Rate 9%
$436,222
$436.2K
Market Conditions
NOI Build-Up for 3,432 SF
Gross rent
$59.7K $17.40/SF
− Vacancy
−$3.6K −$1.06/SF
EGI
$56.1K $16.34/SF
− OpEx
−$16.8K −$4.90/SF
NOI
$39.3K $11.44/SF
Area
Spokane, WA
Vacancy
6.08%
Lease Rate
$17.40 /SF/Yr
Expense Ratio
30.00%
Simulate Cap Rate and NOI
Suggested Prices Based on Cap Rates
Cap Rate 5%
$785,200
Cap Rate 7%
$560,857
Cap Rate 9%
$436,222
Alternative Uses
Best Use
Multifamily LT 5
$560.9K
$490.8K – $654.3K
NOI $39,260 @ 7.0% cap · market cap 7.41%
Second Best
Apartment 5plus
$487.6K
$426.7K – $568.9K
NOI $34,134 @ 7.0% cap · market cap 6.44%
Theoretical Best
Office A
$885.5K
$774.8K – $1.03M
NOI $61,982 @ 7.0% cap · market cap 11.70%
Zoning and permitted uses should be independently verified with authorities.
Property Analytics
Unlock full access to Insights
Subscribe to Realmo Intelligence
Open Analytics
Current Use
Lease Details
2
Residential units
Location Intelligence
Trade Area within ½ mile
1,077
Businesses Nearby
Explore this area
Business Placement
Demographics for 99204, WA
7,000
Population
4,357
Households
1.6
Avg Household Size
34
Median Age
37%
College-Educated
93%
High-School Grad
1.0 sq mi
ZIP Area
7,000
Density / Sq Mi
$50,266
Median Household Income
$39,036
Median Earnings
$1,103
Median Rent
$355,700
Median Home Value
Check the figures for this property
Cap Rate, Value Estimation, Potential NOI and more
View Realmo Analytics
Market
Vacancy Rate% for Multifamily in West region

Questions? Ask Rey
Realmo’s AI knows this listing — price, zoning, demand, history. Ask anything.





Frequently Asked Questions
What type of property is this?
Duplex - Recent exterior improvements and a separate garage add practical utility for residents.
Where is this duplex located?
The property is located at 1203 S Walnut St Spokane, WA.
What is the asking price?
The asking price for this property is $529,950.
What are key features of this property?
This property features: Duplex with a detached garage for parking or storage; New roof and refreshed exterior paint; New sod plus additional repairs and improvements