Hearthstone Condo with Private
For Sale
$290,000
120 W BROADWAY #2C BEL, Bel Air, MD 21014
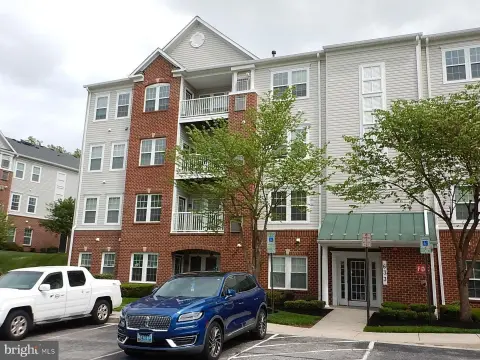
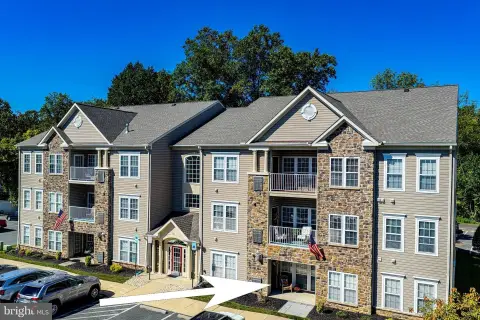
Ground-level condo in 55+ community with green space.
Property Size1,335 SF
Days on Market406
Property Features for 120 W BROADWAY #2C BEL
General Information
Standard status
Active
Size
1,335 SF
Property subtype
Apartment
Amenities
Central A/C
Ceiling Fan(s)
Forced Air
Built-In Microwave
Dishwasher
Dryer
Oven/Range - Electric
Refrigerator
Washer
Patio
Building Details
Building Size
1,335 SF
Year Built
2005
Listing Agency:
White Marsh/Perry Hall
Listed By:
Joe Norman · License #656100
(443) 640-7339
Source:
Kw
Added: Aug 26, 2025
Changed: Sep 22
Last Checked: Oct 5 at 4:19PM
Displayed information is deemed reliable but is not guaranteed and should be independently verified. All listing content including descriptions, pricing, images are the copyrighted material of White Marsh/Perry Hall
Investment Insights
Based on property information with market context.
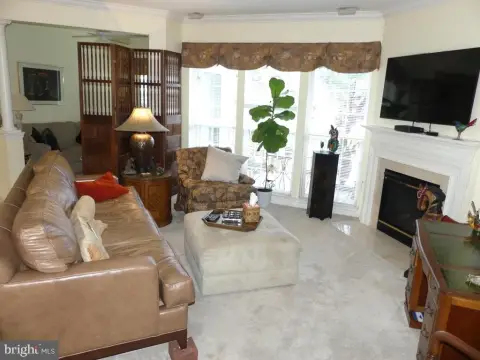
This ground-level condo is located within the Hearthstone at Village Square 55+ community. The building offers accessibility features such as an elevator and a front ramp. The unit, situated on the first floor, faces the rear of the building and includes a ground-level patio with green space. The condo features a spacious floor plan, a kitchen equipped with stainless steel appliances, a closet pantry, and a washer/dryer closet. It includes two bedrooms and two bathrooms, each with a private bathroom and closet space, as well as an additional den/office area adjacent to the living/kitchen area. The property is located close to restaurants and shopping in Bel Air.
Key Highlights
- Ground level condo with private patio and green space.
- 55+ community (Hearthstone at Village Square) with easy access features (elevator, front ramp).
- Spacious floor plan with 2 bedrooms and 2 private bathrooms.
Financial Insights
Estimated NOI and Cap Rate
NOI / Yr
$17,877
Cap Rate
6.16%
Suggested Prices Based on Cap Rates
Cap Rate 5%
$357,540
$357.5K
Cap Rate 7%
$255,386
$255.4K
Cap Rate 9%
$198,633
$198.6K
Market Conditions
NOI Build-Up for 1,335 SF
Gross rent
$34.8K $26.04/SF
− Vacancy
−$2.3K −$1.69/SF
EGI
$32.5K $24.35/SF
− OpEx
−$14.6K −$10.96/SF
NOI
$17.9K $13.39/SF
Area
Harford County, MD
Vacancy
6.50%
Lease Rate
$26.04 /SF/Yr
Expense Ratio
45.00%
Simulate Cap Rate and NOI
Suggested Prices Based on Cap Rates
Cap Rate 5%
$357,540
Cap Rate 7%
$255,386
Cap Rate 9%
$198,633
Alternative Uses
Best Use
Apartment 5plus
$255.4K
$223.5K – $298.0K
NOI $17,877 @ 7.0% cap · market cap 6.16%
Second Best
—
—
no second resolved use
Theoretical Best
Office A
$469.7K
$411.0K – $548.0K
NOI $32,881 @ 7.0% cap · market cap 11.34%
Zoning and permitted uses should be independently verified with authorities.
Property Analytics
Unlock full access to Insights
Subscribe to Realmo Intelligence
Open Analytics
Current Use
Location Intelligence
Trade Area within ½ mile
1,346
Businesses Nearby
Explore this area
Business Placement
Demographics for 21014, MD
38,395
Population
14,975
Households
2.6
Avg Household Size
41
Median Age
45%
College-Educated
94%
High-School Grad
13.9 sq mi
ZIP Area
2,762
Density / Sq Mi
$113,825
Median Household Income
$59,656
Median Earnings
$1,571
Median Rent
$407,800
Median Home Value
Check the figures for this property
Cap Rate, Value Estimation, Potential NOI and more
View Realmo Analytics
Market
Vacancy Rate% for Multifamily in South region

Questions? Ask Rey
Realmo’s AI knows this listing — price, zoning, demand, history. Ask anything.





Frequently Asked Questions
What type of property is this?
Apartment building - Ground-level condo in 55+ community with green space.
Where is this apartment building located?
The property is located at 120 W BROADWAY #2C BEL Bel Air, MD.
What is the asking price?
The asking price for this property is $290,000.
What are key features of this property?
This property features: Ground level condo with private patio and green space.; 55+ community (Hearthstone at Village Square) with easy access features (elevator, front ramp).; Spacious floor plan with 2 bedrooms and 2 private bathrooms.



