Denver Industrial Property Near
For Sale
Contact for pricing
1865-1877 S Acoma St, Denver, CO
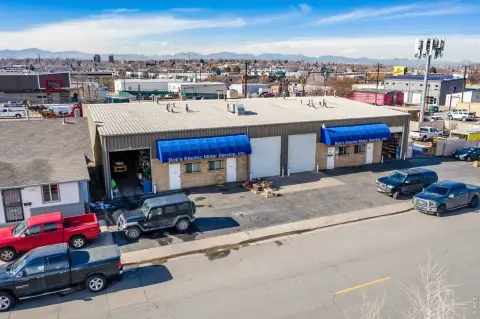
Industrial property near transit with redevelopment potential in Denver, CO.
Property Size5,920 SF
Lot Size0.22 Acres
Price / SF$278.72
Days on Market1078
Property Features for 1865-1877 S Acoma St
General Information
Standard status
Active
Size
5,920 SF
Lot size
0.22 Acres
Property subtype
INDUSTRIAL
Site & Location
Neighborhood
Overland
Listing Agency:
Unique Properties, Inc.
(720) 513-3937
Listed By:
Brad Gilpin · License #EA.100007414
(303) 668-3733
Source:
Moodyscre
Added: Nov 13, 2023
Changed: Oct 25
Last Checked: Oct 24 at 9:12PM
Displayed information is deemed reliable but is not guaranteed and should be independently verified. All listing content including descriptions, pricing, images are the copyrighted material of Unique Properties, Inc.

Ask AI about this property
Review the available facts, identify missing information and prepare questions for the agent.
Investment Insights
Based on property information with market context.
Located near the Evans Station light rail stop, this property is surrounded by multiple mixed-use redevelopments. It is currently zoned I-A industrial in the city and county of Denver, with potential for rezoning to 5-8 story commercial mixed-use. Multiple redevelopment projects are adjacent to and currently underway near the property. The property offers 1,200 to 5,920 square feet available for an owner-user if desired. The building at 1877 S. Acoma St. has 1,200 square feet and is leased short term. The building at 1875 S. Acoma St. has 2,320 square feet and is seller-occupied. The building at 1865 S. Acoma St. has 2,400 square feet and is leased long term. The property includes a potential small, fenced storage yard. It is suitable for plumbers, electricians, HVAC companies, general contractors, service companies, and more. The owner will consider seller-carry terms.
Key Highlights
- T.O.D. location near Evans Station light rail stop.
- Potential rezone to 5‑8 story commercial mixed use.
- Multiple redevelopment projects adjacent and currently underway.
Financial Insights
Estimated NOI and Cap Rate
NOI / Yr
$50,281
Cap Rate
3.05%
Suggested Prices Based on Cap Rates
Cap Rate 5%
$1,005,620
$1.0M
Cap Rate 7%
$718,300
$718.3K
Cap Rate 9%
$558,678
$558.7K
Market Conditions
NOI Build-Up for 5,920 SF
Gross rent
$78.1K $13.20/SF
− Vacancy
−$6.3K −$1.07/SF
EGI
$71.8K $12.13/SF
− OpEx
−$21.5K −$3.64/SF
NOI
$50.3K $8.49/SF
Area
Denver, CO
Vacancy
8.08%
Lease Rate
$13.20 /SF/Yr
Expense Ratio
30.00%
Simulate Cap Rate and NOI
Suggested Prices Based on Cap Rates
Cap Rate 5%
$1,005,620
Cap Rate 7%
$718,300
Cap Rate 9%
$558,678
Alternative Uses
Best Use
Industrial
$718.3K
$628.5K – $838.0K
NOI $50,281 @ 7.0% cap · market cap 3.05%
Second Best
—
—
no second resolved use
Theoretical Best
Office A
$1.88M
$1.65M – $2.20M
NOI $131,918 @ 7.0% cap · market cap 8.00%
Zoning and permitted uses should be independently verified with authorities.
How Realmo checks its estimates
Property Analytics
Contact the owner directly
Get the owner's phone numbers and email
Open Analytics
Current Use
Location Intelligence
Trade Area within ½ mile
1,525
Businesses Nearby
Explore this area
Business Placement
Check the figures for this property
Cap Rate, Value Estimation, Potential NOI and more
View Realmo Analytics
Market
Vacancy Rate% for Industrial in Denver, CO




Frequently Asked Questions
What type of property is this?
Industrial property - Industrial property near transit with redevelopment potential in Denver, CO.
Where is this industrial property located?
The property is located at 1865-1877 S Acoma St Denver, CO.
What is the asking price?
The asking price for this property is $1,650,000.
What are key features of this property?
This property features: T.O.D. location near Evans Station light rail stop.; Potential rezone to 5‑8 story commercial mixed use.; Multiple redevelopment projects adjacent and currently underway.


