Two-Story Commercial Office
For Sale
Contact for pricing
1190 Hylan Blvd, Staten Island, NY 10305
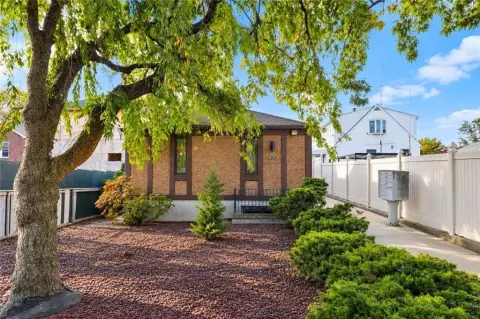
Two-story stucco commercial building with street-to-street access, central air, and forced air heating on a rear-parking lot.
Property Size3,000 SF
Lot Size0.06 Acres
Price / SF$416.30
Days on Market136
Property Features for 1190 Hylan Blvd
General Information
Standard status
Active
Size
3,000 SF
Lot size
0.06 Acres
Property subtype
Office
Zoning
R3-2
Investment Type
Owner/User
Site & Location
Highway Access
Yes
Road Access
Yes
Building Details
Year Built
1987
Buildings
1
Stories
2
Listing Agency:
PreReal Prendamano Real Estate
Listed By:
Robert Nixon · License #10401253010
(718) 816-7799
Source:
Crexi
Added: Jun 11
Changed: Oct 21
Last Checked: Oct 23 at 5:41AM
Displayed information is deemed reliable but is not guaranteed and should be independently verified. All listing content including descriptions, pricing, images are the copyrighted material of PreReal Prendamano Real Estate

Ask AI about this property
Review the available facts, identify missing information and prepare questions for the agent.
Investment Insights
Based on property information with market context.
Offered for sale is a rarely available two-story stucco commercial building featuring direct street-to-street access. The building spans two levels and is configured to support flexible occupancy, including the option for an owner-user to occupy the entire building or occupy one floor while leasing the other. A Certificate of Occupancy is in place, and the interior is equipped with central air and forced air heating throughout, supporting immediate move-in readiness for suitable commercial users.
The property is located at 1190 Hylan Boulevard in Dongan Hills, with parking in the rear. It sits on a 20 ft × 128 ft lot and is minutes from the Verrazzano-Narrows Bridge, the Staten Island Expressway, and the Staten Island Railway’s Dongan Hills station, providing access across Staten Island and into Brooklyn.
With its two-level layout, independent street-to-street access, and complete mechanical systems, the building is positioned for tenants seeking a straightforward, move-in-ready commercial space.
The property is located at 1190 Hylan Boulevard in Dongan Hills, with parking in the rear. It sits on a 20 ft × 128 ft lot and is minutes from the Verrazzano-Narrows Bridge, the Staten Island Expressway, and the Staten Island Railway’s Dongan Hills station, providing access across Staten Island and into Brooklyn.
With its two-level layout, independent street-to-street access, and complete mechanical systems, the building is positioned for tenants seeking a straightforward, move-in-ready commercial space.
Key Highlights
- 2‑story 3,000 SF stucco commercial building at 1190 Hylan Boulevard (built 1987)
- Direct street‑to‑street access and rear parking lot
- Central air and forced air heating throughout; Certificate of Occupancy in place
Financial Insights
Estimated NOI and Cap Rate
NOI / Yr
$84,522
Cap Rate
6.77%
Suggested Prices Based on Cap Rates
Cap Rate 5%
$1,690,440
$1.7M
Cap Rate 7%
$1,207,457
$1.2M
Cap Rate 9%
$939,133
$939.1K
Market Conditions
NOI Build-Up for 3,000 SF
Gross rent
$139.0K $46.32/SF
− Vacancy
−$26.3K −$8.75/SF
EGI
$112.7K $37.57/SF
− OpEx
−$28.2K −$9.39/SF
NOI
$84.5K $28.17/SF
Area
ZIP 10305
Vacancy
18.90%
Lease Rate
$46.32 /SF/Yr
Expense Ratio
25.00%
Simulate Cap Rate and NOI
Suggested Prices Based on Cap Rates
Cap Rate 5%
$1,690,440
Cap Rate 7%
$1,207,457
Cap Rate 9%
$939,133
Alternative Uses
Best Use
Office B
$1.21M
$1.06M – $1.41M
NOI $84,522 @ 7.0% cap · market cap 6.77%
Second Best
—
—
no second resolved use
Theoretical Best
Office A
$1.43M
$1.25M – $1.67M
NOI $100,201 @ 7.0% cap · market cap 8.02%
Zoning and permitted uses should be independently verified with authorities.
How Realmo checks its estimates
Property Analytics
Unlock full access to Insights
Subscribe to Realmo Intelligence
Open Analytics
Current Use
Lease Details
Yes
Highway access
Yes
Paved road access
Location Intelligence
Trade Area within ½ mile
1,348
Businesses Nearby
Explore this area
Business Placement
Demographics for 10305, NY
44,008
Population
16,850
Households
2.6
Avg Household Size
41
Median Age
32%
College-Educated
85%
High-School Grad
4.0 sq mi
ZIP Area
11,002
Density / Sq Mi
$86,294
Median Household Income
$52,183
Median Earnings
$1,656
Median Rent
$627,200
Median Home Value
Check the figures for this property
Cap Rate, Value Estimation, Potential NOI and more
View Realmo Analytics
Market
Vacancy Rate% for Office in Northeast region





Frequently Asked Questions
What type of property is this?
Office building - Two-story stucco commercial building with street-to-street access, central air, and forced air heating on a rear-parking lot.
Where is this office building located?
The property is located at 1190 Hylan Blvd Staten Island, NY.
What is the asking price?
The asking price for this property is $1,248,888.
What are key features of this property?
This property features: 2‑story 3,000 SF stucco commercial building at 1190 Hylan Boulevard (built 1987); Direct street‑to‑street access and rear parking lot; Central air and forced air heating throughout; Certificate of Occupancy in place


