Garden District Mixed-Use
For Sale
$925,000
1418 Magazine St, New Orleans, LA 70130
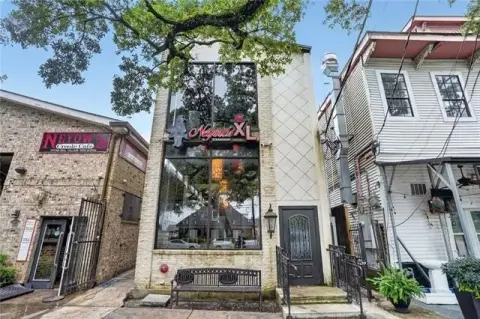
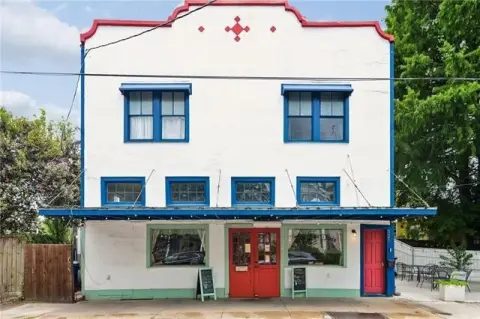
Mixed-use property in the Garden District with commercial and residential units.
Property Size3,174 SF
Price / SF$291.43
Days on Market320
Property Features for 1418 Magazine St
General Information
Standard status
Active
Size
3,174 SF
Property subtype
Retail
Building Details
Building Size
3,174 SF
Year Built
1870
Listed By:
Eli Gunesebakan, CCIM, SIOR
(504) 401-4900
Source:
Naiglobal
Added: Nov 21, 2025
Changed: Oct 6
Last Checked: Oct 5 at 5:35PM
Displayed information is deemed reliable but is not guaranteed and should be independently verified. All listing content including descriptions, pricing, images are the copyrighted material of Eli Gunesebakan, CCIM, SIOR
Investment Insights
Based on property information with market context.
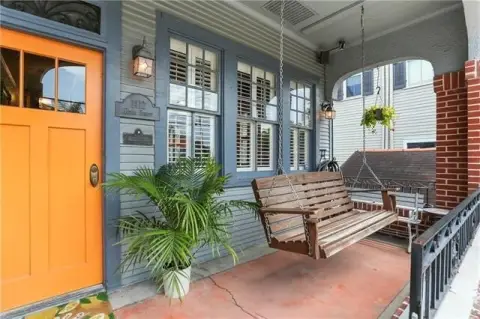
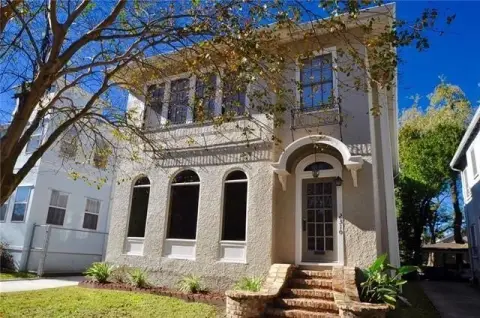
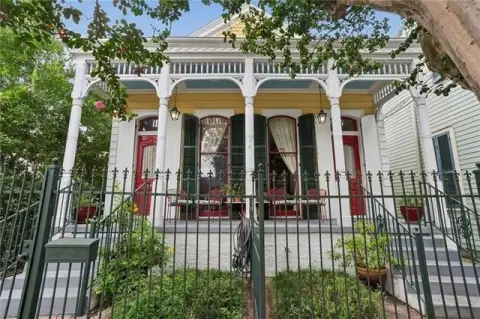
The property at 1418 Magazine St is a mixed-use building featuring three fully occupied units: one commercial and two residential. The downstairs unit is leased to Surrey's Cafe, a restaurant that has been in operation for over 18 years, with the current lease extending through 2026. The two residential units occupy the entire second floor, each including balconies and exterior space that overlook Magazine Street. The property is located in the Garden District, offering close proximity to the New Orleans CBD and major tourism locations. The property is fully occupied and has potential for rent increases. The property size is 3174 square feet.
Key Highlights
- Prime Garden District location on Magazine Street
- Mixed‑use property with commercial and residential units
- Fully occupied with established tenant (Surrey's Cafe) leased through 2026
Financial Insights
Estimated NOI and Cap Rate
NOI / Yr
$44,791
Cap Rate
4.84%
Suggested Prices Based on Cap Rates
Cap Rate 5%
$895,820
$895.8K
Cap Rate 7%
$639,871
$639.9K
Cap Rate 9%
$497,678
$497.7K
Market Conditions
NOI Build-Up for 3,174 SF
Gross rent
$60.9K $19.20/SF
− Vacancy
−$1.2K −$0.38/SF
EGI
$59.7K $18.82/SF
− OpEx
−$14.9K −$4.70/SF
NOI
$44.8K $14.11/SF
Area
New Orleans, LA
Vacancy
2.00%
Lease Rate
$19.20 /SF/Yr
Expense Ratio
25.00%
Simulate Cap Rate and NOI
Suggested Prices Based on Cap Rates
Cap Rate 5%
$895,820
Cap Rate 7%
$639,871
Cap Rate 9%
$497,678
Alternative Uses
Best Use
Specialty Retail
$639.9K
$559.9K – $746.5K
NOI $44,791 @ 7.0% cap · market cap 4.84%
Second Best
Mixed Use
$612.1K
$535.6K – $714.2K
NOI $42,849 @ 7.0% cap · market cap 4.63%
Theoretical Best
Office A
$806.7K
$705.9K – $941.2K
NOI $56,471 @ 7.0% cap · market cap 6.10%
Zoning and permitted uses should be independently verified with authorities.
Property Analytics
Unlock full access to Insights
Subscribe to Realmo Intelligence
Open Analytics
Current Use
Location Intelligence
Trade Area within ½ mile
2,416
Businesses Nearby
Under-served
Demand for This Use
Explore this area
Business Placement
Demographics for 70130, LA
14,521
Population
10,927
Households
1.3
Avg Household Size
38
Median Age
64%
College-Educated
92%
High-School Grad
2.1 sq mi
ZIP Area
6,915
Density / Sq Mi
$82,758
Median Household Income
$52,492
Median Earnings
$1,410
Median Rent
$529,300
Median Home Value
Check the figures for this property
Cap Rate, Value Estimation, Potential NOI and more
View Realmo Analytics
Market
Vacancy Rate% for Multifamily in South region

Questions? Ask Rey
Realmo’s AI knows this listing — price, zoning, demand, history. Ask anything.





Frequently Asked Questions
What type of property is this?
Conventional restaurant - Mixed-use property in the Garden District with commercial and residential units.
Where is this conventional restaurant located?
The property is located at 1418 Magazine St New Orleans, LA.
What is the asking price?
The asking price for this property is $925,000.
What are key features of this property?
This property features: Prime Garden District location on Magazine Street; Mixed‑use property with commercial and residential units; Fully occupied with established tenant (Surrey's Cafe) leased through 2026