Historic Office Building and
For Sale
$2,775,000
1117 Hillsborough, Raleigh, NC 27603
Two-story historic office building and duplex with parking lot.
Property Size6,342 SF
Price / SF$437.56
Days on Market522
Property Features for 1117 Hillsborough
General Information
Standard status
Active
Size
6,342 SF
Taxes and HOA fees
Annual Taxes
$11,163
Building Details
Year Built
1920
Listing Agency:
LEE&ASSOCIATES RALEIGH DURHAM
Listed By:
JAMES BAILEY
Source:
Corcoran
Added: May 12, 2025
Changed: Mar 16
Last Checked: Apr 12 at 7:51PM
Displayed information is deemed reliable but is not guaranteed and should be independently verified. All listing content including descriptions, pricing, images are the copyrighted material of LEE&ASSOCIATES RALEIGH DURHAM
Investment Insights
Based on property information with market context.
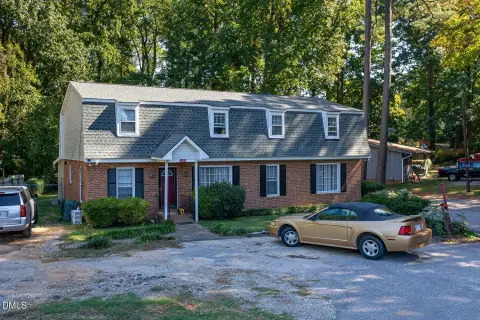
The offering includes a ±4,513 SF two-and-one-half story historic office building at 1117 Hillsborough Street, known as the "John W. Thompson House," and a ±1,829 SF duplex at 920 West Morgan Street, along with an on-site parking lot. The properties are located in Downtown Raleigh, with frontage on Hillsborough Street and West Morgan Street, situated midway between North Carolina State University, the Downtown Business District, and Glenwood South. The Thompson House, built in 1920 with significant renovations completed in 2004-2005, has historical significance as the residence of John W. Thompson, a noted Raleigh judge and civic leader from 1914 to 1934. It also housed the National Opera Company from the early 1950s until 2000. The total land area is ±0.48 acres. The properties are zoned NX-3 and have a private parking lot with 16 dedicated spaces, plus street parking for the office building, and a private parking lot with 4 dedicated spaces, plus street parking for the duplex. The duplex is fully occupied and includes one unit with 1 bed/1 bath and another with 3 beds/1 bath. Electricity is provided by Duke Energy, and water and sewer services are provided by the City of Raleigh.
Key Highlights
- Trophy location in Downtown Raleigh with frontage on Hillsborough Street and West Morgan Street.
- Includes two properties: a ±4,513 SF historic Thompson House office building and a ±1,829 SF duplex.
- On‑site private parking lot with 20 spaces plus street parking.
Financial Insights
Estimated NOI and Cap Rate
NOI / Yr
$95,743
Cap Rate
3.45%
Suggested Prices Based on Cap Rates
Cap Rate 5%
$1,914,860
$1.9M
Cap Rate 7%
$1,367,757
$1.4M
Cap Rate 9%
$1,063,811
$1.1M
Market Conditions
NOI Build-Up for 6,342 SF
Gross rent
$165.1K $26.04/SF
− Vacancy
−$37.5K −$5.91/SF
EGI
$127.7K $20.13/SF
− OpEx
−$31.9K −$5.03/SF
NOI
$95.7K $15.10/SF
Area
ZIP 27603
Vacancy
22.70%
Lease Rate
$26.04 /SF/Yr
Expense Ratio
25.00%
Simulate Cap Rate and NOI
Suggested Prices Based on Cap Rates
Cap Rate 5%
$1,914,860
Cap Rate 7%
$1,367,757
Cap Rate 9%
$1,063,811
Alternative Uses
Best Use
Office B
$1.37M
$1.20M – $1.60M
NOI $95,743 @ 7.0% cap · market cap 3.45%
Second Best
Multifamily LT 5
$974.0K
$852.2K – $1.14M
NOI $68,179 @ 7.0% cap · market cap 2.46%
Theoretical Best
Office A
$2.01M
$1.76M – $2.34M
NOI $140,424 @ 7.0% cap · market cap 5.06%
Zoning and permitted uses should be independently verified with authorities.
How Realmo checks its estimates
Property Analytics
Unlock full access to Insights
Subscribe to Realmo Intelligence
Open Analytics
Current Use
Location Intelligence
Trade Area within ½ mile
2,388
Businesses Nearby
Explore this area
Business Placement
Demographics for 27603, NC
54,616
Population
24,030
Households
2.3
Avg Household Size
34
Median Age
48%
College-Educated
94%
High-School Grad
51.4 sq mi
ZIP Area
1,063
Density / Sq Mi
$87,939
Median Household Income
$51,856
Median Earnings
$1,496
Median Rent
$347,000
Median Home Value
Check the figures for this property
Cap Rate, Value Estimation, Potential NOI and more
View Realmo Analytics
Market
Vacancy Rate% for Office in South region

Questions? Ask Rey
Realmo’s AI knows this listing — price, zoning, demand, history. Ask anything.






Frequently Asked Questions
What type of property is this?
Office building - Two-story historic office building and duplex with parking lot.
Where is this office building located?
The property is located at 1117 Hillsborough Raleigh, NC.
What is the asking price?
The asking price for this property is $2,775,000.
What are key features of this property?
This property features: Trophy location in Downtown Raleigh with frontage on Hillsborough Street and West Morgan Street.; Includes two properties: a ±4,513 SF historic Thompson House office building and a ±1,829 SF duplex.; On‑site private parking lot with 20 spaces plus street parking.


