Historic Cape Cod Mixed-Use
For Sale
$799,000
1424 Main St, Brewster, MA 02631
Charming 1880 mixed-use property with antique shop and residence.
Property Size3,021 SF
Price / SF$264.48
Days on Market513
Property Features for 1424 Main St
General Information
Standard status
Active
Size
3,021 SF
Taxes and HOA fees
Annual Taxes
$4,039
Building Details
Year Built
1880
Listing Agency:
William Raveis R.E. & Home Services
Listed By:
Ginny Guimond
Source:
Corcoran
Added: May 19, 2025
Changed: Mar 16
Last Checked: Mar 16 at 9:08AM
Displayed information is deemed reliable but is not guaranteed and should be independently verified. All listing content including descriptions, pricing, images are the copyrighted material of William Raveis R.E. & Home Services
Investment Insights
Based on property information with market context.
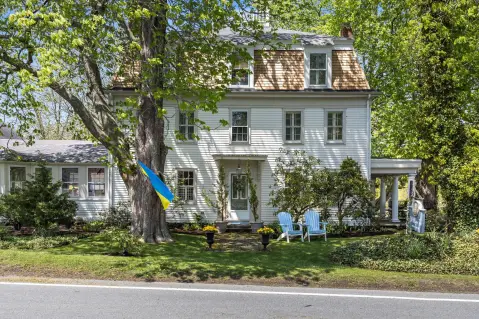
This mixed-use property, built in 1880, is located on over 2 acres along Route 6A in Brewster, known as the "Sea Captain's Town." It includes a detached antique shop storefront, suitable for a studio, workshop, or retail space. The main house features 3 bedrooms, original wood floors, an eat-in kitchen, and a living room. The property, requiring restoration, offers a chance to revive its historic charm. It provides access to the Cape Cod Rail Trail, Crosby Landing Beach, and Brewster's shops and restaurants. The property offers potential as a year-round residence, a summer retreat, or a live/work opportunity. The building size is 3021 square feet.
Key Highlights
- Historic 1880 property on over 2 acres in desirable Brewster, Cape Cod.
- Includes a detached antique shop storefront suitable for studio, workshop, or retail.
- Mixed‑use property offering live/work opportunity with endless potential.
Financial Insights
Estimated NOI and Cap Rate
NOI / Yr
$62,045
Cap Rate
7.77%
Suggested Prices Based on Cap Rates
Cap Rate 5%
$1,240,900
$1.2M
Cap Rate 7%
$886,357
$886.4K
Cap Rate 9%
$689,389
$689.4K
Market Conditions
NOI Build-Up for 3,021 SF
Gross rent
$90.6K $30.00/SF
− Vacancy
−$2.0K −$0.66/SF
EGI
$88.6K $29.34/SF
− OpEx
−$26.6K −$8.80/SF
NOI
$62.0K $20.54/SF
Area
Barnstable County, MA
Vacancy
2.20%
Lease Rate
$30.00 /SF/Yr
Expense Ratio
30.00%
Simulate Cap Rate and NOI
Suggested Prices Based on Cap Rates
Cap Rate 5%
$1,240,900
Cap Rate 7%
$886,357
Cap Rate 9%
$689,389
Alternative Uses
Best Use
Retail
$886.4K
$775.6K – $1.03M
NOI $62,045 @ 7.0% cap · market cap 7.77%
Second Best
Mixed Use
$602.0K
$526.8K – $702.4K
NOI $42,143 @ 7.0% cap · market cap 5.27%
Theoretical Best
Office A
$1.23M
$1.08M – $1.44M
NOI $86,175 @ 7.0% cap · market cap 10.79%
Zoning and permitted uses should be independently verified with authorities.
How Realmo checks its estimates
Property Analytics
Unlock full access to Insights
Subscribe to Realmo Intelligence
Open Analytics
Current Use
Location Intelligence
Trade Area within ½ mile
92
Businesses Nearby
Balanced
Demand for This Use
Explore this area
Business Placement
Demographics for 02631, MA
10,178
Population
8,215
Households
1.2
Avg Household Size
58
Median Age
52%
College-Educated
98%
High-School Grad
22.2 sq mi
ZIP Area
458
Density / Sq Mi
$93,427
Median Household Income
$47,395
Median Earnings
$1,386
Median Rent
$621,800
Median Home Value
Check the figures for this property
Cap Rate, Value Estimation, Potential NOI and more
View Realmo Analytics
Market
Vacancy Rate% for Retail in Northeast region

Questions? Ask Rey
Realmo’s AI knows this listing — price, zoning, demand, history. Ask anything.






Frequently Asked Questions
What type of property is this?
Storefront property - Charming 1880 mixed-use property with antique shop and residence.
Where is this storefront property located?
The property is located at 1424 Main St Brewster, MA.
What is the asking price?
The asking price for this property is $799,000.
What are key features of this property?
This property features: Historic 1880 property on over 2 acres in desirable Brewster, Cape Cod.; Includes a detached antique shop storefront suitable for studio, workshop, or retail.; Mixed‑use property offering live/work opportunity with endless potential.


