Santa Clara Multifamily Investment
For Sale
$2,290,000
2070 Sahara Way, Santa Clara, CA 95050
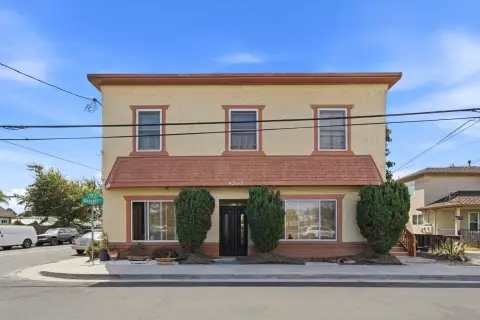
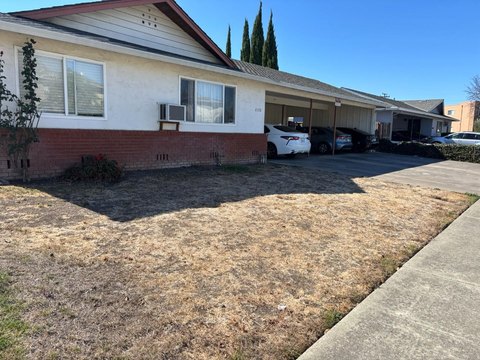
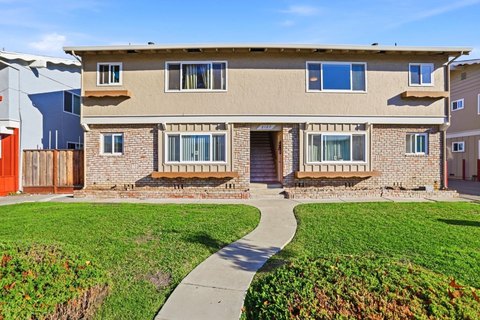
Well-maintained, upgraded five-unit multifamily property in Santa Clara.
Property Size4,264 SF
Price / SF$537.05
Days on Market544
Property Features for 2070 Sahara Way
General Information
Standard status
Active
Size
4,264 SF
Building Details
Year Built
1960
Listing Agency:
MARCUS & MILLICHAP
Listed By:
JIMMY CASTELLANOS
Source:
Corcoran
Added: Apr 22, 2025
Changed: Mar 16
Last Checked: Mar 16 at 9:09AM
Displayed information is deemed reliable but is not guaranteed and should be independently verified. All listing content including descriptions, pricing, images are the copyrighted material of MARCUS & MILLICHAP

Ask AI about this property
Review the available facts, identify missing information and prepare questions for the agent.
Investment Insights
Based on property information with market context.
Located in Santa Clara, this well-maintained and recently upgraded five-unit multifamily community presents an investment opportunity. The property benefits from its location in one of Silicon Valley's dynamic and rapidly growing cities, supported by a strong employment base anchored by Fortune 500 companies such as Intel, Google, and NVIDIA, whose global headquarters is located minutes from the property. The property has a strong in-place cap rate of 4.81% and generates $13,500 of gross monthly income. The property has a new electrical main panel and new sub-panels. The property size is 4,264 square feet. Santa Clara provides a landlord-friendly environment that enables investors to achieve market rents within a favorable economic timeline due to the absence of city-level rent control.
Key Highlights
- Strong in‑place cap rate of 4.81% and $13,500 gross monthly income.
- Located in Santa Clara, a rapidly growing Silicon Valley city with a strong employment base (Intel, Google, NVIDIA).
- No city‑level rent control, creating a landlord‑friendly environment.
Financial Insights
Estimated NOI and Cap Rate
NOI / Yr
$80,643
Cap Rate
3.52%
Suggested Prices Based on Cap Rates
Cap Rate 5%
$1,612,860
$1.6M
Cap Rate 7%
$1,152,043
$1.2M
Cap Rate 9%
$896,033
$896.0K
Market Conditions
NOI Build-Up for 4,264 SF
Gross rent
$154.0K $36.12/SF
− Vacancy
−$7.4K −$1.73/SF
EGI
$146.6K $34.39/SF
− OpEx
−$66.0K −$15.47/SF
NOI
$80.6K $18.91/SF
Area
Santa Clara, CA
Vacancy
4.80%
Lease Rate
$36.12 /SF/Yr
Expense Ratio
45.00%
Simulate Cap Rate and NOI
Suggested Prices Based on Cap Rates
Cap Rate 5%
$1,612,860
Cap Rate 7%
$1,152,043
Cap Rate 9%
$896,033
Alternative Uses
Best Use
Apartment 5plus
$1.15M
$1.01M – $1.34M
NOI $80,643 @ 7.0% cap · market cap 3.52%
Second Best
—
—
no second resolved use
Theoretical Best
Office A
$2.57M
$2.25M – $3.00M
NOI $180,197 @ 7.0% cap · market cap 7.87%
Zoning and permitted uses should be independently verified with authorities.
How Realmo checks its estimates
Property Analytics
Unlock full access to Insights
Subscribe to Realmo Intelligence
Open Analytics
Current Use
Location Intelligence
Trade Area within ½ mile
1,616
Businesses Nearby
Explore this area
Business Placement
Demographics for 95050, CA
39,031
Population
16,674
Households
2.3
Avg Household Size
35
Median Age
54%
College-Educated
92%
High-School Grad
5.5 sq mi
ZIP Area
7,097
Density / Sq Mi
$130,051
Median Household Income
$73,578
Median Earnings
$2,522
Median Rent
$1,420,500
Median Home Value
Check the figures for this property
Cap Rate, Value Estimation, Potential NOI and more
View Realmo Analytics
Market
Vacancy Rate% for Multifamily in West region





Frequently Asked Questions
What type of property is this?
Apartment building - Well-maintained, upgraded five-unit multifamily property in Santa Clara.
Where is this apartment building located?
The property is located at 2070 Sahara Way Santa Clara, CA.
What is the asking price?
The asking price for this property is $2,290,000.
What are key features of this property?
This property features: Strong in‑place cap rate of 4.81% and $13,500 gross monthly income.; Located in Santa Clara, a rapidly growing Silicon Valley city with a strong employment base (Intel, Google, NVIDIA).; No city‑level rent control, creating a landlord‑friendly environment.


