Detached Two-Family
For Sale
$849,999
Pending
1163 Virginia Avenue, Bronx, NY 10472
Residential Income, Bronx, NY
Property SizeContact for details
Lot Size0.06 Acres
Days on Market189
Property Features for 1163 Virginia Avenue
General Information
Property type
Residential Multi Family
Property subtype
Duplex
Bedrooms
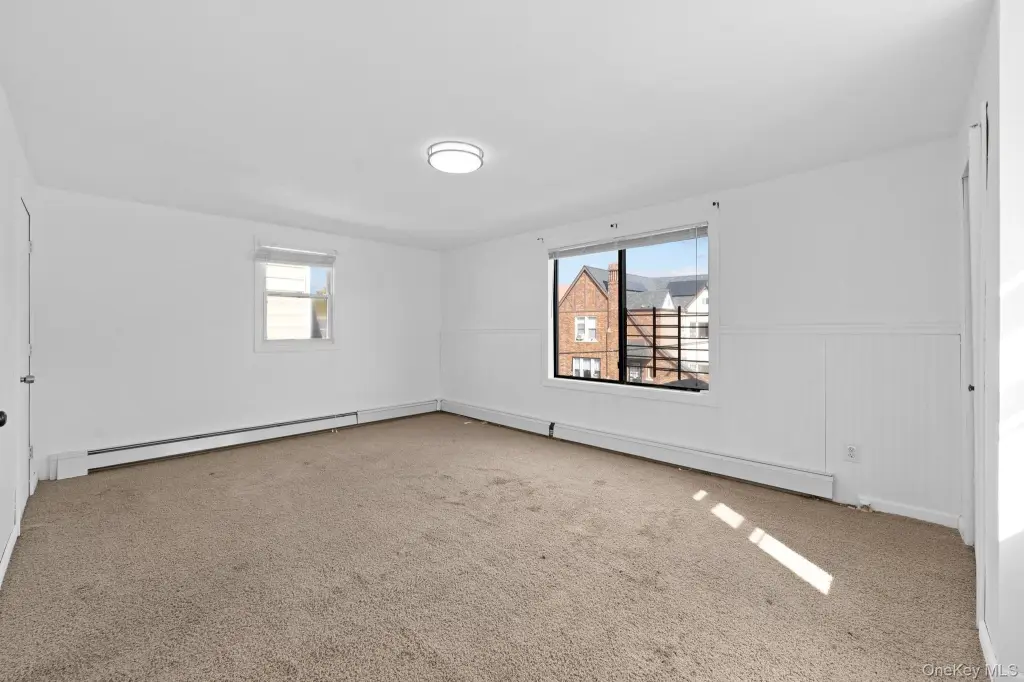
5
Bathrooms
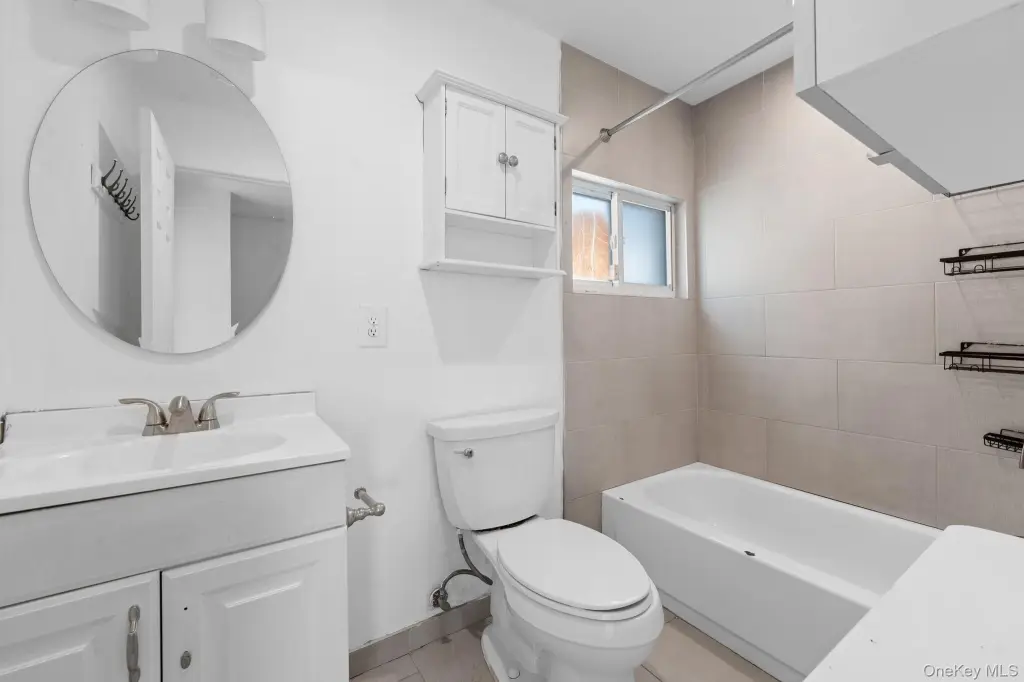
3
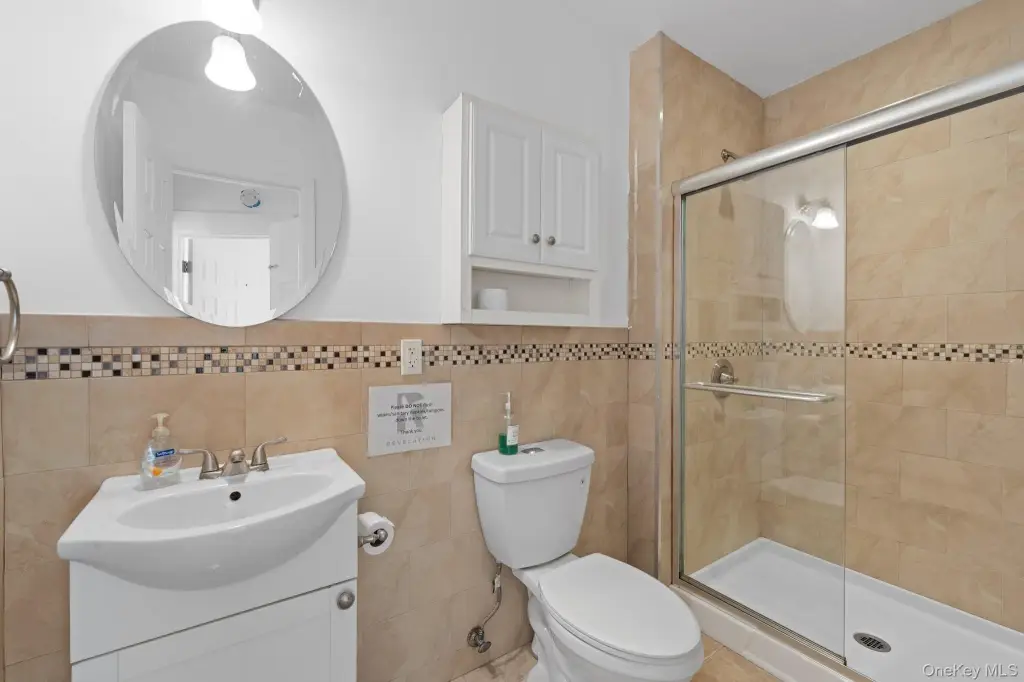
Full bathrooms
3
Rooms
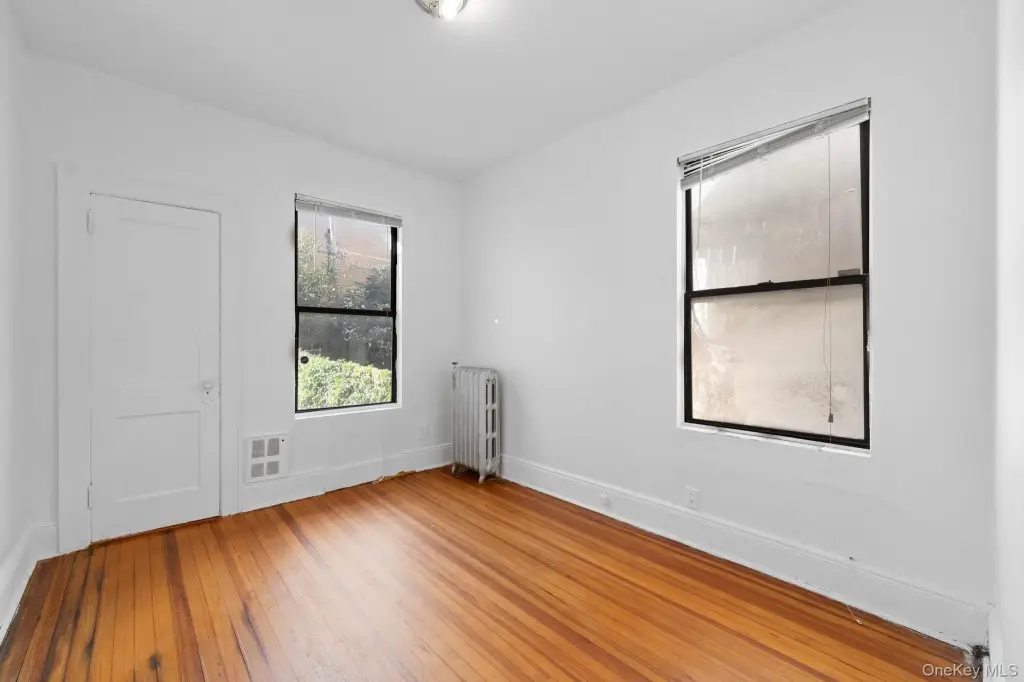
Bathroom 1, Bedroom 1, Bedroom 5, Bedroom 2, Bedroom 4, Bedroom 3, Bathroom 3, Bathroom 2
Parking features
On Street
Interior features
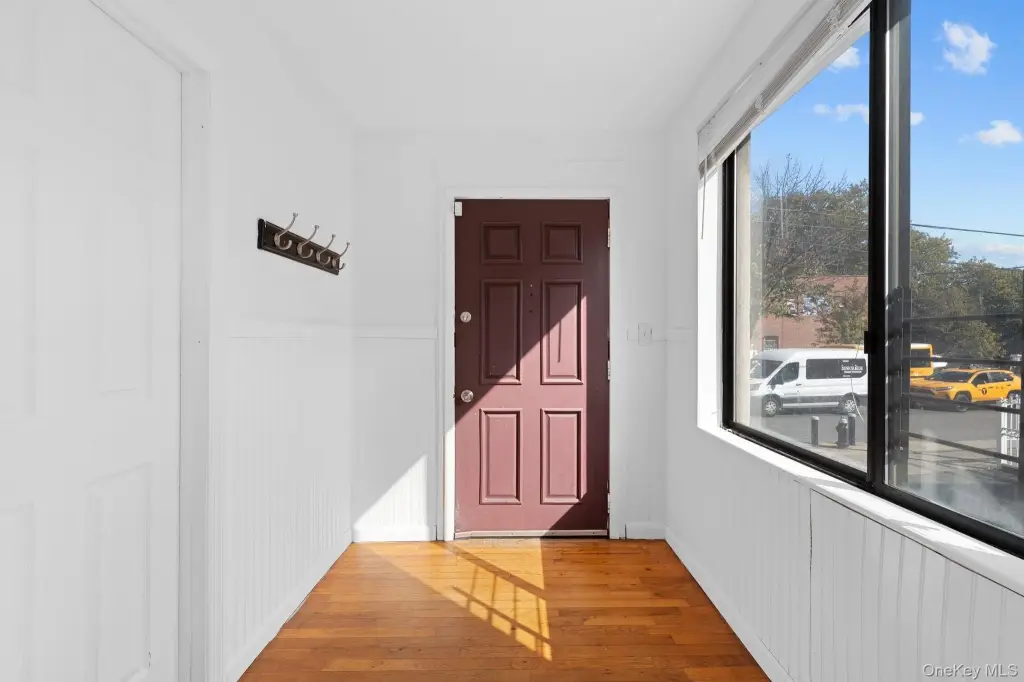
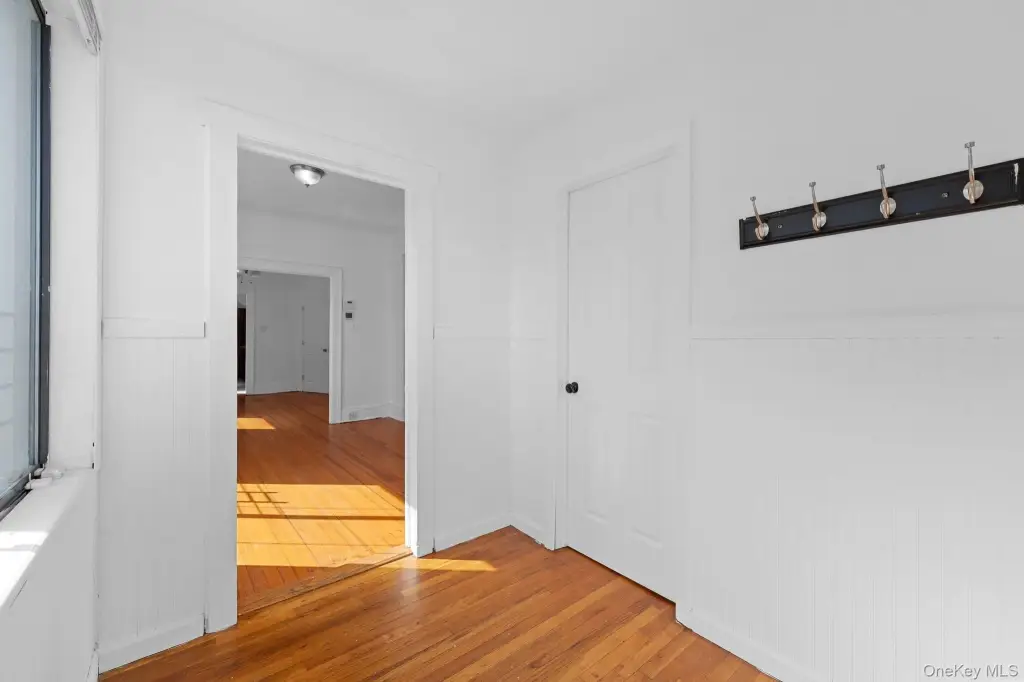
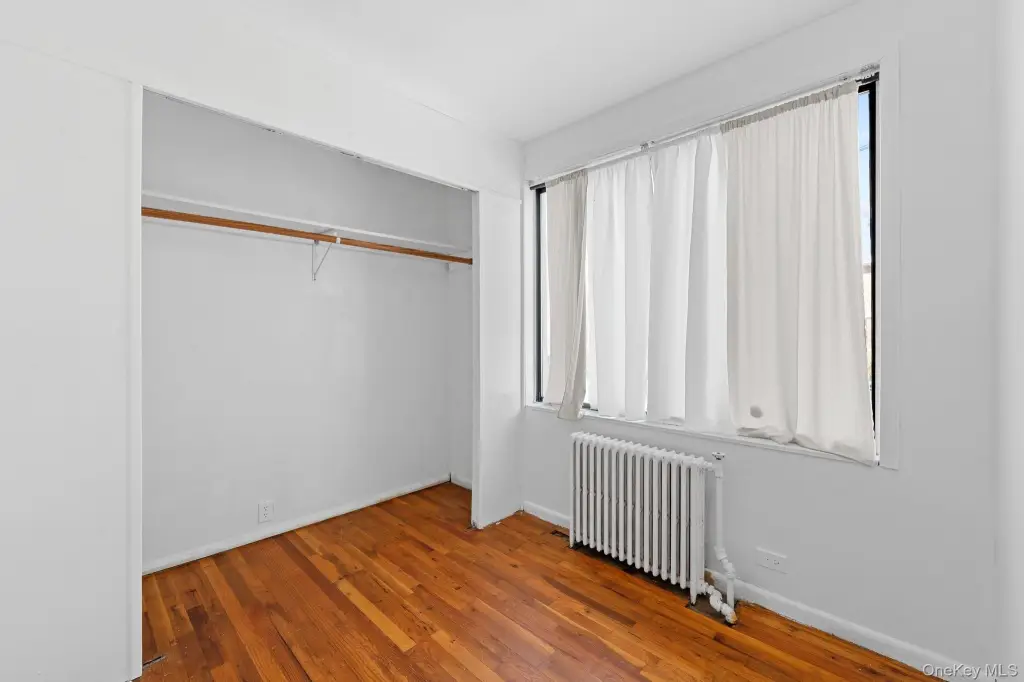
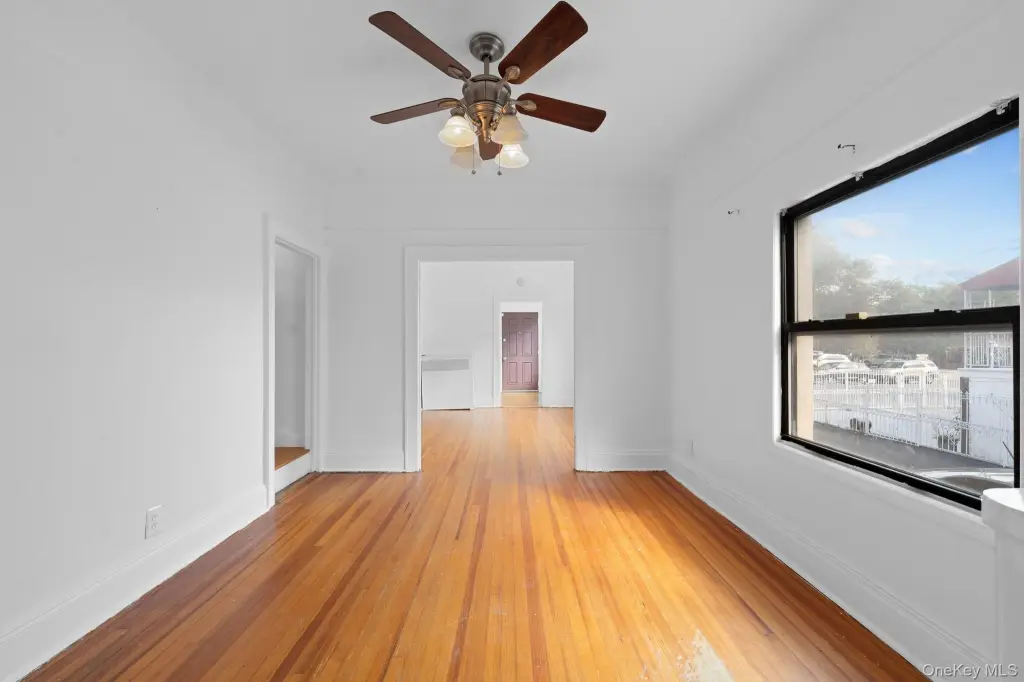
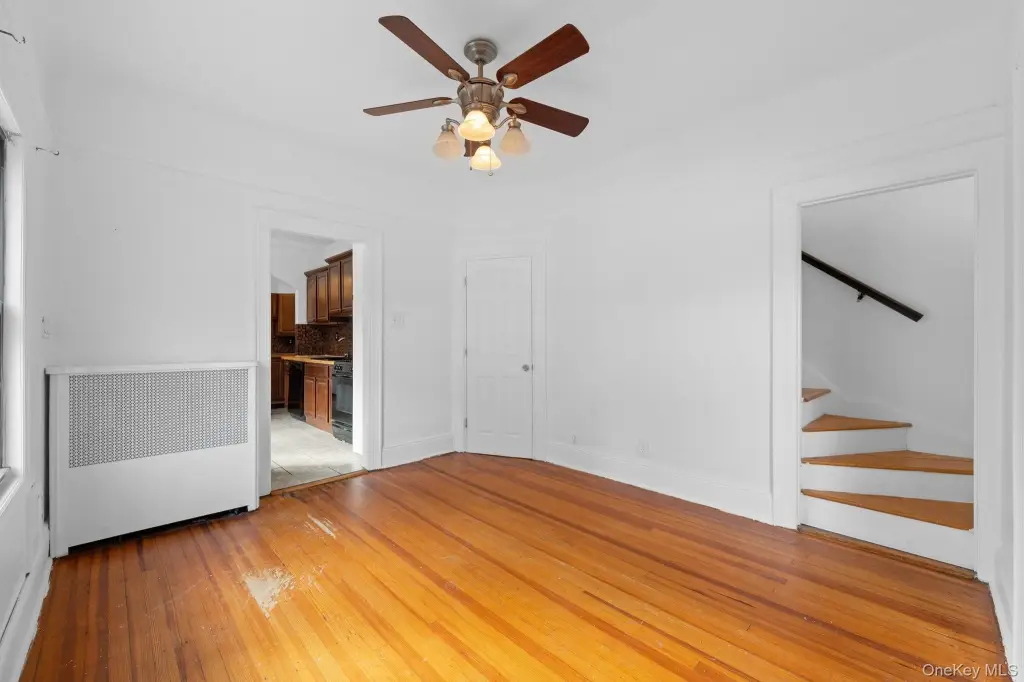
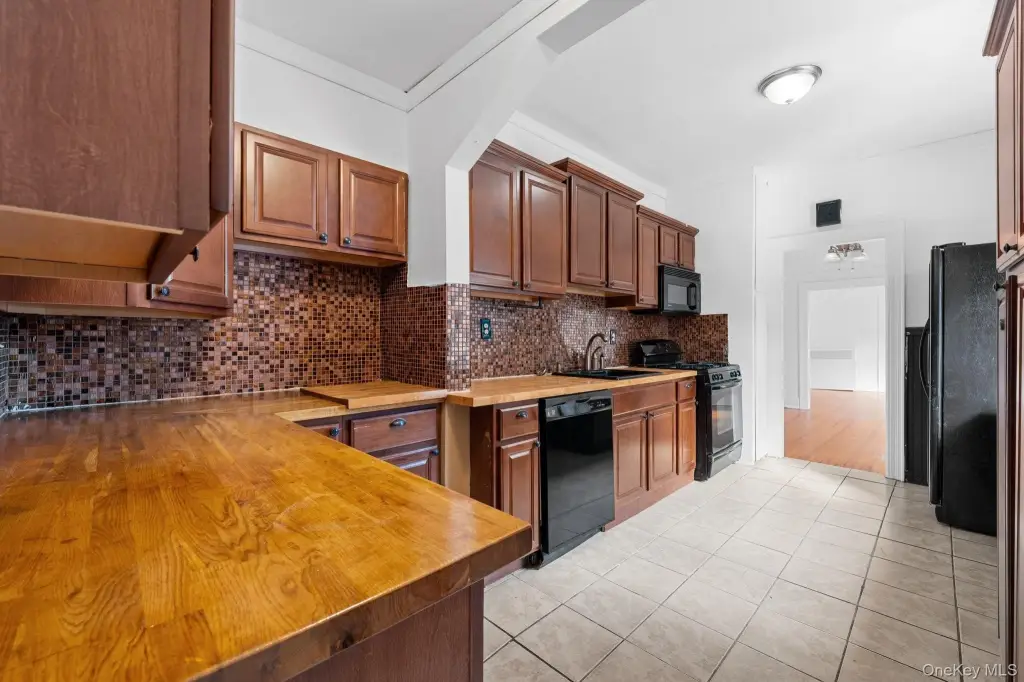
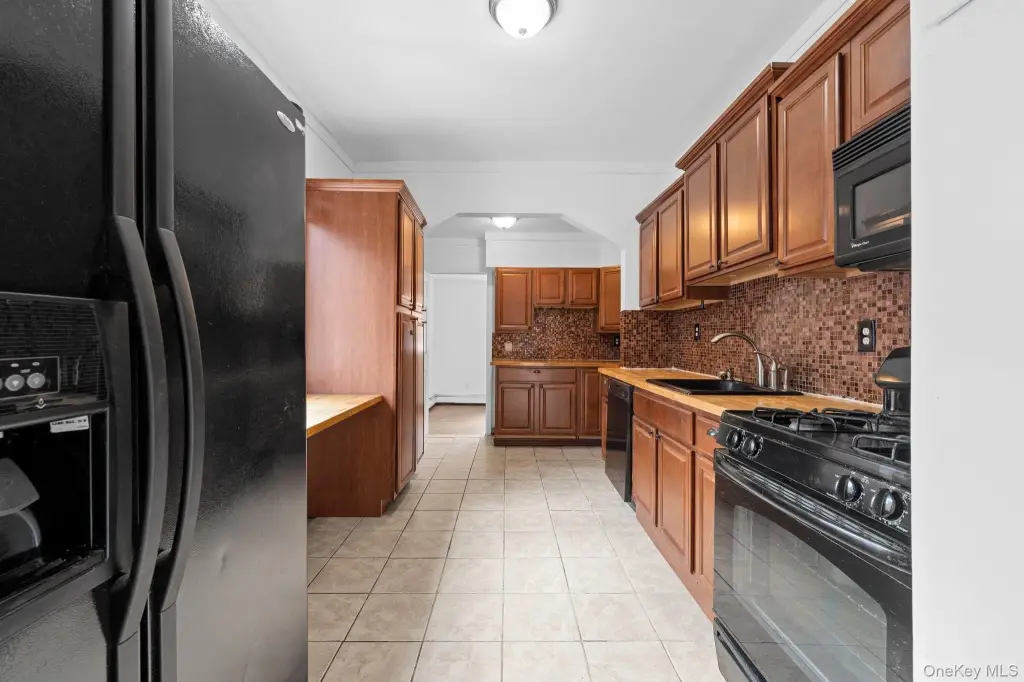
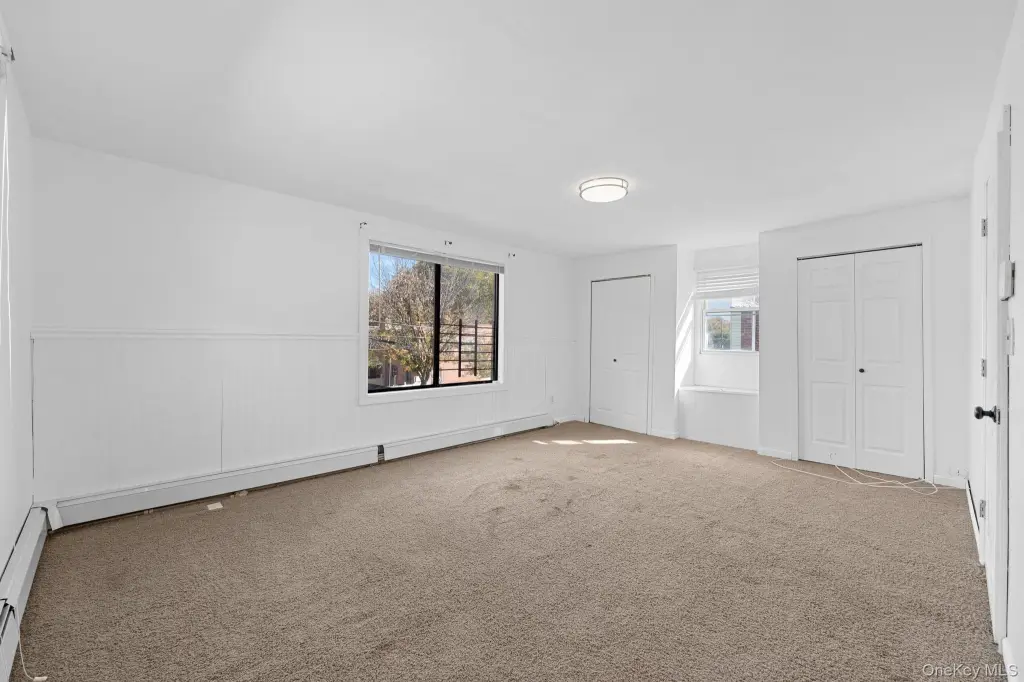
First Floor Bedroom, First Floor Full Bath, Entrance Foyer, Walk Through Kitchen, Walk-In Closet(s)
Lot features
Back Yard, Near Public Transit, Near School, Near Shops
Elementary school
Contact Agent
Middle school
Call Listing Agent
High school
Contact Agent
Elementary school district
Contact Agent
Middle school district
Contact Agent
High school district
Contact Agent
Directions
UNIONPORT neighborhood - from White Plains Road make a right onto Watson Avenue and then make a left onto Virginia Avenue (Between Gleason Avenue and Powell Avenue)
Special listing conditions
Third Party Approval
Standard status
Pending
APN
03759-0047
Lot size
0.06 Acres
Taxes and HOA fees
Tax Year
2025
Utilities
Sewer type
Public Sewer
Heating system
Radiant, Baseboard
Cooling system
Window Unit(s), Wall/Window Unit(s)
Water source
Public
Building Details
Year built
1920
Number of units
2
Flooring type
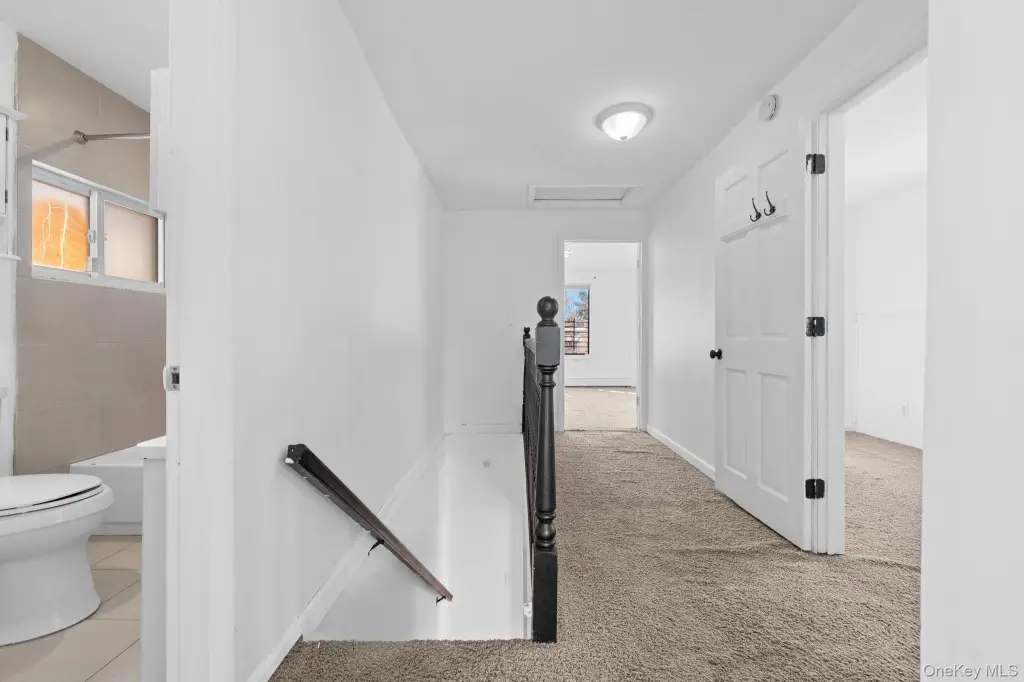
Hardwood, Carpet
Building materials
Stucco
Listing Agency:
Keller Williams Realty NYC Grp
(718) 697-6800
Listed By:
Vanessa Villanueva · License #10401253505
(917) 557-5302
Added: Apr 2
Changed: Oct 5
Last Checked: Oct 7 at 1:06AM
MLS# 924220
Copyright © 2026 OneKey MLS. All rights reserved. All information provided by the listing agent/broker is deemed reliable but is not guaranteed and should be independently verified.
Investment Insights
Based on property information with market context.
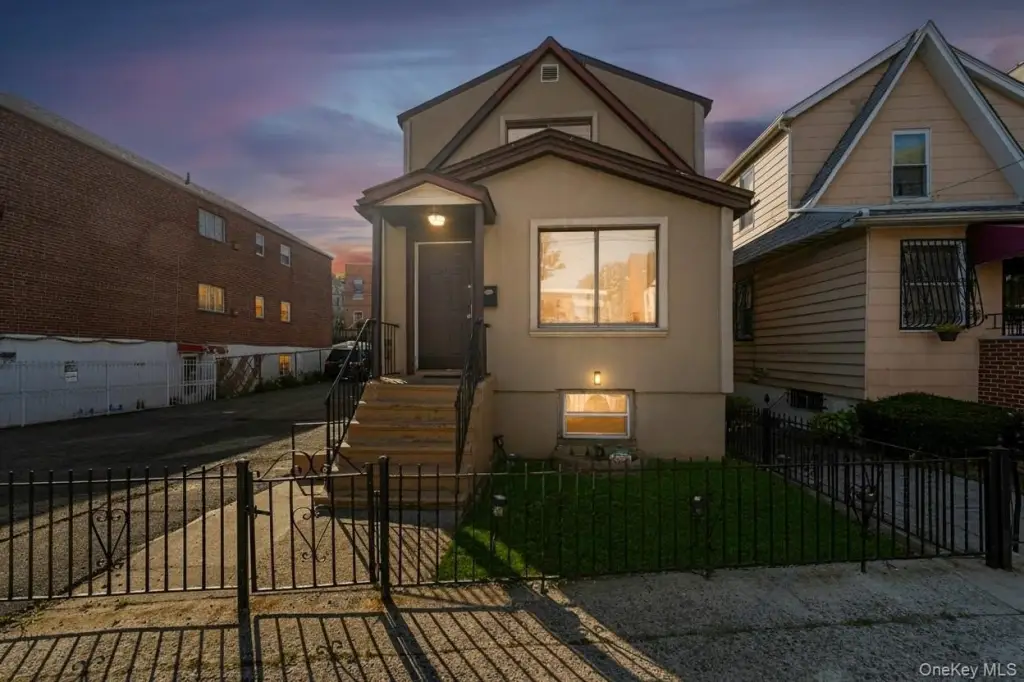
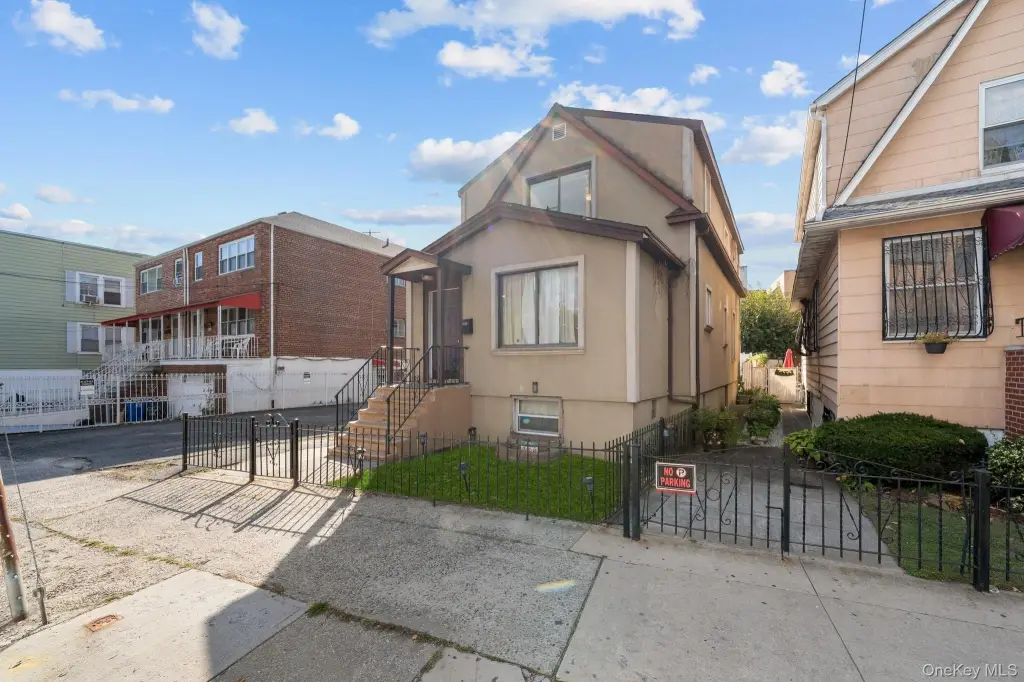
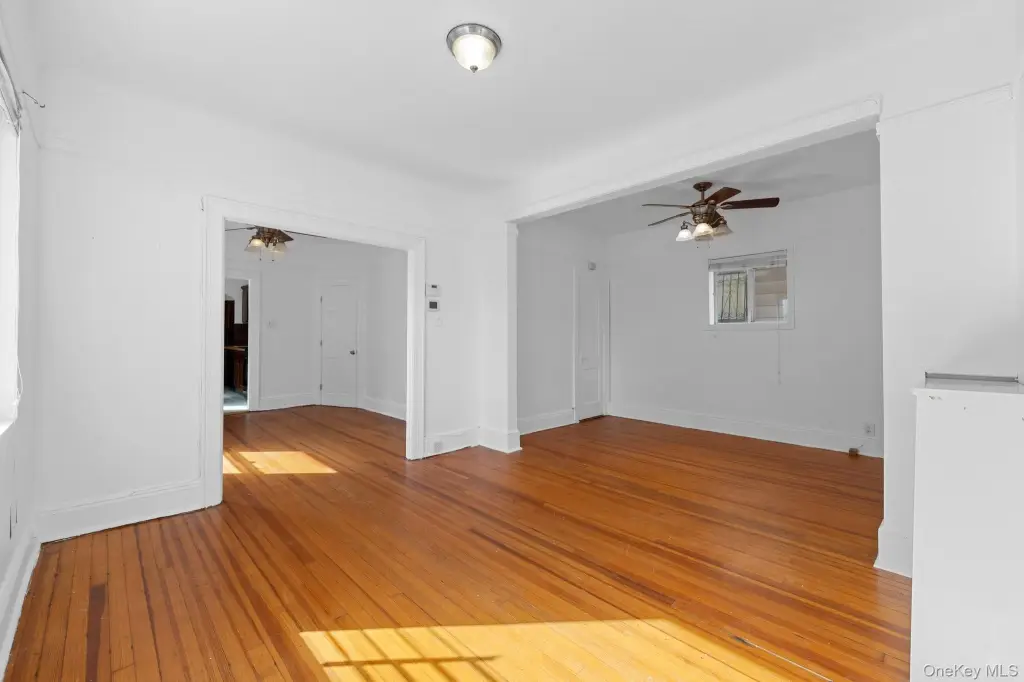
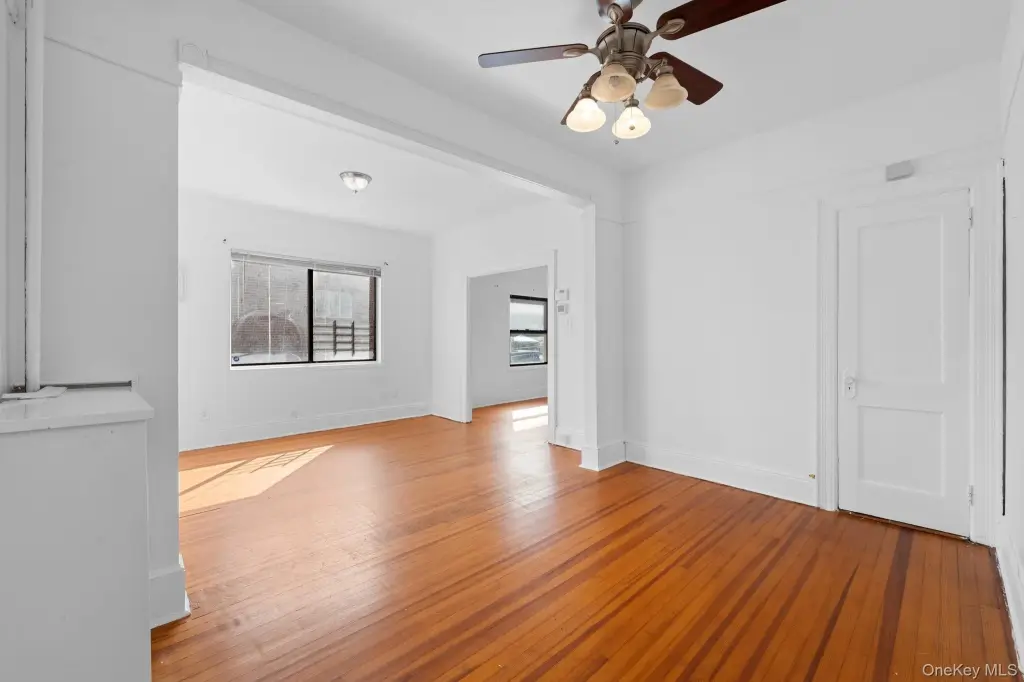
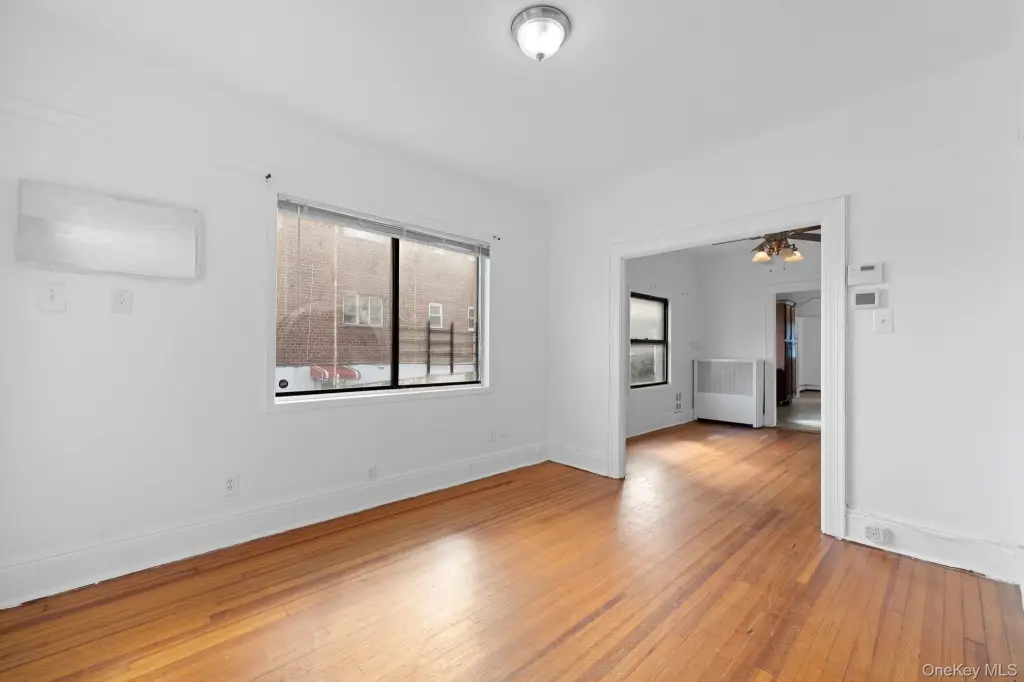
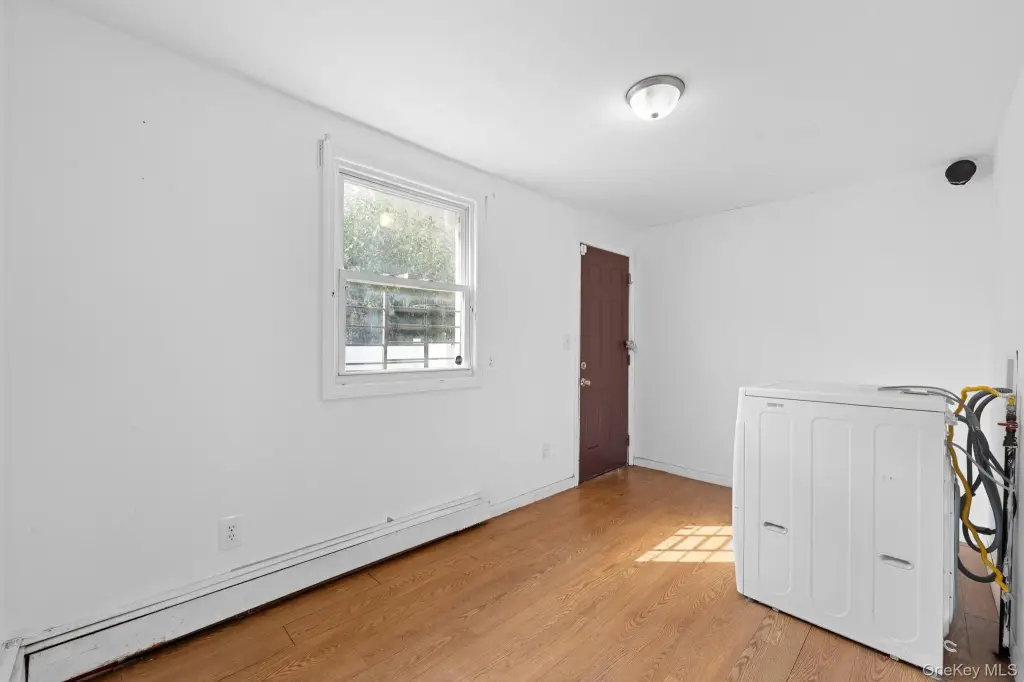
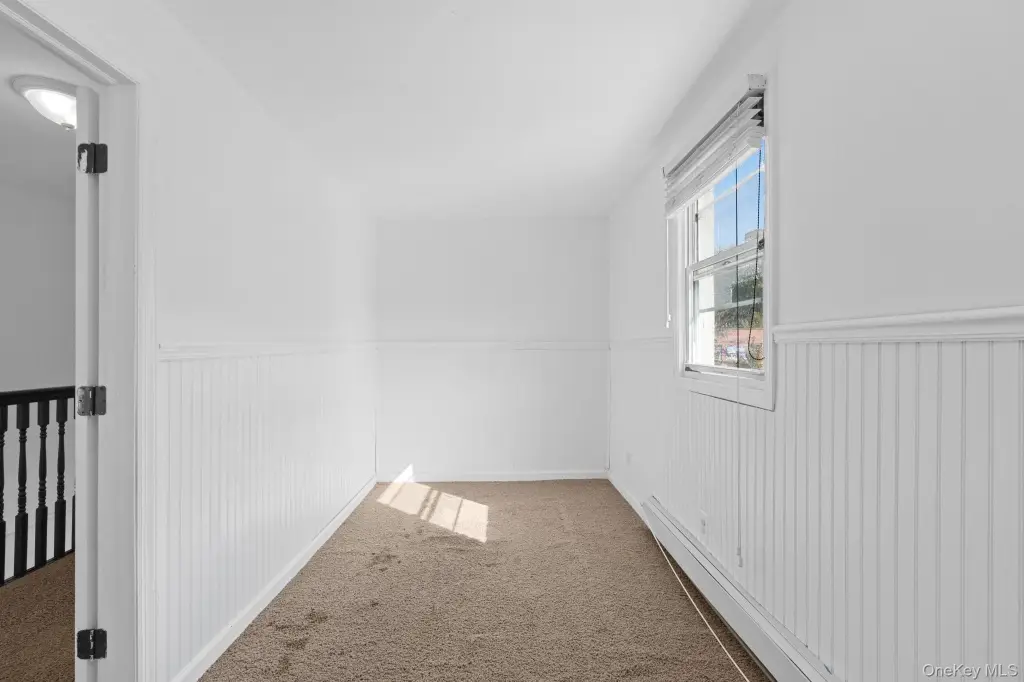
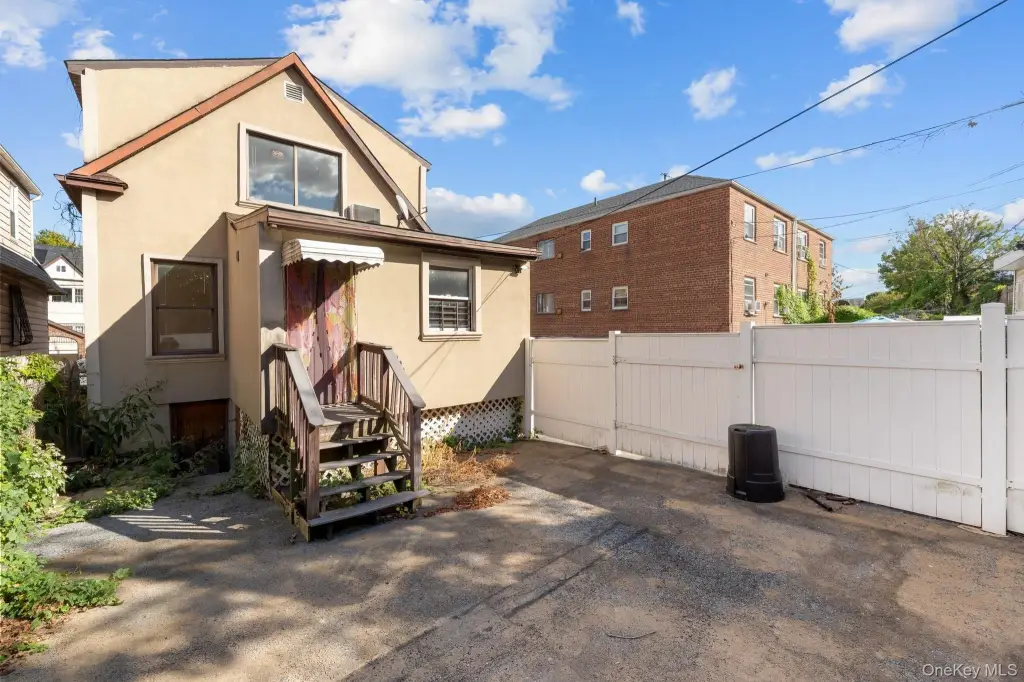
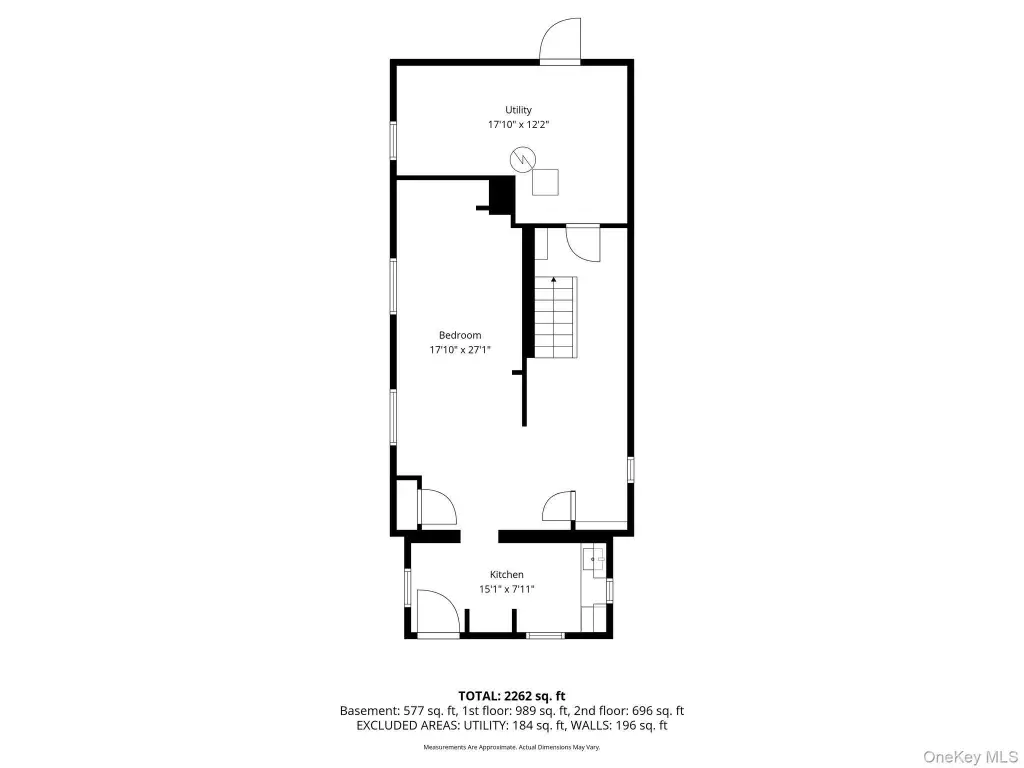
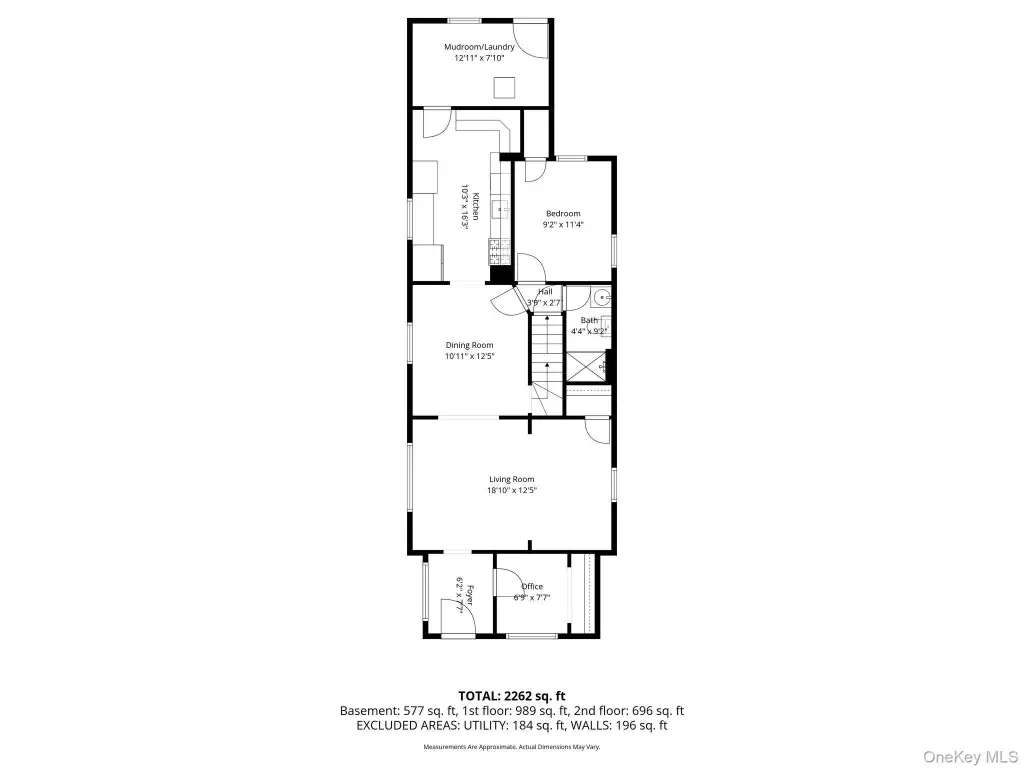
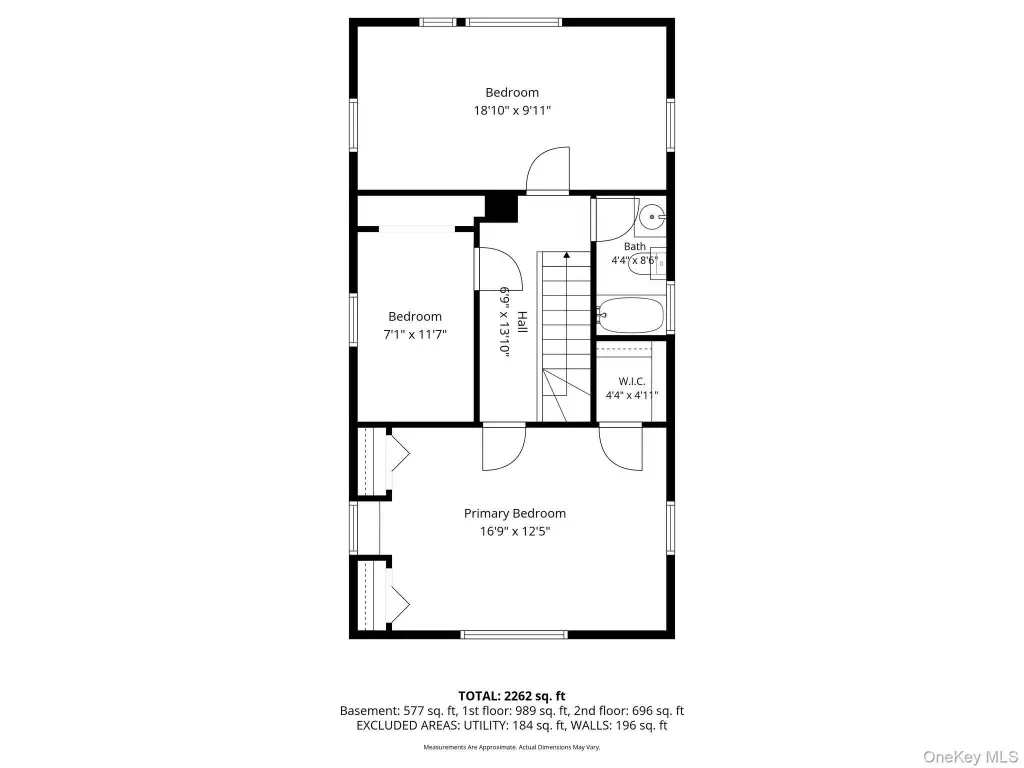
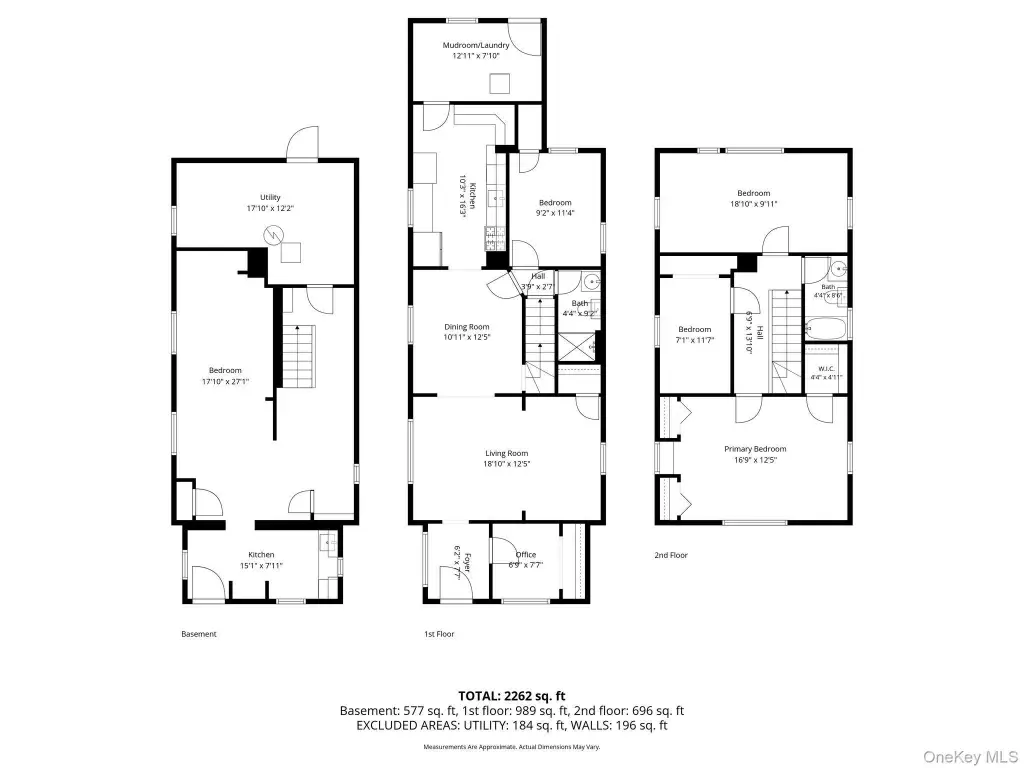
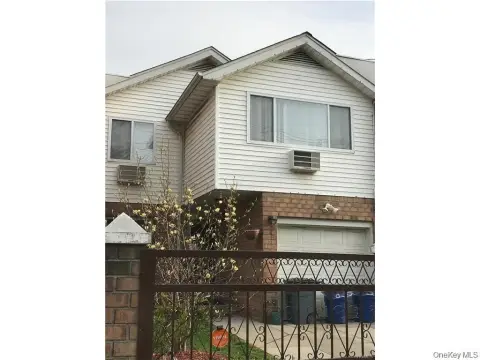
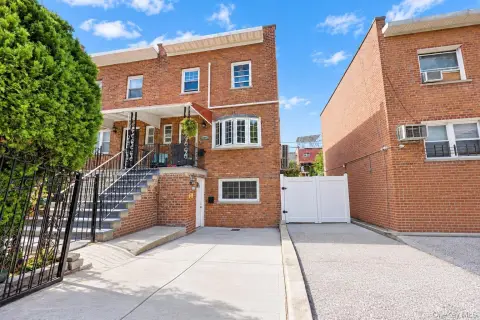
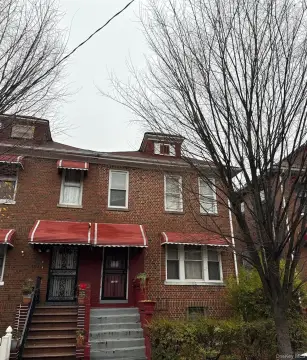
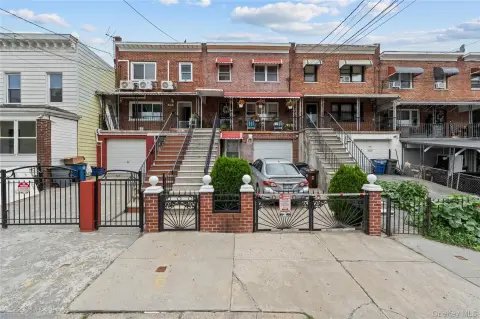
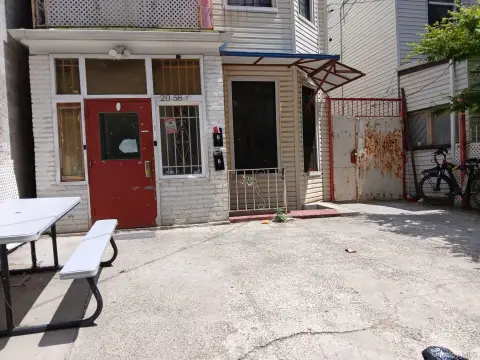
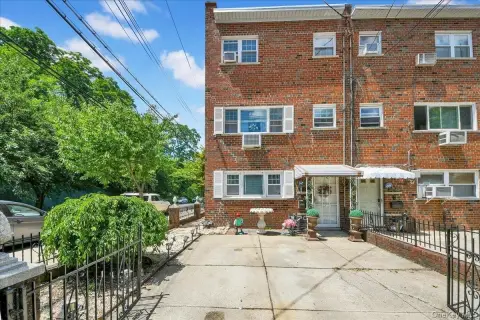
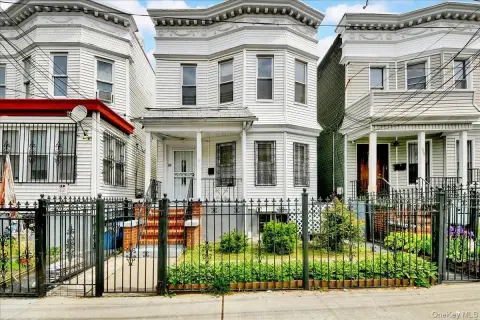
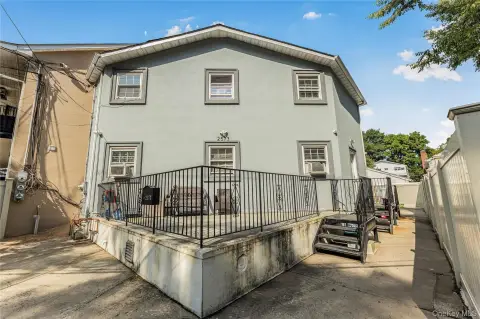
Located at 1163 Virginia Avenue in the Bronx, this fully detached two-family residence combines an occupied-style main dwelling layout with a separate unfinished apartment below. The primary residence is arranged as a four-bedroom duplex with two full bathrooms, hardwood flooring, a living room, dining area, office, mudroom, and laundry room. A walk-through kitchen, entrance foyer, first-floor bedroom, and first-floor full bath add to the interior configuration.
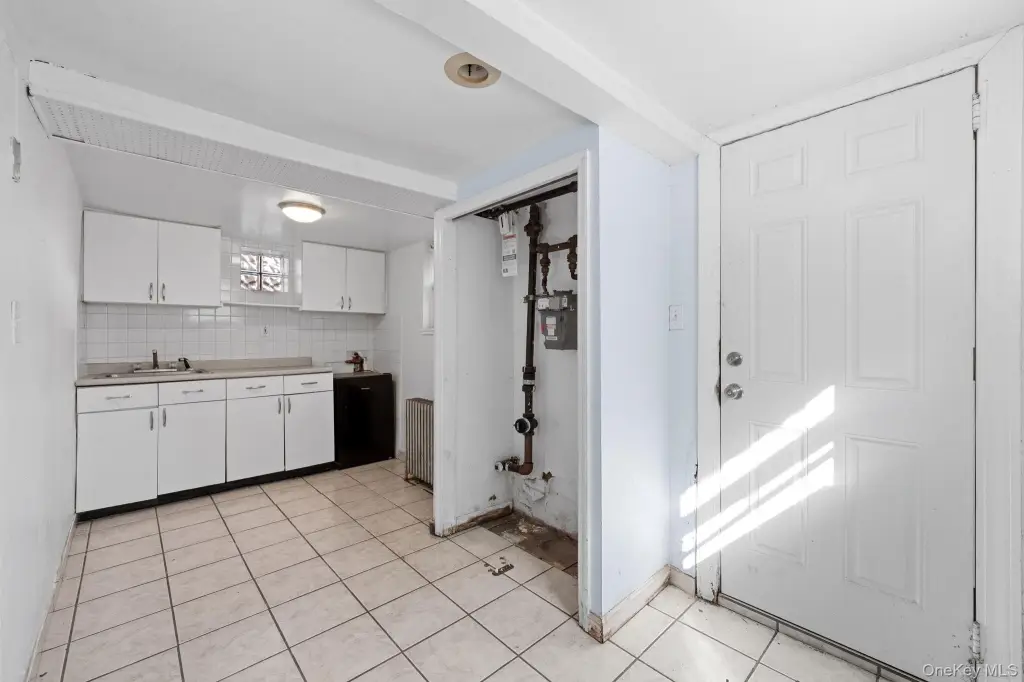
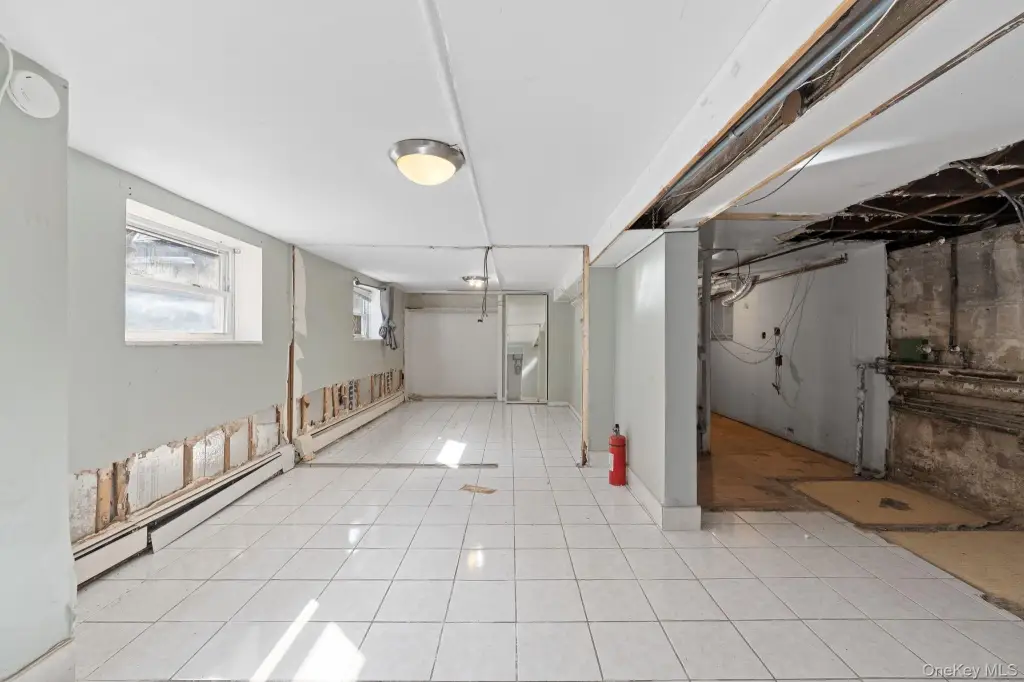
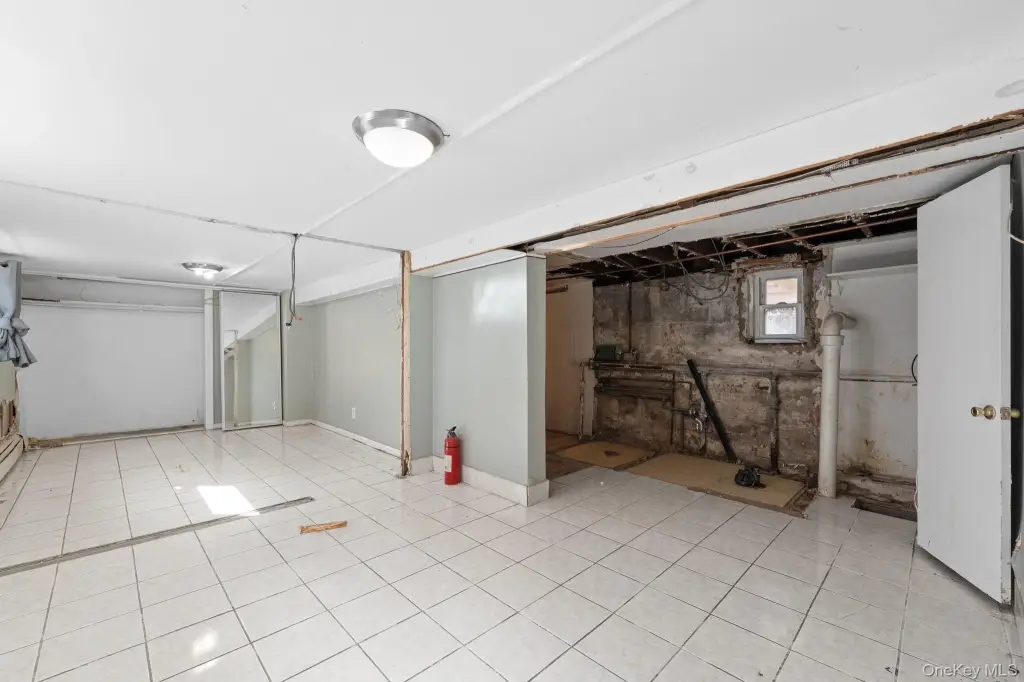
The lower-level apartment requires complete renovation, while the stucco exterior and private backyard provide additional physical features. The property occupies a 0.0587-acre lot and was built in 1920. Public water and public sewer serve the home. Parking is on the street; the neighboring parking lot is a separate parcel and is not included. Any renovation work is subject to third-party approval with DOB and the State.
The lower-level apartment requires complete renovation, while the stucco exterior and private backyard provide additional physical features. The property occupies a 0.0587-acre lot and was built in 1920. Public water and public sewer serve the home. Parking is on the street; the neighboring parking lot is a separate parcel and is not included. Any renovation work is subject to third-party approval with DOB and the State.
Key Highlights
- Fully detached legal 2‑family home at 1163 Virginia Avenue, Bronx, NY 10472
- Four‑bedroom duplex with 2 full bathrooms and dedicated living, dining, office, and mudroom areas
- Unfinished lower‑level apartment requiring full renovation
Property Analytics
Unlock full access to Insights
Subscribe to Realmo Intelligence
Open Analytics
Current Use
Lease Details
2
Residential units
Location Intelligence
Trade Area within ½ mile
3,467
Businesses Nearby
Explore this area
Business Placement
Demographics for 10472, NY
72,245
Population
24,259
Households
3
Avg Household Size
34
Median Age
14%
College-Educated
69%
High-School Grad
1.1 sq mi
ZIP Area
65,677
Density / Sq Mi
$43,125
Median Household Income
$35,180
Median Earnings
$1,445
Median Rent
$632,500
Median Home Value
Check the figures for this property
Cap Rate, Value Estimation, Potential NOI and more
View Realmo Analytics
Market
Vacancy Rate% for Multifamily in Northeast region

Questions? Ask Rey
Realmo’s AI knows this listing — price, zoning, demand, history. Ask anything.



Frequently Asked Questions
What type of property is this?
Duplex - Detached two-family residence with a four-bedroom duplex, unfinished lower-level apartment, private backyard, and public utilities.
Where is this duplex located?
The property is located at 1163 Virginia Avenue Bronx, NY.
What is the asking price?
The asking price for this property is $849,999.
What are key features of this property?
This property features: Fully detached legal 2‑family home at 1163 Virginia Avenue, Bronx, NY 10472; Four‑bedroom duplex with 2 full bathrooms and dedicated living, dining, office, and mudroom areas; Unfinished lower‑level apartment requiring full renovation



