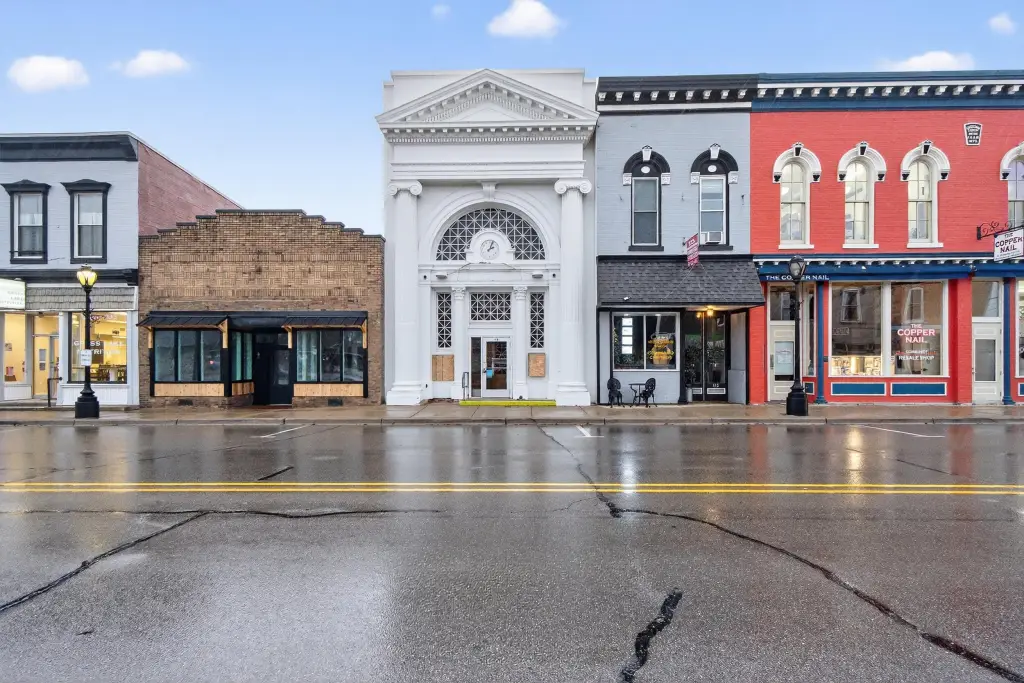
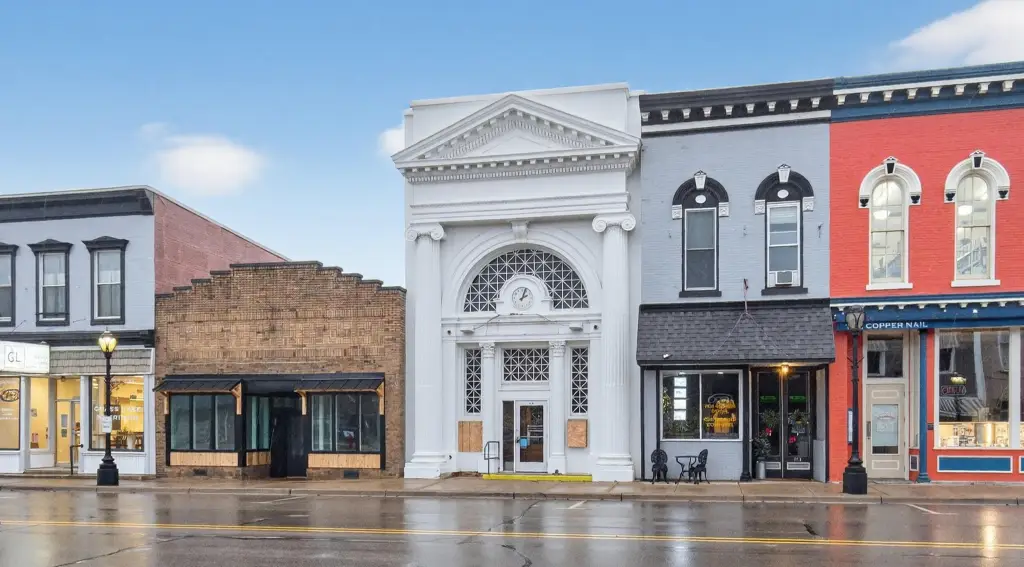
Office Building with Original
For Sale
Under Contract
$299,900
115 E Michigan Avenue, Grass Lake, MI 49240
Commercial Sale, Grass Lake, MI
Property Size2,640 SF
Lot Size0.07 Acres
Price / SF$113.60
Days on Market264
Property Features for 115 E Michigan Avenue
General Information
Property type
Commercial Sale
Property subtype
Office
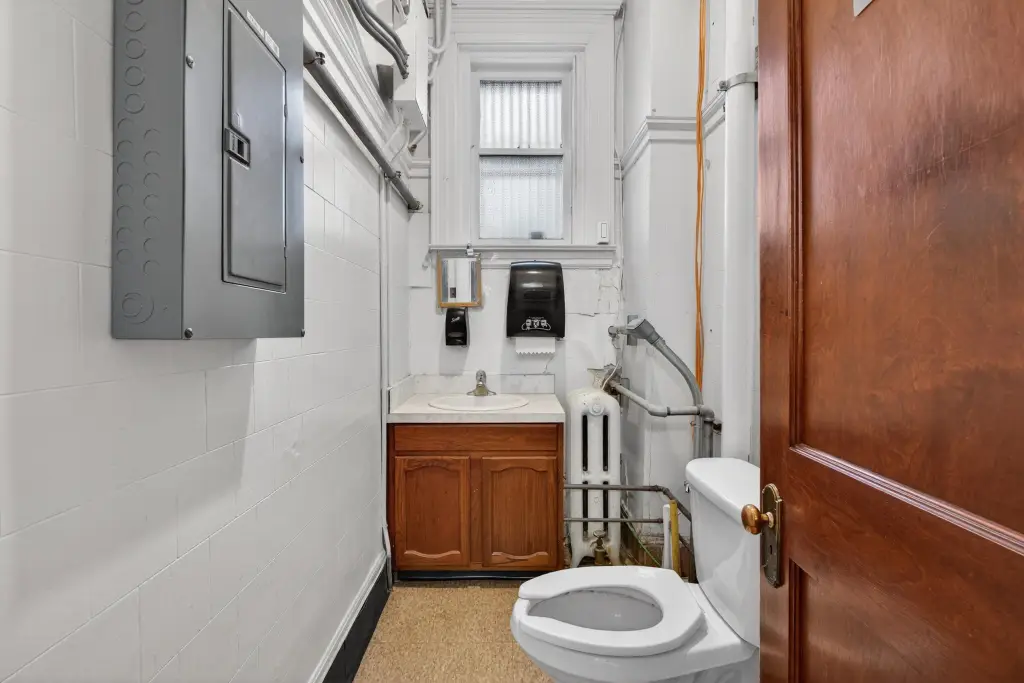
Bathrooms
2
Full bathrooms
2
Rooms
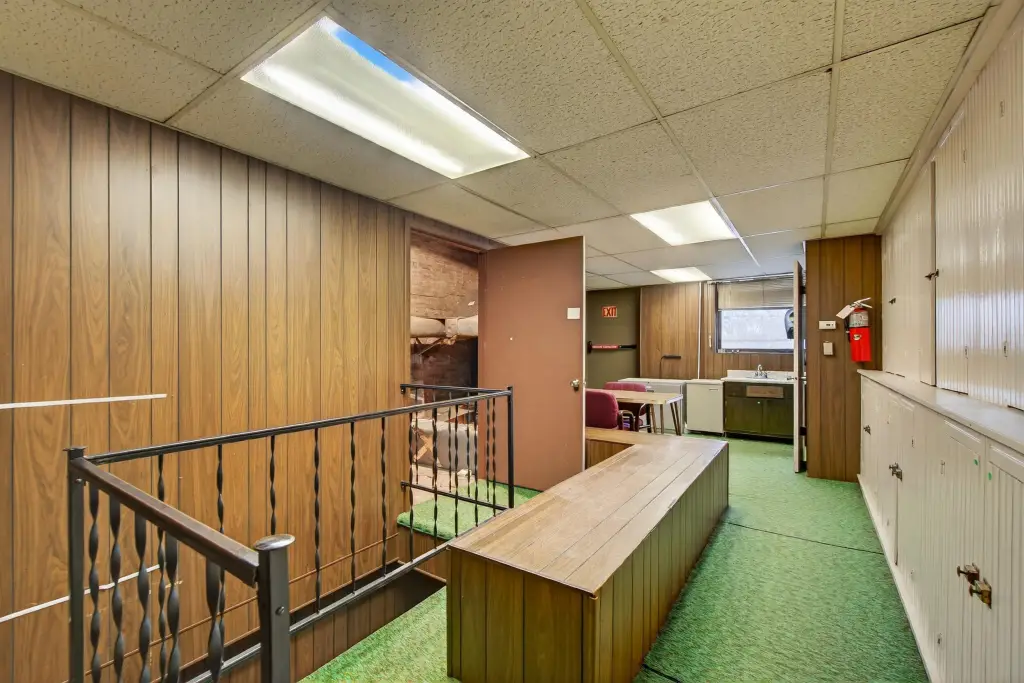
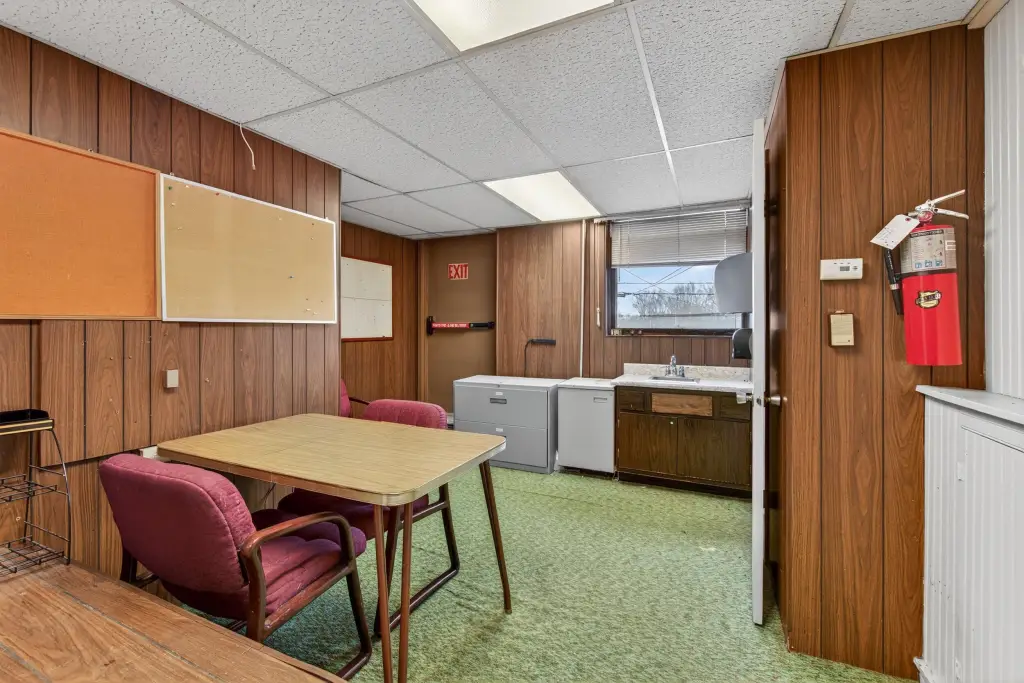
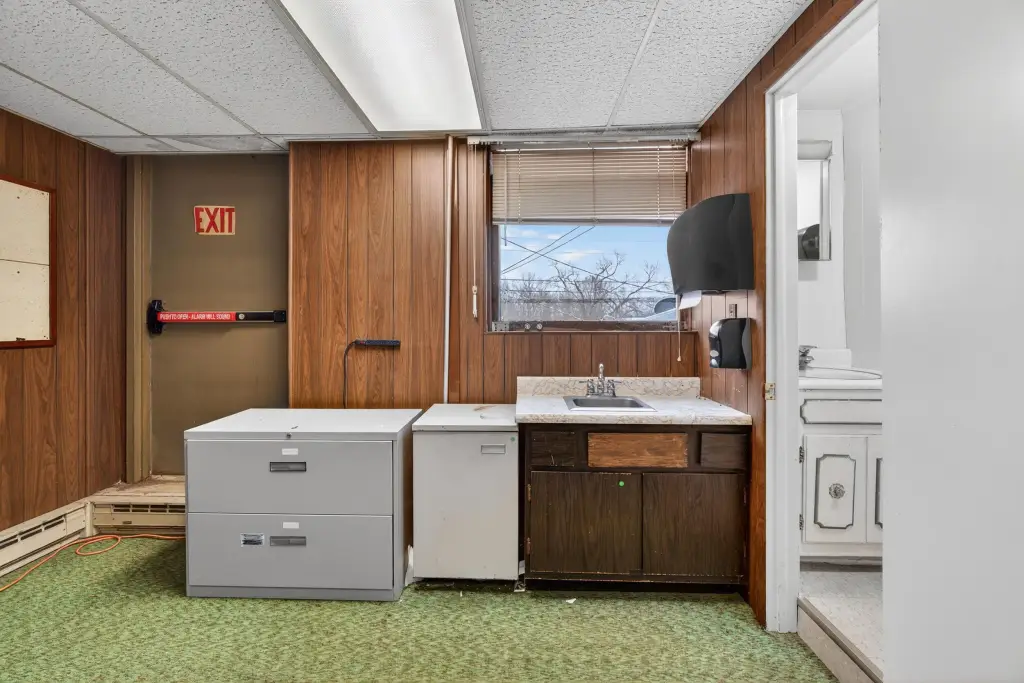
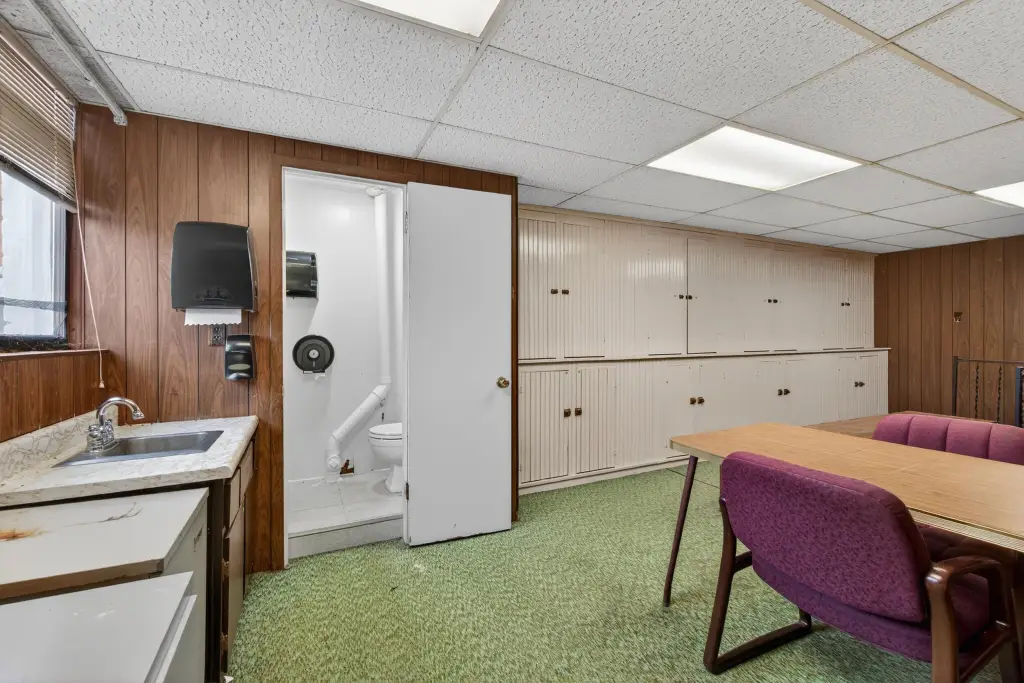
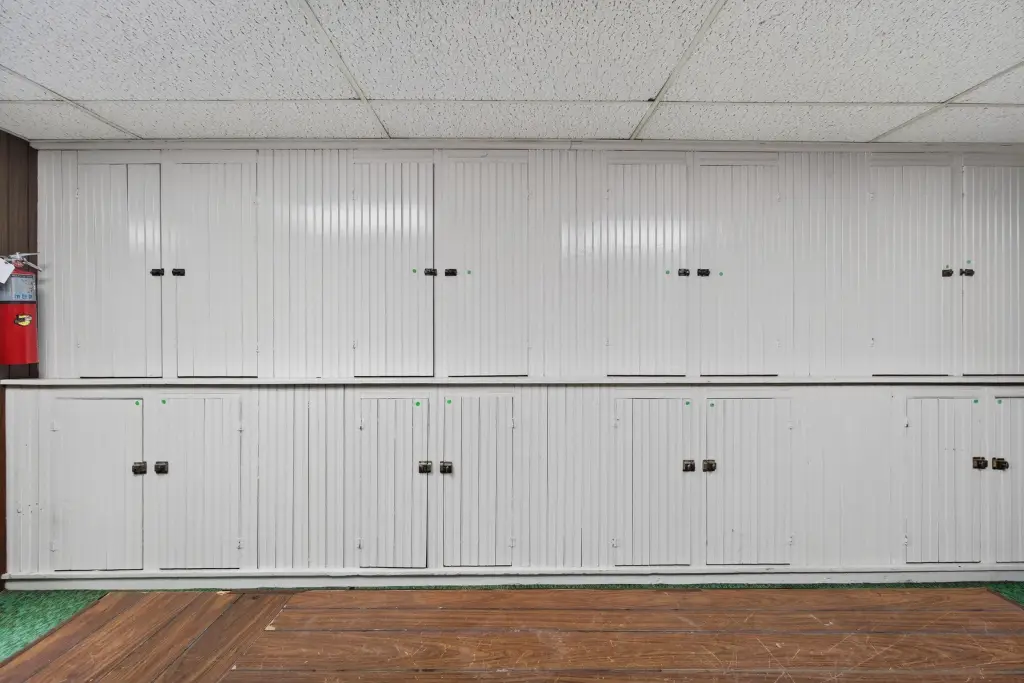
Bathroom 2, Bathroom 1, Basement
Elementary school district
Grass Lake
Middle school district
Grass Lake
High school district
Grass Lake
Subdivision
Jackson County - JX
Standard status
Active Under Contract
APN
007-10-32-481-010-00
Size
2,640 SF
Lot size
0.07 Acres
Taxes and HOA fees
Tax Year
2025
Tax Description
A PCL OF LD OWNED AND USED AS ONE PCL BEING A PART OF SEFRL 1/4 OF SEC 32 AND A PART OF LOT 2, SOUTH OF TERRITORIAL RD
Tax Annual Amount
2903
Legal Description
A PCL OF LD OWNED AND USED AS ONE PCL BEING A PART OF SEFRL 1/4 OF SEC 32 AND A PART OF LOT 2, SOUTH OF TERRITORIAL RD
Utilities
Utilities
Cable Available
Heating system
Baseboard
Cooling system
Central Air
Amenities
security system
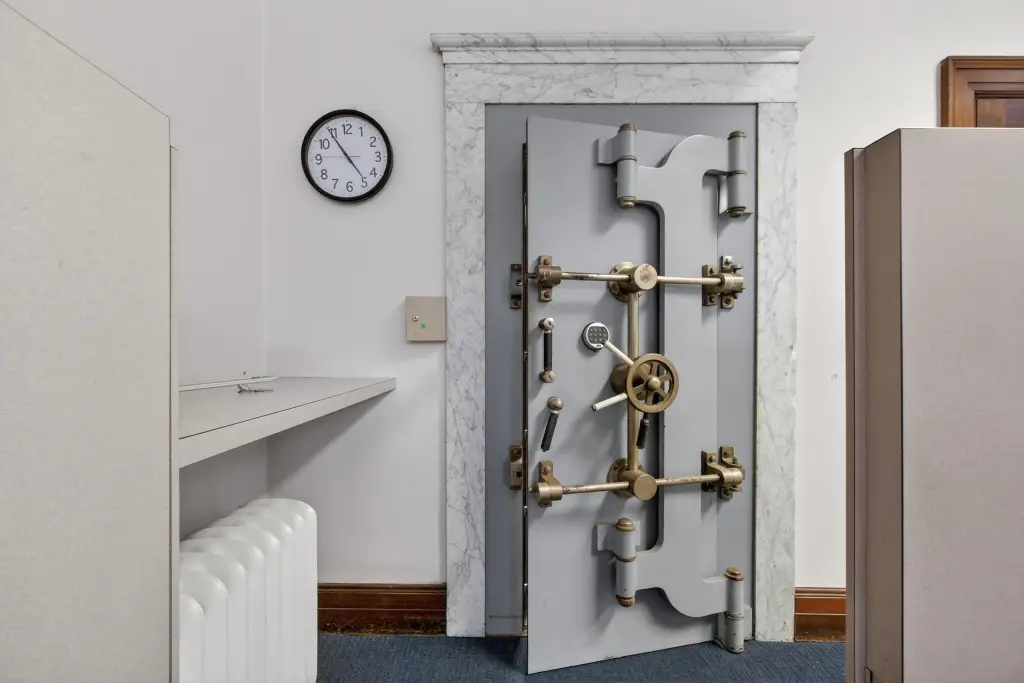
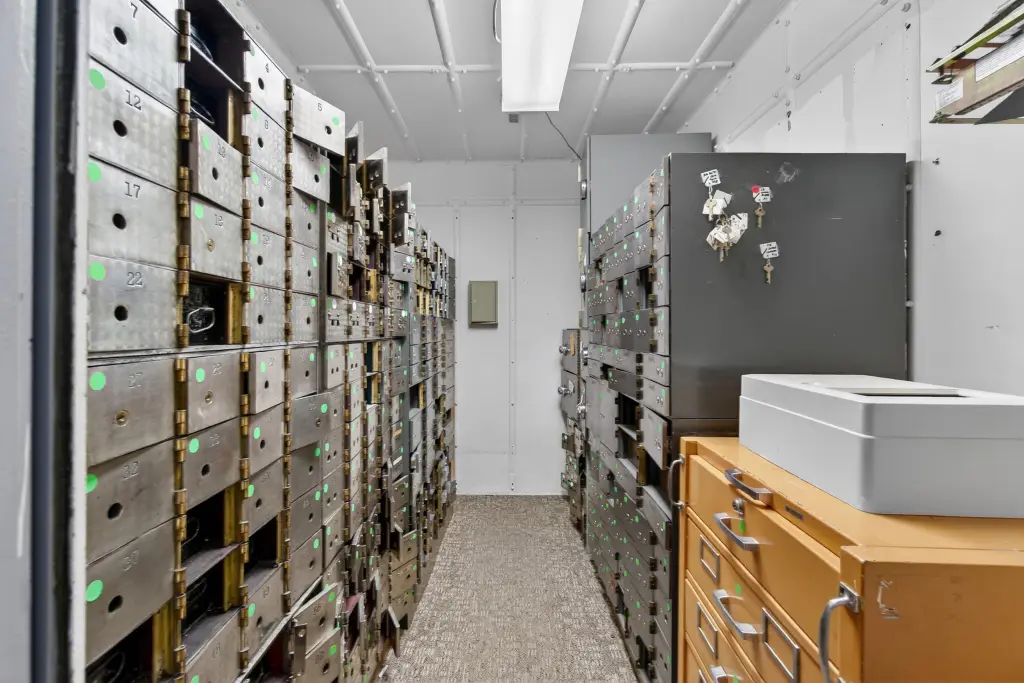
vault
Building Details
Year built
1900
Floors in Building
2
Number of units
1
Building materials
Concrete, Brick
Roof type
Rubber
Listing Agency:
Century 21 Affiliated - Jackson
(517) 888-0050
Listed By:
Logan Everett · License #6501411675
(517) 775-1388
Added: Jan 15
Changed: Sep 16
Last Checked: Oct 6 at 10:06AM
MLS# 26001804
Copyright © 2026 Michigan Regional Information Center, LLC. All rights reserved. All information provided by the listing agent/broker is deemed reliable but is not guaranteed and should be independently verified.
Investment Insights
Based on property information with market context.
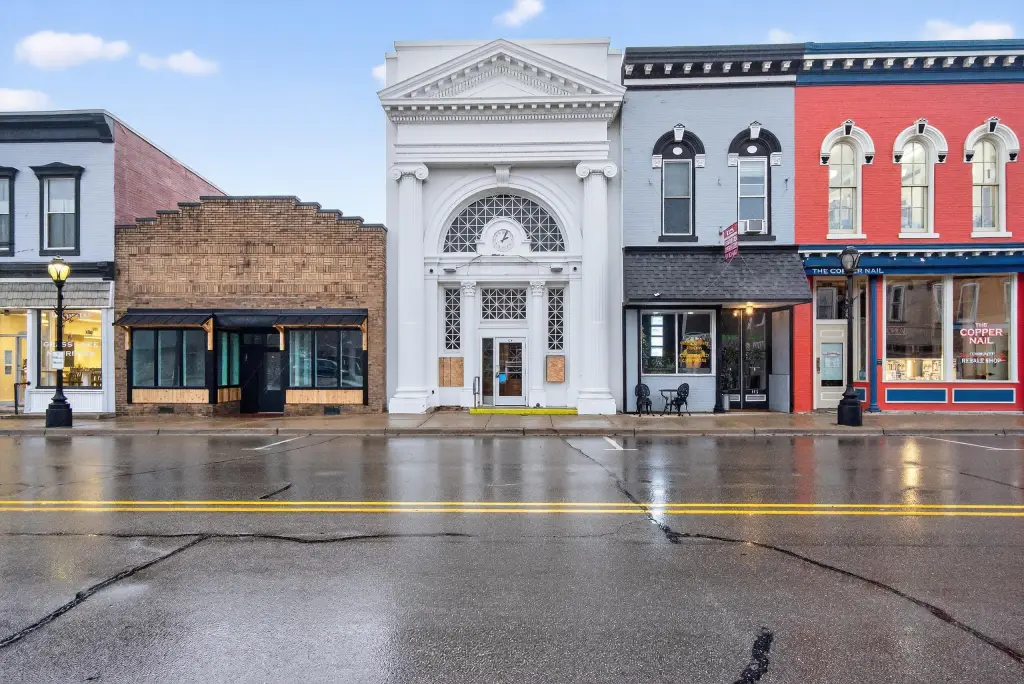
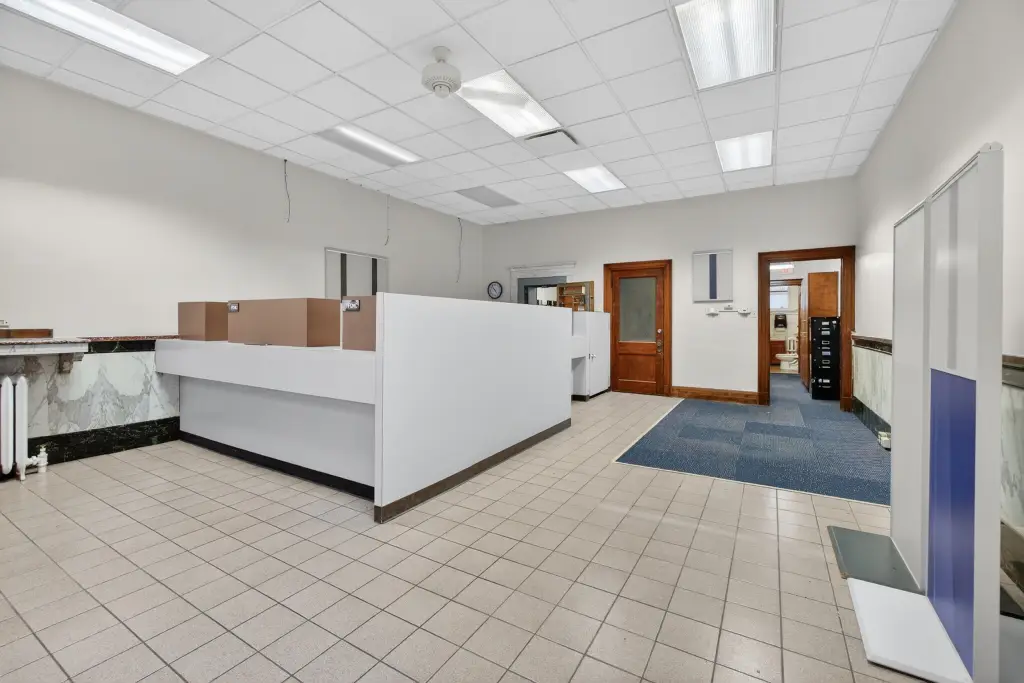
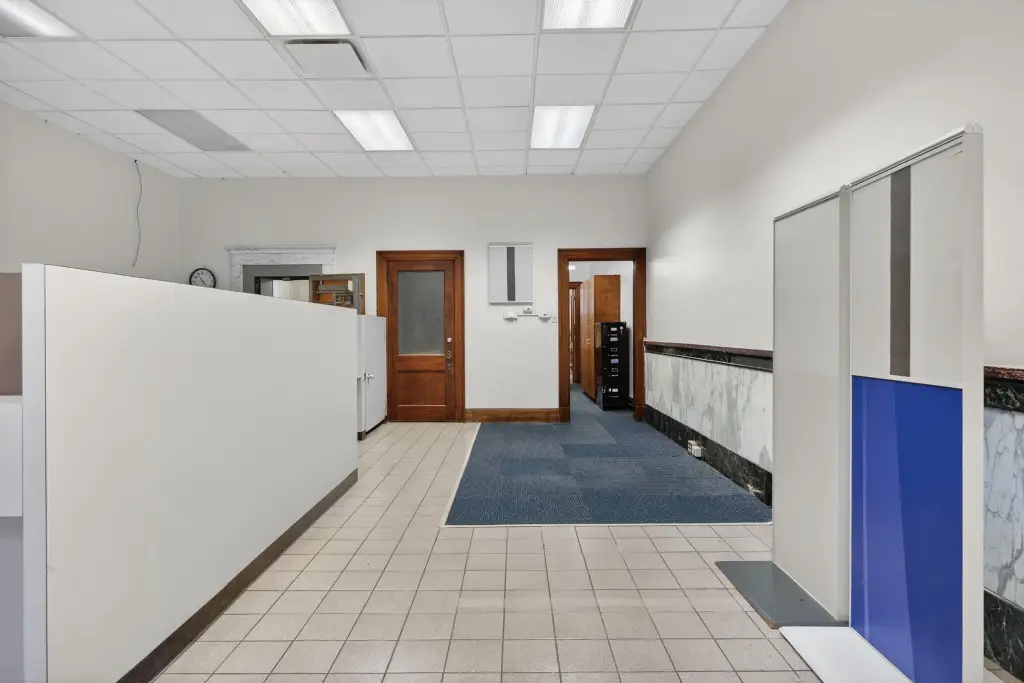
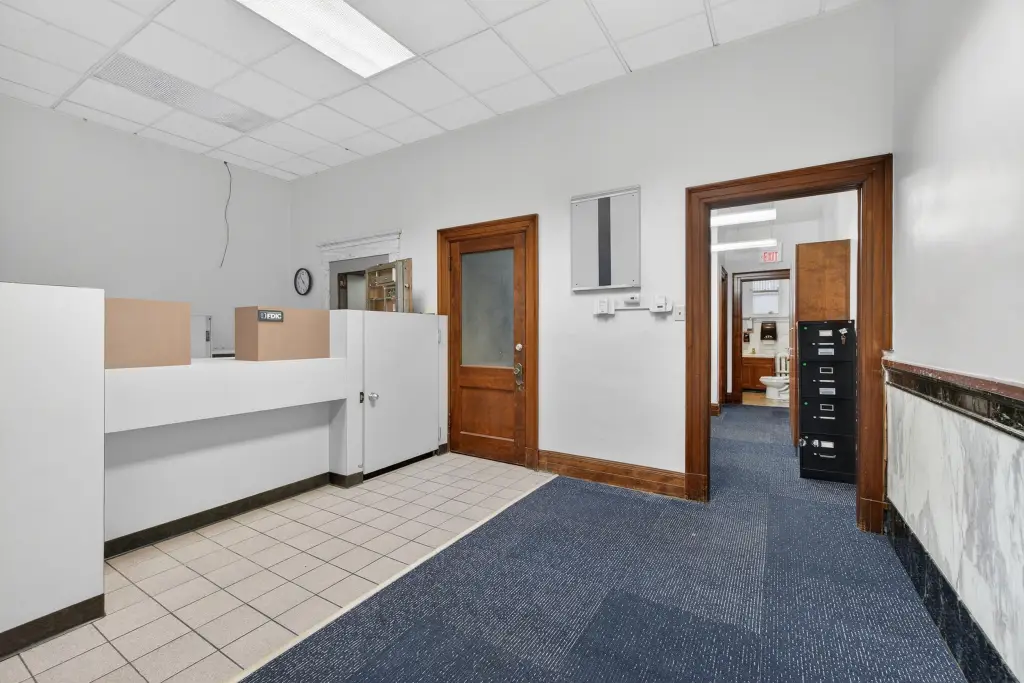
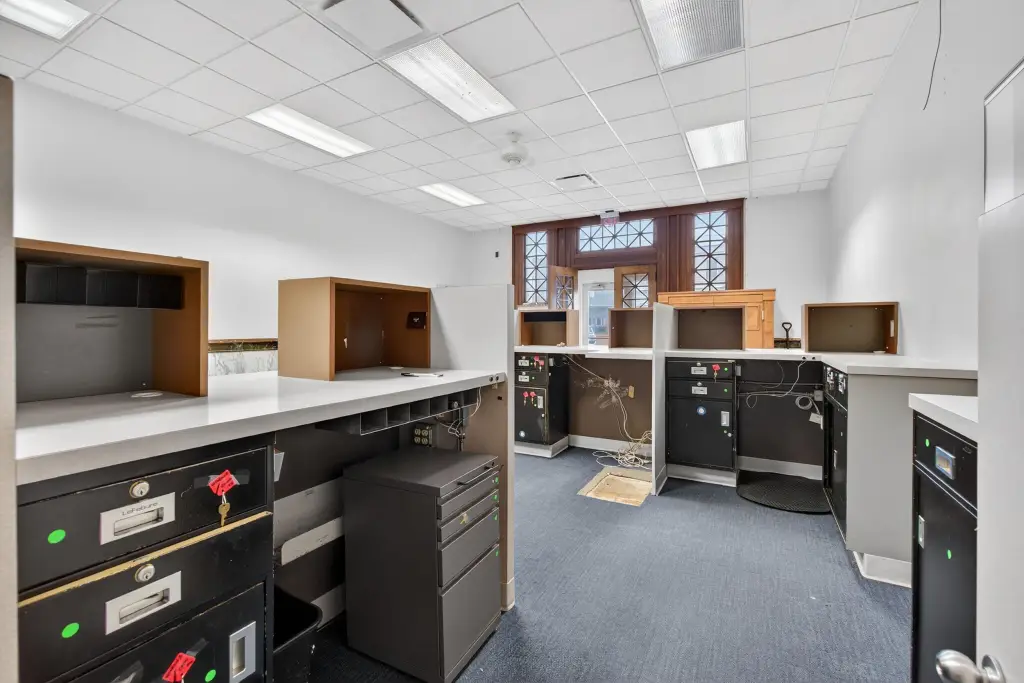
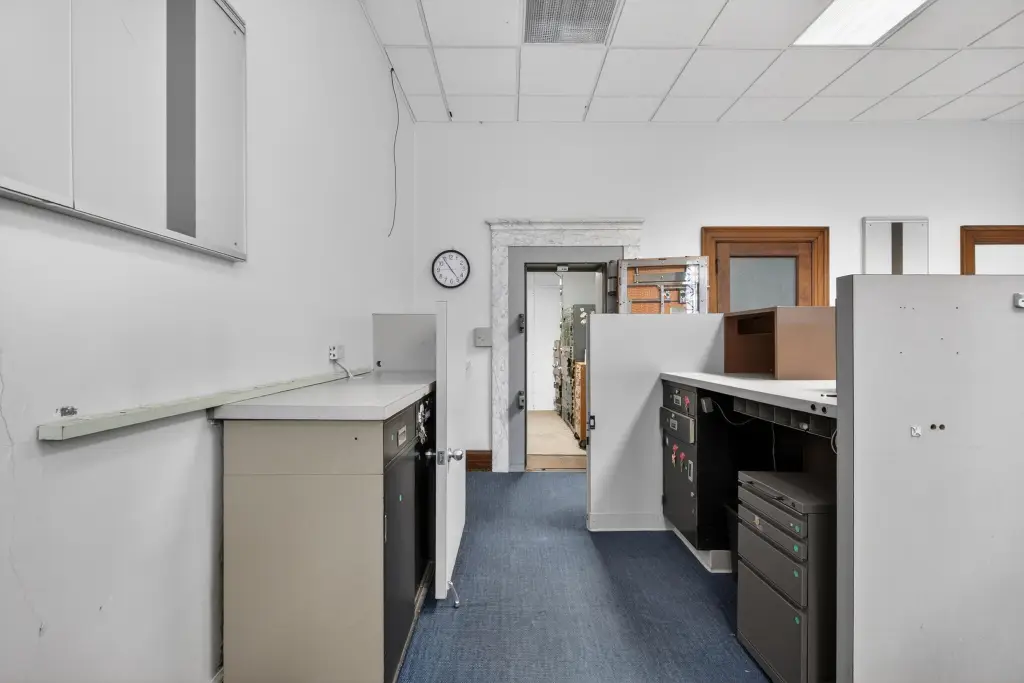
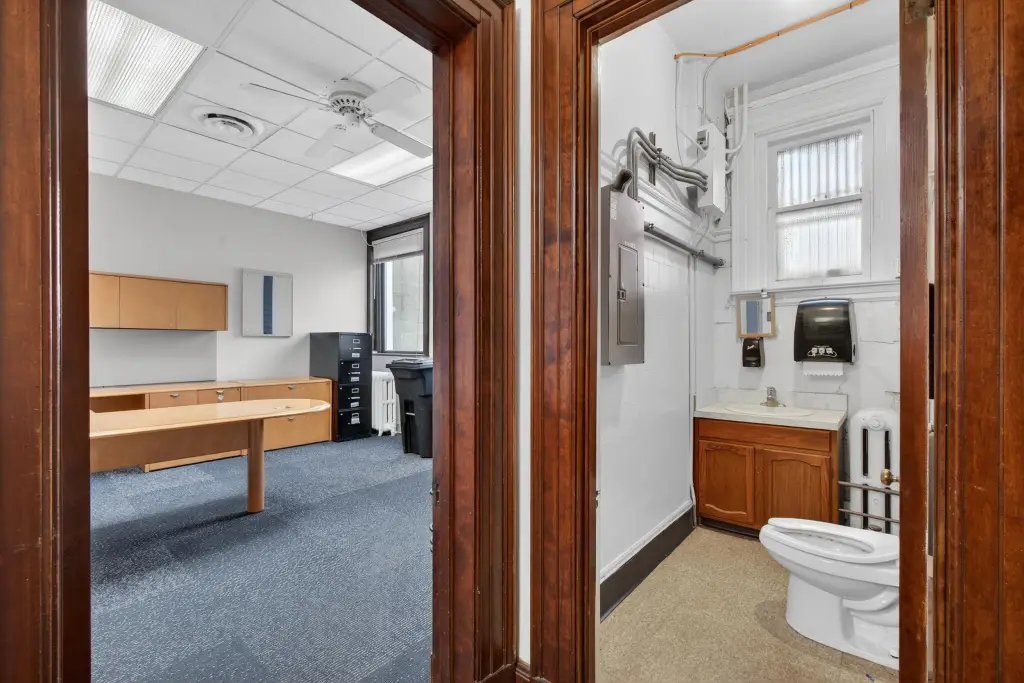
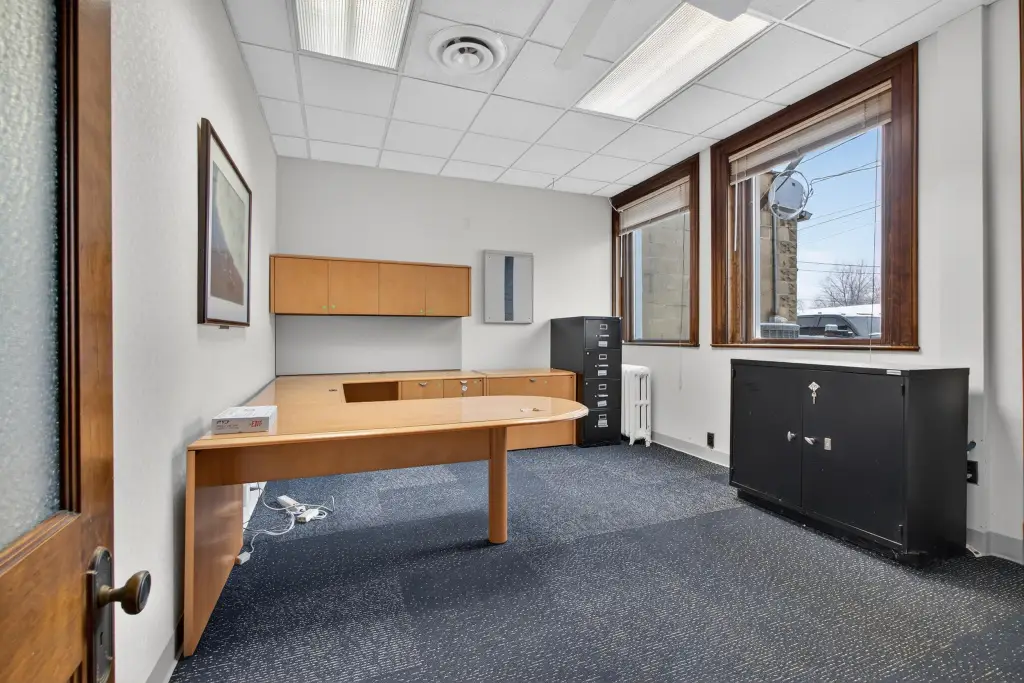
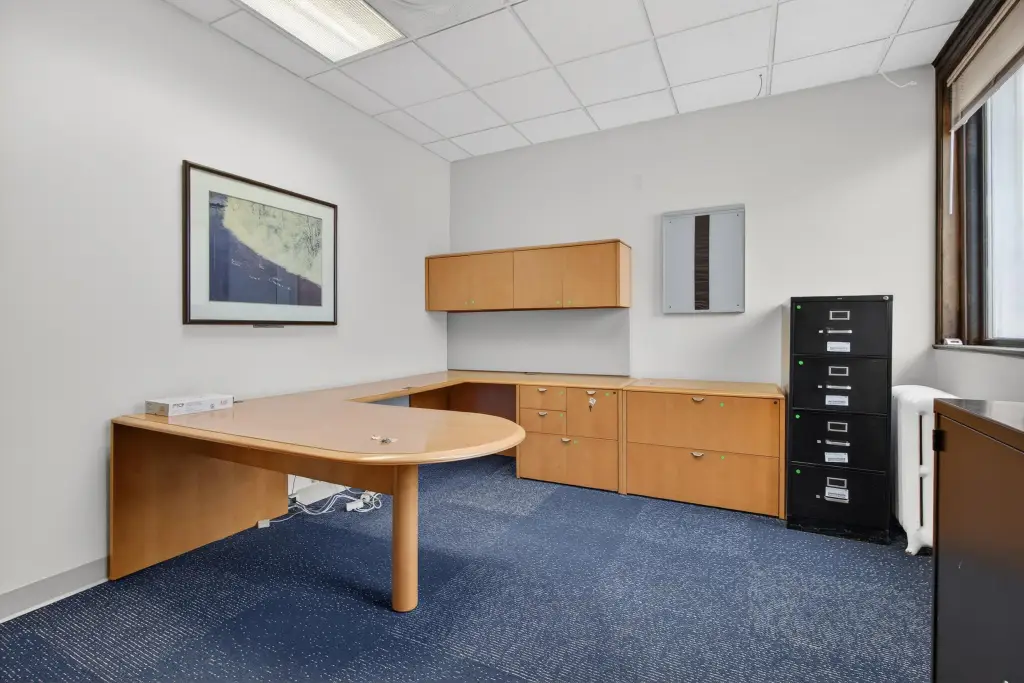
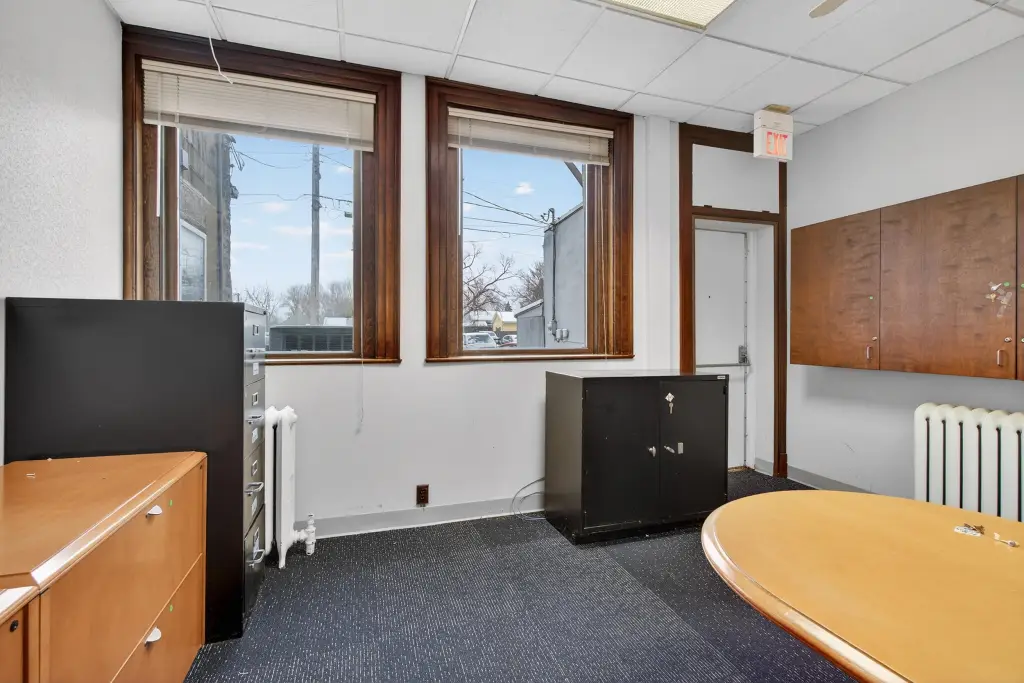
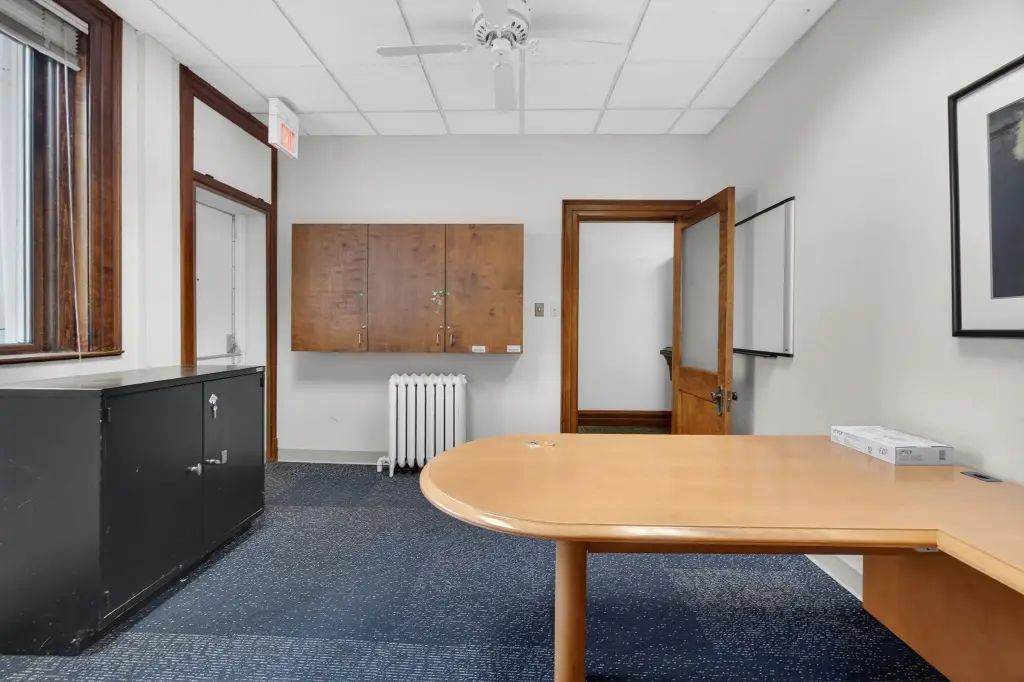
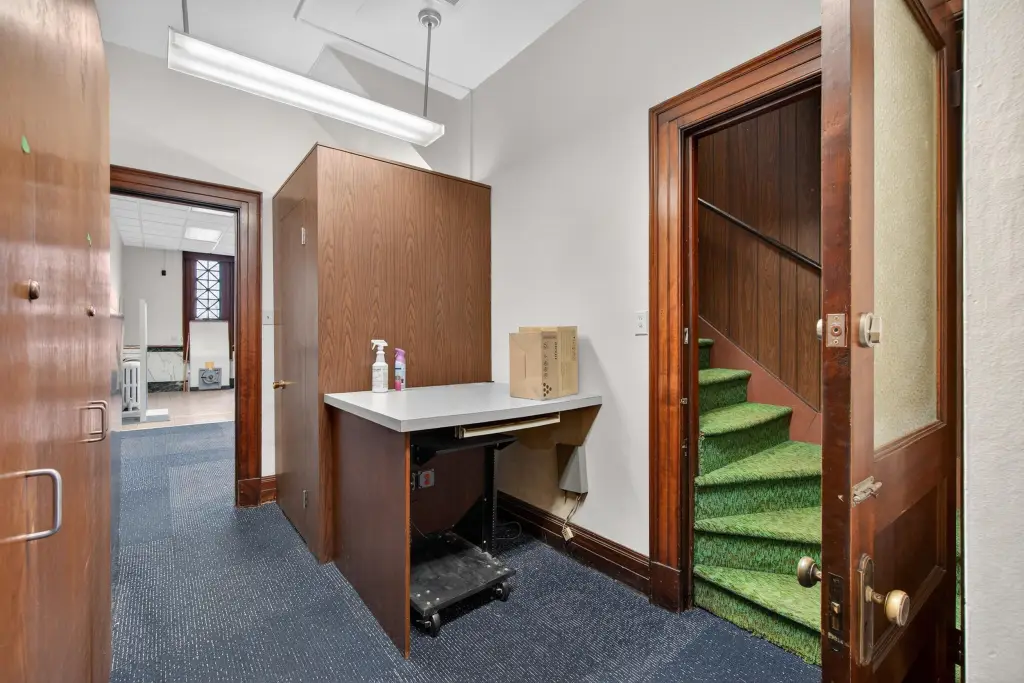
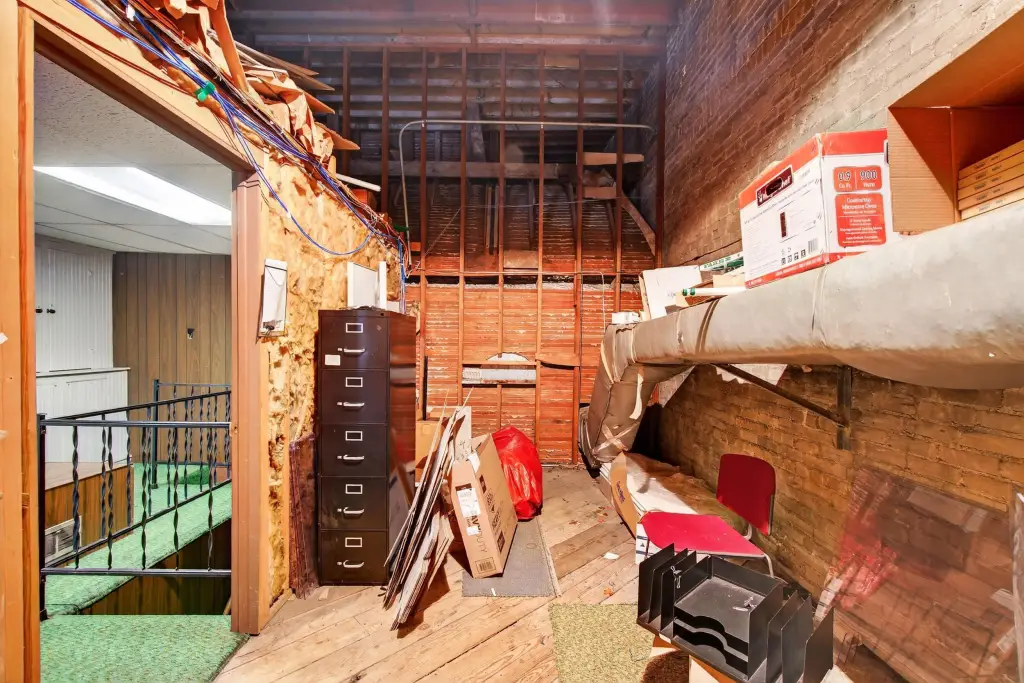
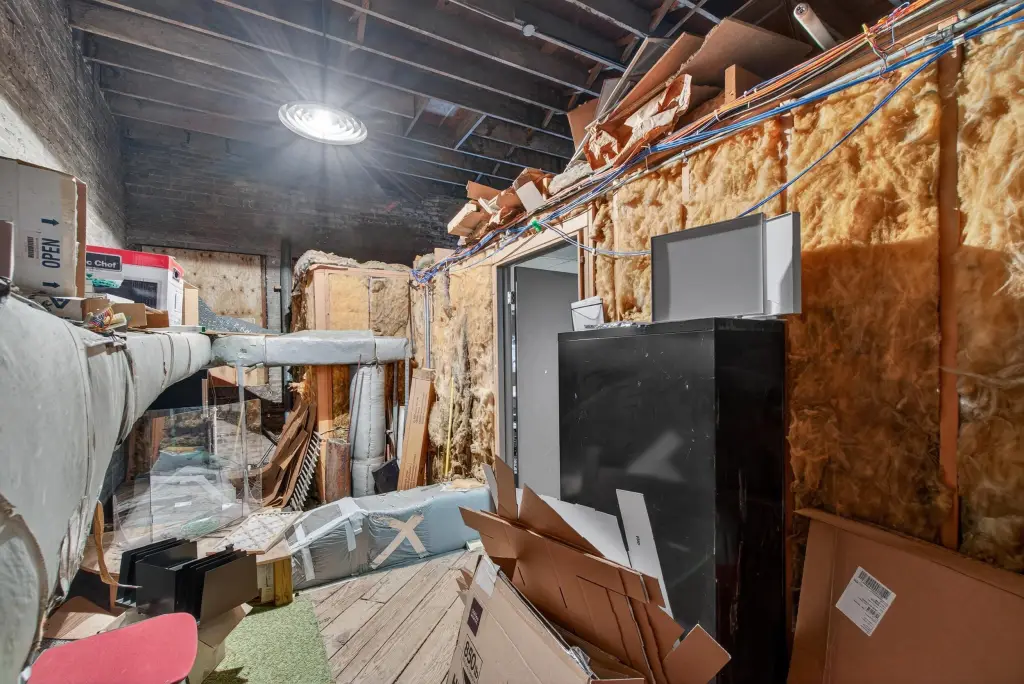
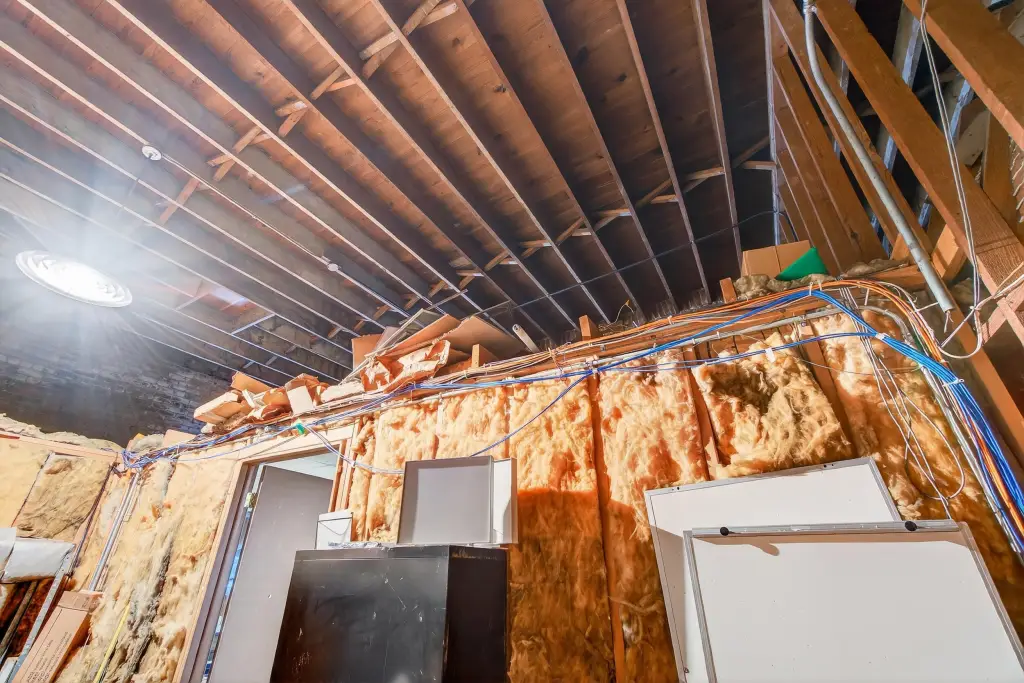
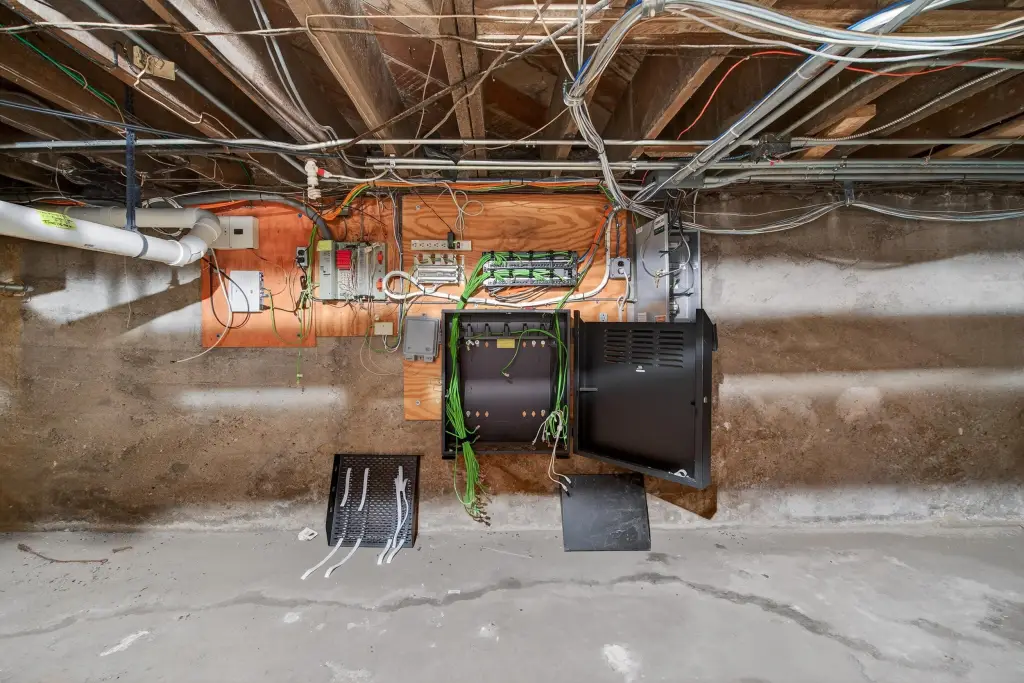
Built in 1900, this 2,640-square-foot office building occupies a 0.07-acre parcel at 115 E Michigan Avenue in Grass Lake. The main level includes granite and marble finishes, high ceilings, a restroom, and a private executive office. The upper floor provides space for a kitchenette, half bath, and utility or storage functions, while the basement contains maintained mechanical systems and is configured for a security system.
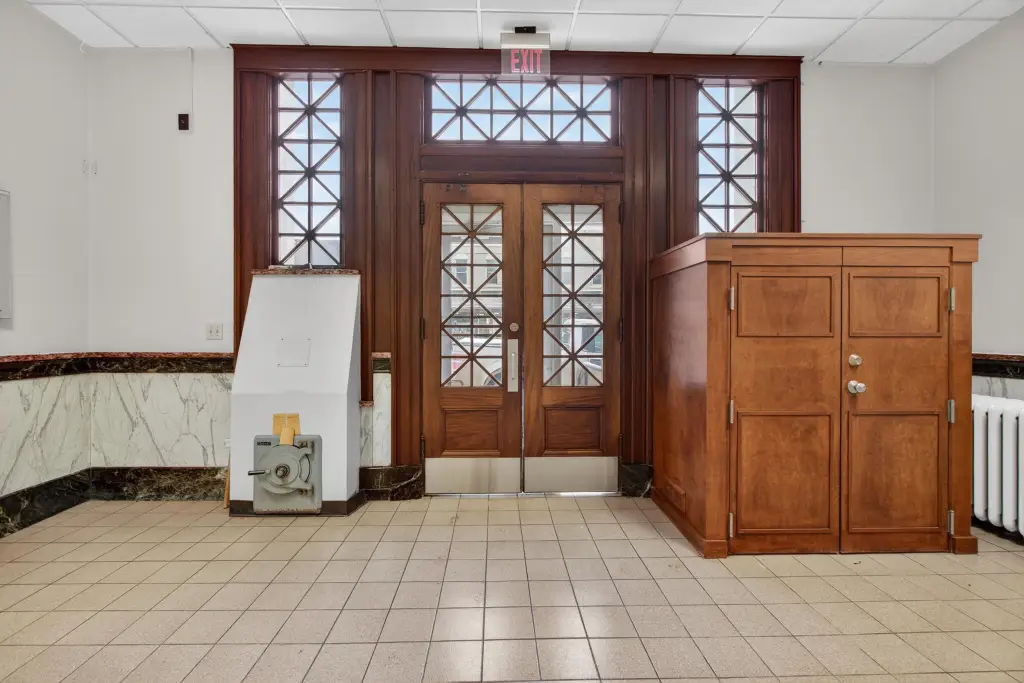
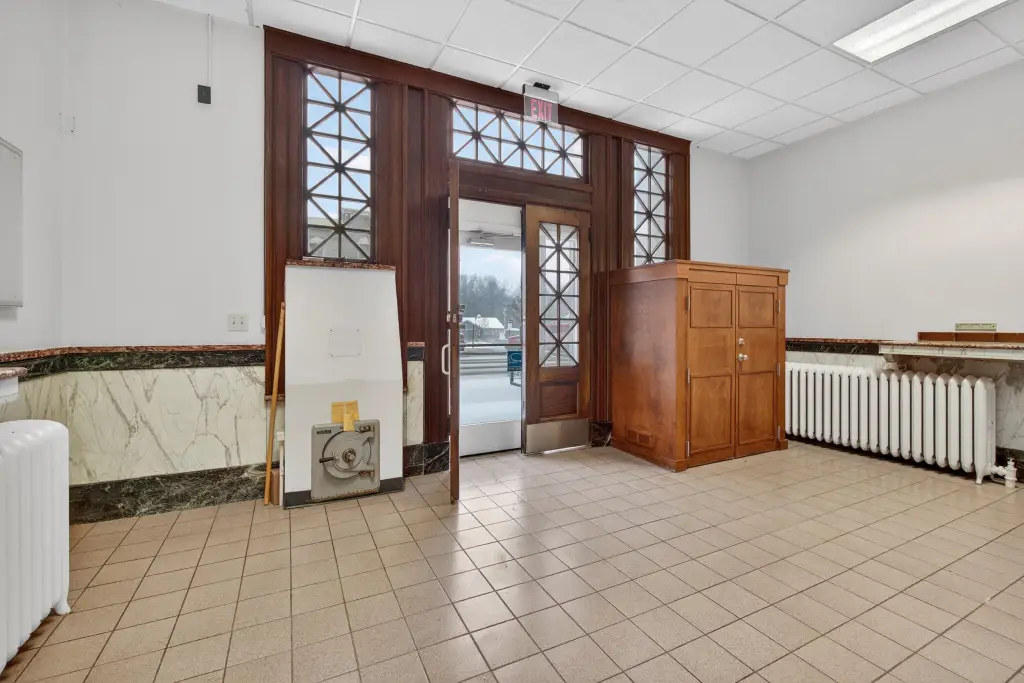
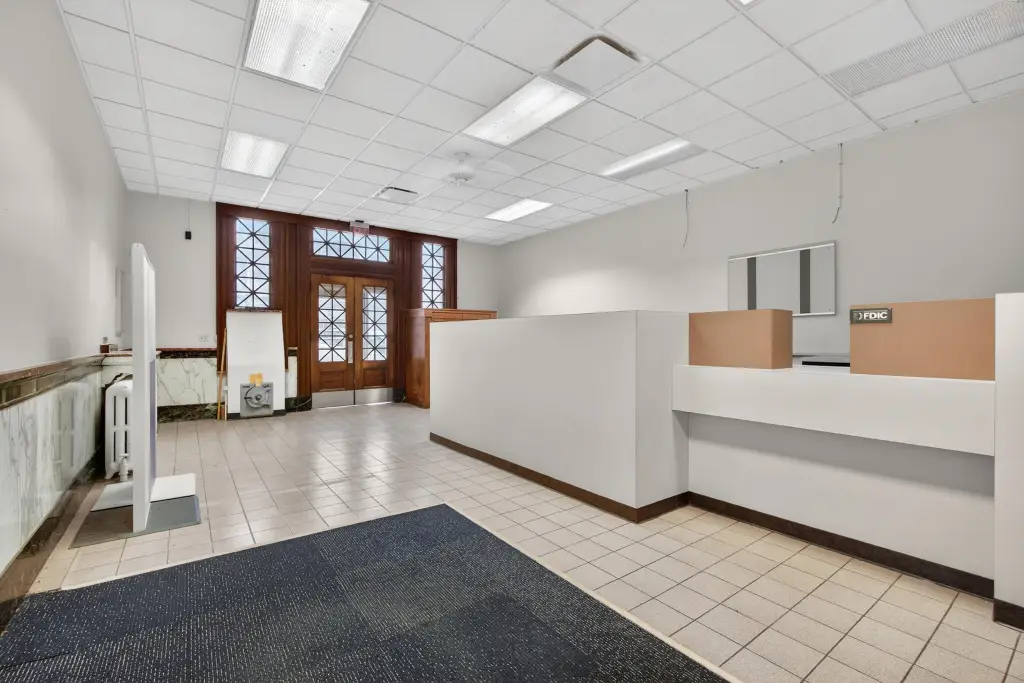
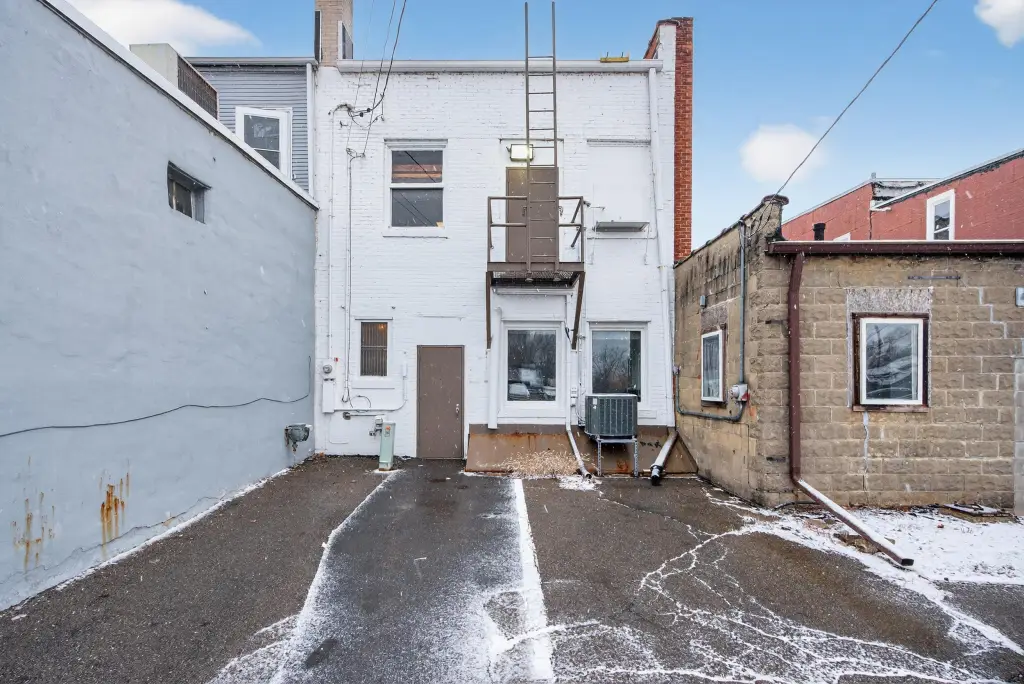
The property retains a large original vault and a separate drop-box vault at the front entrance. Two dedicated parking spaces are located behind the building. Concrete and brick construction, baseboard heat, central air, cable availability, and a rubber roof complete the physical profile.
The property retains a large original vault and a separate drop-box vault at the front entrance. Two dedicated parking spaces are located behind the building. Concrete and brick construction, baseboard heat, central air, cable availability, and a rubber roof complete the physical profile.
Key Highlights
- 2,640‑square‑foot office building on a 0.07‑acre parcel
- Large original vault plus a separate front‑entry drop‑box vault
- Granite and marble finishes with high ceilings on the main level
Financial Insights
Estimated NOI and Cap Rate
NOI / Yr
$22,125
Cap Rate
7.38%
Suggested Prices Based on Cap Rates
Cap Rate 5%
$442,500
$442.5K
Cap Rate 7%
$316,071
$316.1K
Cap Rate 9%
$245,833
$245.8K
Market Conditions
NOI Build-Up for 2,640 SF
Gross rent
$38.0K $14.40/SF
− Vacancy
−$8.5K −$3.23/SF
EGI
$29.5K $11.17/SF
− OpEx
−$7.4K −$2.79/SF
NOI
$22.1K $8.38/SF
Area
Jackson County, MI
Vacancy
22.40%
Lease Rate
$14.40 /SF/Yr
Expense Ratio
25.00%
Simulate Cap Rate and NOI
Suggested Prices Based on Cap Rates
Cap Rate 5%
$442,500
Cap Rate 7%
$316,071
Cap Rate 9%
$245,833
Alternative Uses
Best Use
Office B
$316.1K
$276.6K – $368.8K
NOI $22,125 @ 7.0% cap · market cap 7.38%
Second Best
Retail
$260.1K
$227.6K – $303.4K
NOI $18,206 @ 7.0% cap · market cap 6.07%
Theoretical Best
Office A
$421.4K
$368.8K – $491.7K
NOI $29,500 @ 7.0% cap · market cap 9.84%
Zoning and permitted uses should be independently verified with authorities.
Property Analytics
Unlock full access to Insights
Subscribe to Realmo Intelligence
Open Analytics
Current Use
Location Intelligence
Trade Area within ½ mile
158
Businesses Nearby
Explore this area
Business Placement
Demographics for 49240, MI
9,213
Population
4,050
Households
2.3
Avg Household Size
45
Median Age
33%
College-Educated
97%
High-School Grad
104.1 sq mi
ZIP Area
89
Density / Sq Mi
$95,307
Median Household Income
$49,705
Median Earnings
$1,178
Median Rent
$272,300
Median Home Value
Check the figures for this property
Cap Rate, Value Estimation, Potential NOI and more
View Realmo Analytics
Market
Vacancy Rate% for Office in Midwest region

Questions? Ask Rey
Realmo’s AI knows this listing — price, zoning, demand, history. Ask anything.



Frequently Asked Questions
What type of property is this?
Office building - Granite and marble finishes, high ceilings, rear parking, and a basement support a distinctive office setting.
Where is this office building located?
The property is located at 115 E Michigan Avenue Grass Lake, MI.
What is the asking price?
The asking price for this property is $299,900.
What are key features of this property?
This property features: 2,640‑square‑foot office building on a 0.07‑acre parcel; Large original vault plus a separate front‑entry drop‑box vault; Granite and marble finishes with high ceilings on the main level


