Residential Income Property with Water
For Sale
$374,999
1144 LAKE HERON DRIVE Unit 2B, Annapolis, MD 21403
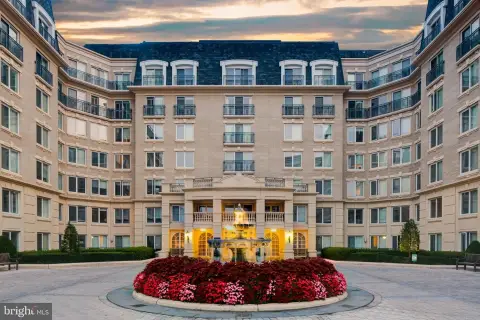
Updated condominium with a modern kitchen, private outdoor space, fireplace, and access to a community pool.
Property Size1,103 SF
Days on Market48
Property Features for 1144 LAKE HERON DRIVE Unit 2B
General Information
Standard status
Active
Size
1,103 SF
Property subtype
Unit/Flat/Apartment
Units
Unit Mix
1 x 2BR/2BA
Multifamily Units
1
Taxes and HOA fees
Annual Taxes
$4,485
Amenities
fireplace
private deck
community pool
Building Details
Building Size
1,103 SF
Year Built
1987
Listing Agency:
Fathom Realty MD, LLC
Listed By:
stacey canas · License #678716
(240) 416-1395
Source:
Bradkappel
Added: Aug 20
Changed: Oct 3
Last Checked: Oct 6 at 12:21AM
Displayed information is deemed reliable but is not guaranteed and should be independently verified. All listing content including descriptions, pricing, images are the copyrighted material of Fathom Realty MD, LLC
Investment Insights
Based on property information with market context.
This residential income property is a 2-bedroom, 2-bathroom condominium built in 1987. Interior improvements include soft-close kitchen cabinets, quartz countertops, new flooring, and fresh paint throughout. A fireplace adds a defined gathering area, while the private deck extends from the bedroom and overlooks the water.
The condominium sits next to the community pool and is positioned near shopping, dining, and everyday conveniences. The combination of updated finishes, private outdoor space, water views, and on-site recreation creates a practical residential offering.
The condominium sits next to the community pool and is positioned near shopping, dining, and everyday conveniences. The combination of updated finishes, private outdoor space, water views, and on-site recreation creates a practical residential offering.
Key Highlights
- 2‑bedroom, 2‑bathroom condominium built in 1987
- Updated kitchen with soft‑close cabinets and quartz countertops
- New flooring and fresh paint throughout
Financial Insights
Estimated NOI and Cap Rate
NOI / Yr
$14,886
Cap Rate
3.97%
Suggested Prices Based on Cap Rates
Cap Rate 5%
$297,720
$297.7K
Cap Rate 7%
$212,657
$212.7K
Cap Rate 9%
$165,400
$165.4K
Market Conditions
NOI Build-Up for 1,103 SF
Gross rent
$28.9K $26.16/SF
− Vacancy
−$1.8K −$1.62/SF
EGI
$27.1K $24.54/SF
− OpEx
−$12.2K −$11.04/SF
NOI
$14.9K $13.50/SF
Area
Anne Arundel County, MD
Vacancy
6.20%
Lease Rate
$26.16 /SF/Yr
Expense Ratio
45.00%
Simulate Cap Rate and NOI
Suggested Prices Based on Cap Rates
Cap Rate 5%
$297,720
Cap Rate 7%
$212,657
Cap Rate 9%
$165,400
Alternative Uses
Best Use
Apartment 5plus
$212.7K
$186.1K – $248.1K
NOI $14,886 @ 7.0% cap · market cap 3.97%
Second Best
—
—
no second resolved use
Theoretical Best
Office A
$322.7K
$282.3K – $376.4K
NOI $22,586 @ 7.0% cap · market cap 6.02%
Zoning and permitted uses should be independently verified with authorities.
Property Analytics
Unlock full access to Insights
Subscribe to Realmo Intelligence
Open Analytics
Current Use
Lease Details
1
Residential units
Location Intelligence
Trade Area within ½ mile
273
Businesses Nearby
Explore this area
Business Placement
Demographics for 21403, MD
31,521
Population
15,479
Households
2
Avg Household Size
42
Median Age
58%
College-Educated
91%
High-School Grad
9.3 sq mi
ZIP Area
3,389
Density / Sq Mi
$115,068
Median Household Income
$64,638
Median Earnings
$1,872
Median Rent
$566,900
Median Home Value
Check the figures for this property
Cap Rate, Value Estimation, Potential NOI and more
View Realmo Analytics

Questions? Ask Rey
Realmo’s AI knows this listing — price, zoning, demand, history. Ask anything.




Frequently Asked Questions
What type of property is this?
Residential income property - Updated condominium with a modern kitchen, private outdoor space, fireplace, and access to a community pool.
Where is this residential income property located?
The property is located at 1144 LAKE HERON DRIVE Unit 2B Annapolis, MD.
What is the asking price?
The asking price for this property is $374,999.
What are key features of this property?
This property features: 2‑bedroom, 2‑bathroom condominium built in 1987; Updated kitchen with soft‑close cabinets and quartz countertops; New flooring and fresh paint throughout


