Mixed-Use Building Near Loyola
For Sale
$4,600,000
1244 W Devon, Chicago, IL 60660
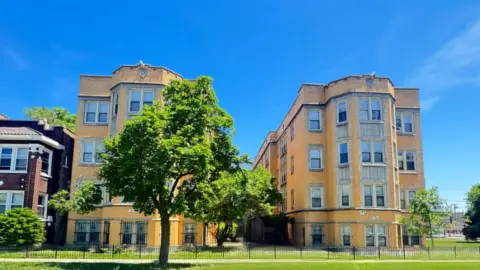
11 unit mixed-use building located two blocks from the Loyola University Campus
Property Size21,080 SF
Lot Size0.48 Acres
Price / SF$218.22
Days on Market628
Property Features for 1244 W Devon
General Information
Standard status
Active
Property type
Other mixed-use properties, Multifamily properties, Residential income homes, Mixed-use properties, Residential income properties, Investment properties
Size
21,080 SF
Elevators
N/A
Lot size
0.48 Acres
Building Details
Year Built
2016
Buildings
1
Stories
3
Units
11
Listed By:
Jake Parker
(585) 319-1421
Added: Jan 17, 2025
Changed: Mar 16
Investment Insights
Based on property information with market context.
This eleven-unit mixed-use building, constructed in 2016, is located two blocks from Loyola University in Chicago's Edgewater neighborhood. The property has a history of near-zero vacancy due to high demand from students. The commercial space is fully occupied under a triple-net lease, providing stable income. The residential units feature spacious layouts, multiple bathrooms, in-unit laundry, in-unit HVAC systems, and modern finishes. The current tenant base primarily consists of students, many with parent co-signors. The property's location offers upside potential; new ownership could increase rental income by implementing a dedicated student housing management strategy and transitioning to per-bed leases. This cash-flowing asset represents an opportunity in a submarket with minimal comparable rental properties. The building has a size of 21,080 square feet and sits on a 0.48-acre lot. This property is an investment opportunity for those seeking a stable, high-demand asset with growth potential.
Key Highlights
- Student tenants with near zero historical vacancy
- Fully occupied commercial space with NNN lease
- Minimal amount of similar rental product in submarket
Financial Insights
Estimated NOI and Cap Rate
NOI / Yr
$355,725
Cap Rate
7.73%
Suggested Prices Based on Cap Rates
Cap Rate 5%
$7,114,500
$7.1M
Cap Rate 7%
$5,081,786
$5.1M
Cap Rate 9%
$3,952,500
$4.0M
Market Conditions
NOI Build-Up for 21,080 SF
Gross rent
$632.4K $30.00/SF
− Vacancy
−$63.2K −$3.00/SF
EGI
$569.2K $27.00/SF
− OpEx
−$213.4K −$10.13/SF
NOI
$355.7K $16.88/SF
Area
Chicago, IL
Vacancy
10.00%
Lease Rate
$30.00 /SF/Yr
Expense Ratio
37.50%
Simulate Cap Rate and NOI
Suggested Prices Based on Cap Rates
Cap Rate 5%
$7,114,500
Cap Rate 7%
$5,081,786
Cap Rate 9%
$3,952,500
Alternative Uses
Best Use
Mixed Use
$5.08M
$4.45M – $5.93M
NOI $355,725 @ 7.0% cap · market cap 7.73%
Second Best
Multifamily LT 5
$5.02M
$4.39M – $5.86M
NOI $351,399 @ 7.0% cap · market cap 7.64%
Theoretical Best
Office A
$9.94M
$8.70M – $11.60M
NOI $695,741 @ 7.0% cap · market cap 15.12%
Zoning and permitted uses should be independently verified with authorities.
Property Analytics
Current Use
Location Intelligence
Trade Area within ½ mile
3,289
Businesses Nearby
Explore this area
Business Placement
Demographics for 60660, IL
42,534
Population
23,508
Households
1.8
Avg Household Size
38
Median Age
57%
College-Educated
93%
High-School Grad
1.3 sq mi
ZIP Area
32,718
Density / Sq Mi
$66,206
Median Household Income
$46,871
Median Earnings
$1,286
Median Rent
$287,500
Median Home Value
Market
Vacancy Rate% for Multifamily in Midwest region

Questions? Ask Rey
Realmo’s AI knows this listing — price, zoning, demand, history. Ask anything.


Frequently Asked Questions
What type of property is this?
Mixed-use property - 11 unit mixed-use building located two blocks from the Loyola University Campus
Where is this mixed-use property located?
The property is located at 1244 W Devon Chicago, IL.
What is the asking price?
The asking price for this property is $4,600,000.
What are key features of this property?
This property features: Student tenants with near zero historical vacancy; Fully occupied commercial space with NNN lease; Minimal amount of similar rental product in submarket


