Six-Unit Apartment
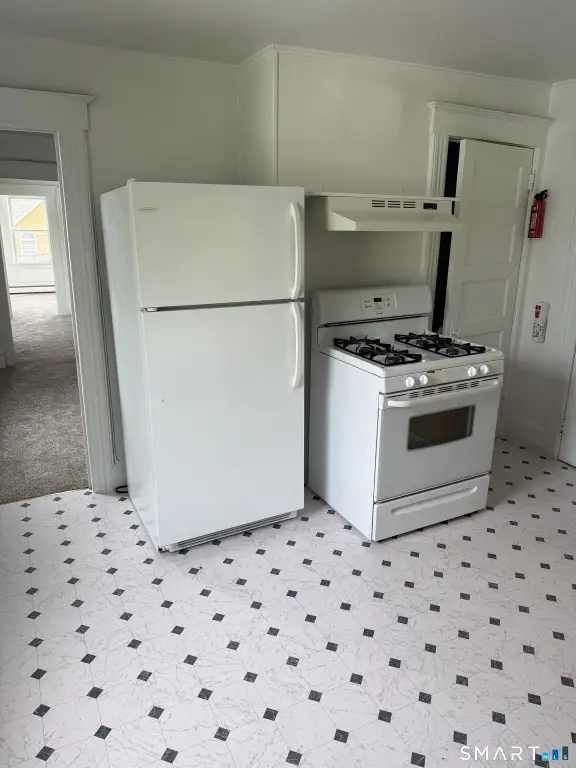
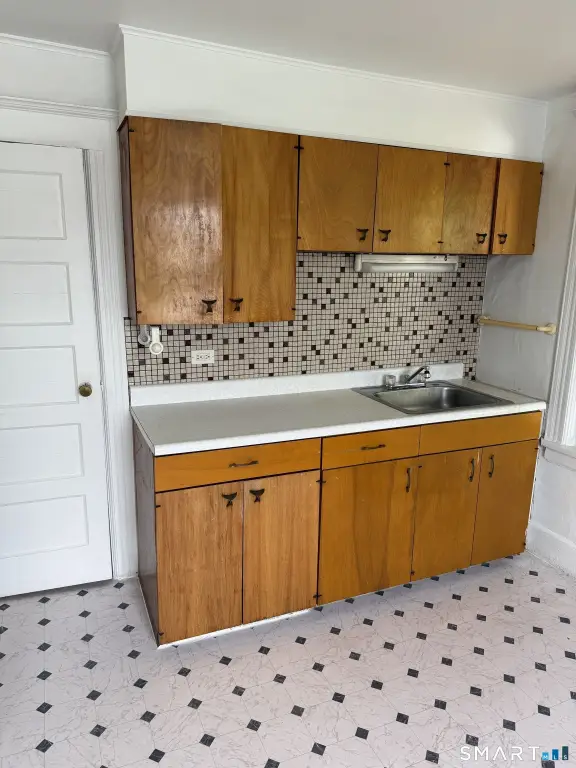
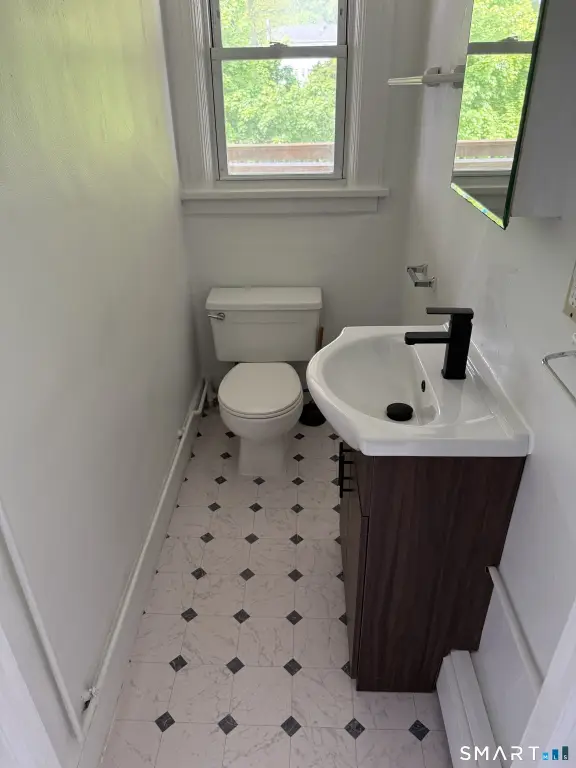
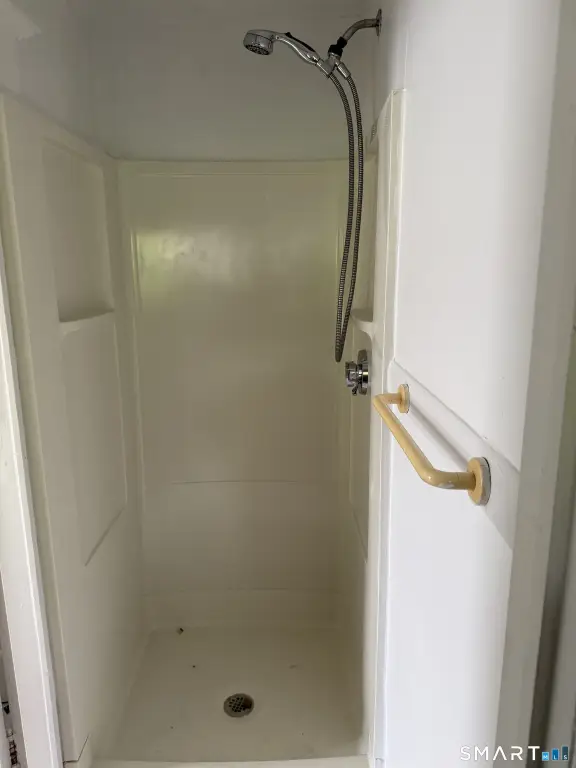
For Sale
$1,850,000
Pending
113 Seaside Avenue, Stamford, CT 06902
Multi-Family For Sale, Units are Side-by-Side, Stamford, CT
Property Size4,752 SF
Lot Size0.21 Acres
Days on Market94
Property Features for 113 Seaside Avenue
General Information
Property type
Residential Multi Family
Property subtype
Other
Zoning
R5
Bedrooms
12
Bathrooms
6
Full bathrooms
6
Rooms
Bedroom 10, Bedroom 2, Bedroom 7, Bathroom 5, Bathroom 1, Basement, Bedroom 8, Bedroom 6, Bedroom 11, Bedroom 9, Bedroom 4, Bedroom 5, Bedroom 12, Bathroom 4, Bedroom 3, Bathroom 2, Bathroom 3, Bedroom 1, Bathroom 6
Parking
9
Basement
Full, Unfinished, Concrete
Lot features
Level Lot
Elementary school
K.T. Murphy
High school
Stamford
Directions
Off i95 to exit 9. Onto Seaside Ave building on right.
Subdivision
Cove
Standard status
Pending
Size
4,752 SF
Lot size
0.21 Acres
Taxes and HOA fees
Tax Year
2027
Tax Annual Amount
19200
Utilities
Sewer type
Public Sewer
Heating system
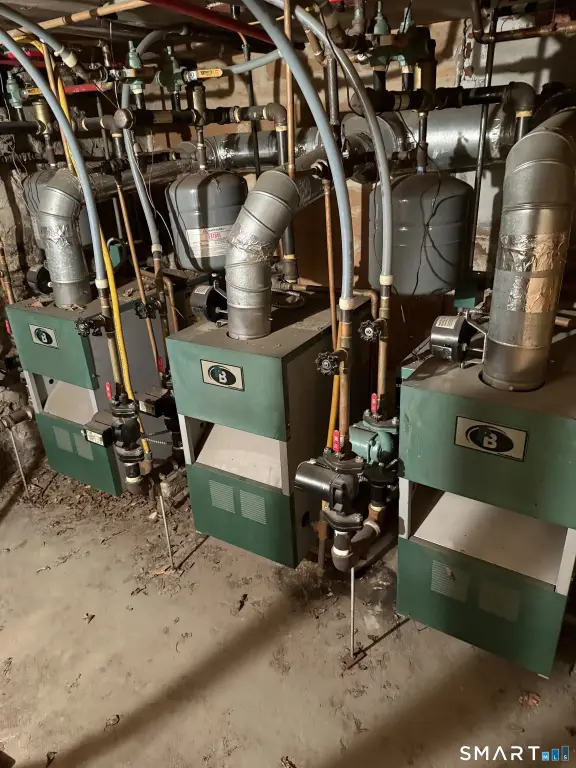
Natural Gas, Hot Water(Heating), Baseboard
Cooling system
Window Unit(s)
Water source
Public
Building Details
Year built
1930
Architectural style
Other
Listing Agency:
BHGRE Shore & Country
Listed By:
Enrico Difilippo
(203) 504-5005
Added: Jul 21
Changed: Oct 19
Last Checked: Oct 22 at 2:06PM
MLS# 24157699
Copyright © 2026 SmartMLS, Inc. All rights reserved. All information provided by the listing agent/broker is deemed reliable but is not guaranteed and should be independently verified.

Ask AI about this property
Review the available facts, identify missing information and prepare questions for the agent.
Investment Insights
Based on property information with market context.
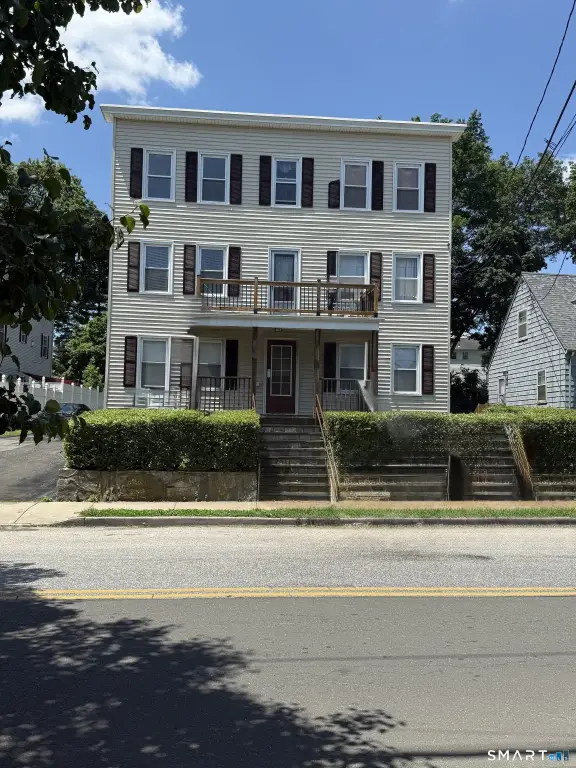
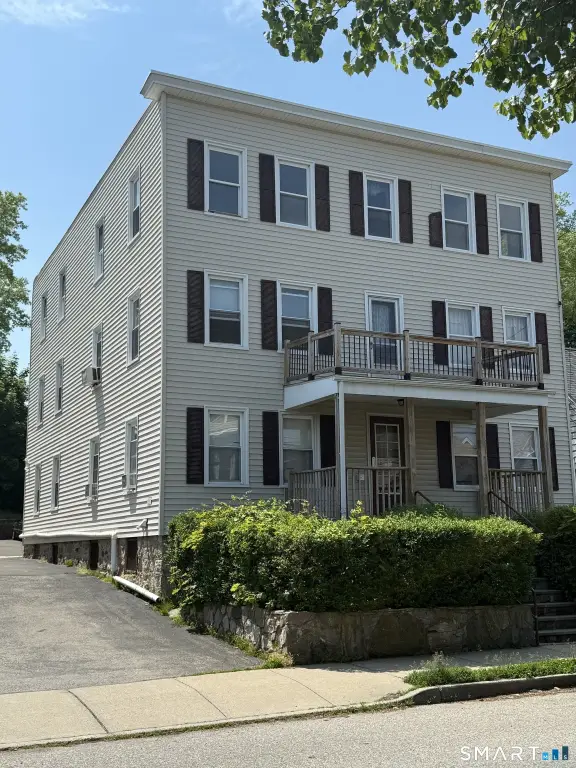
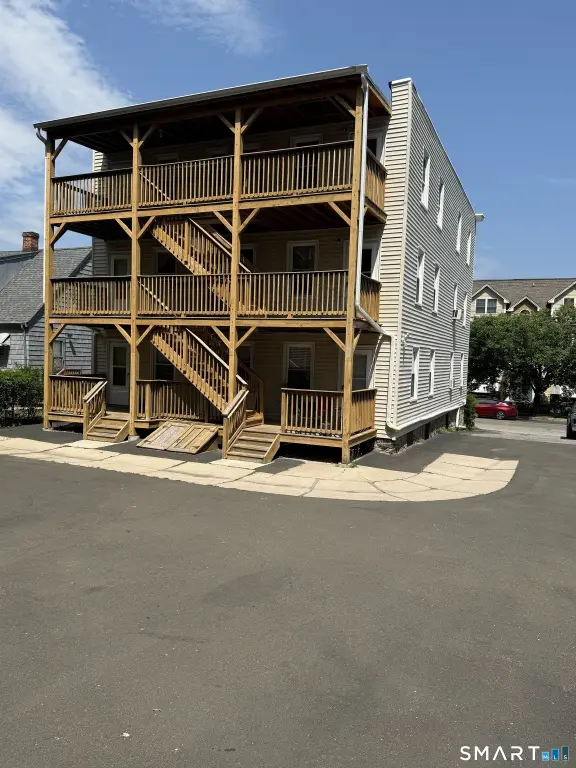
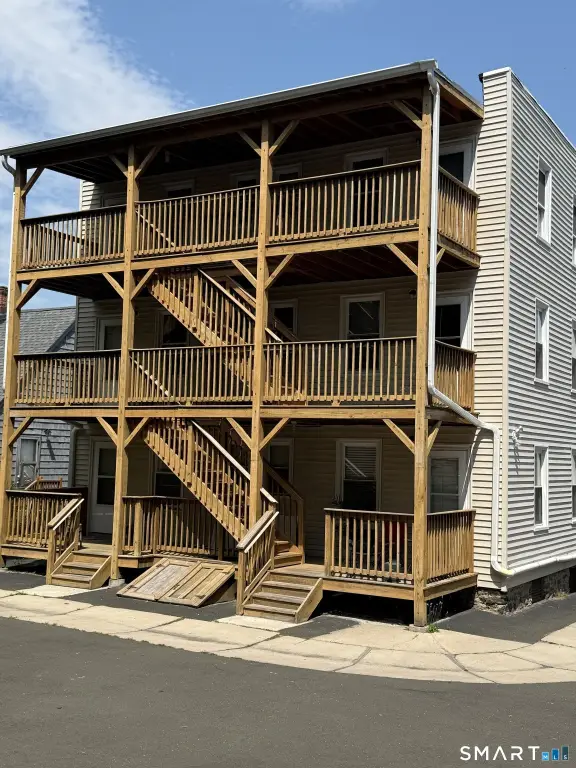
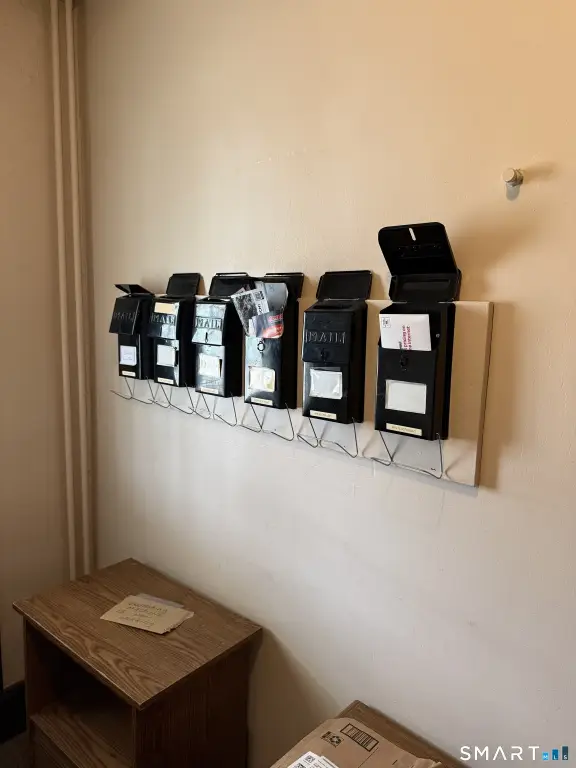
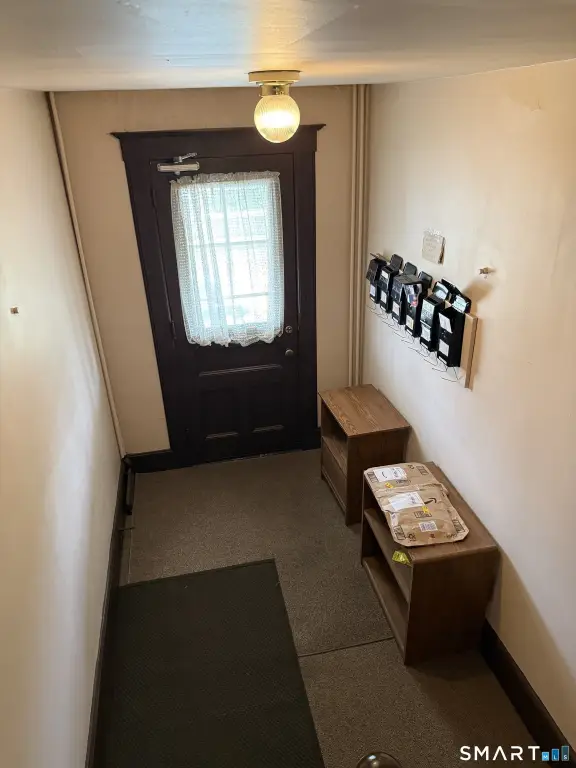
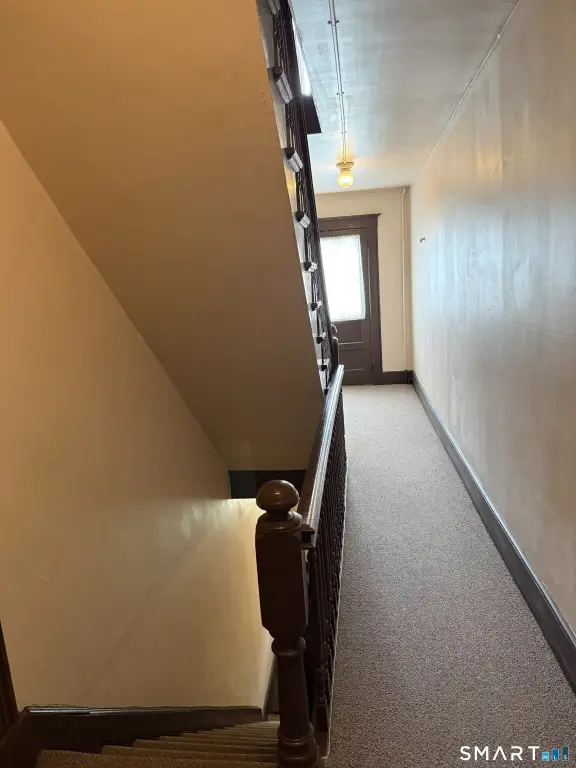
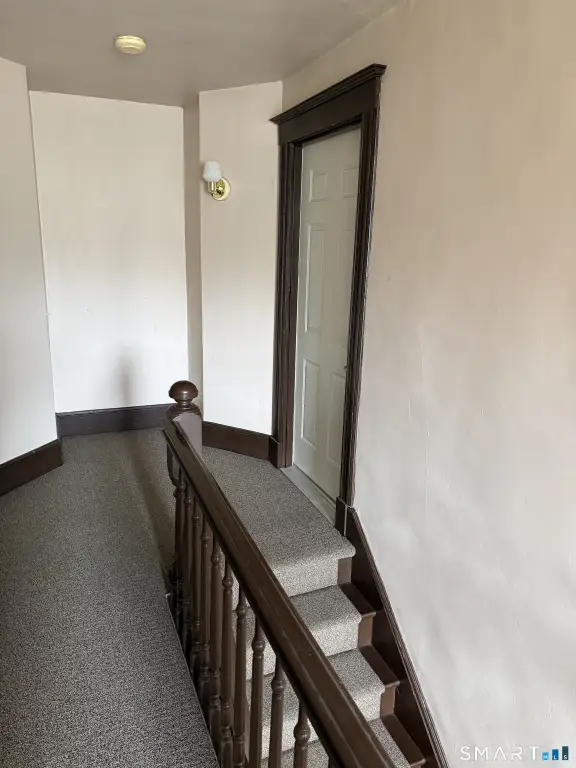
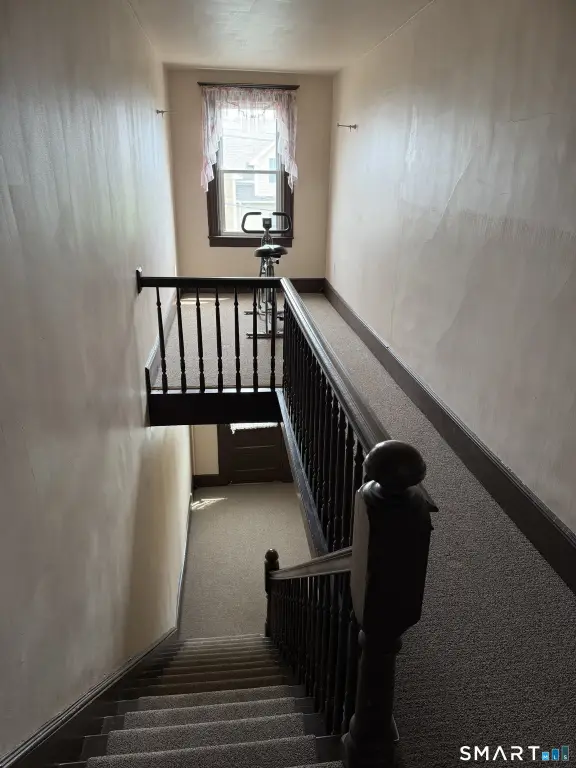
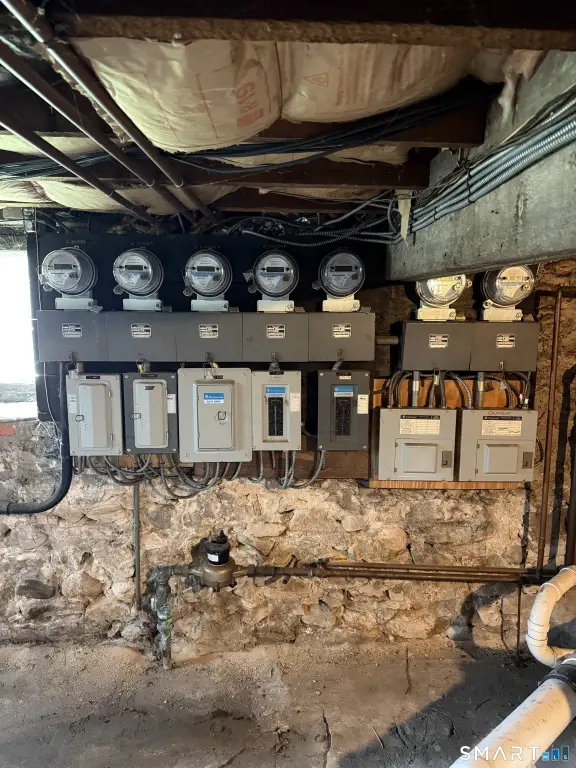
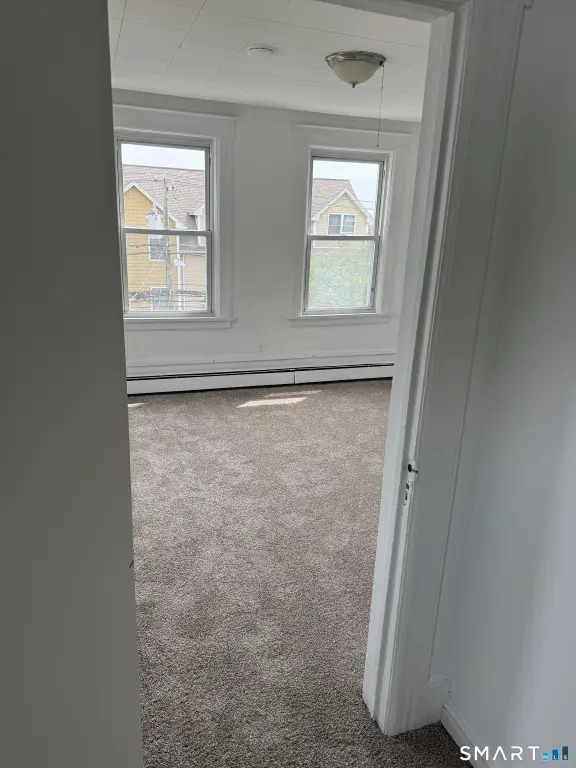
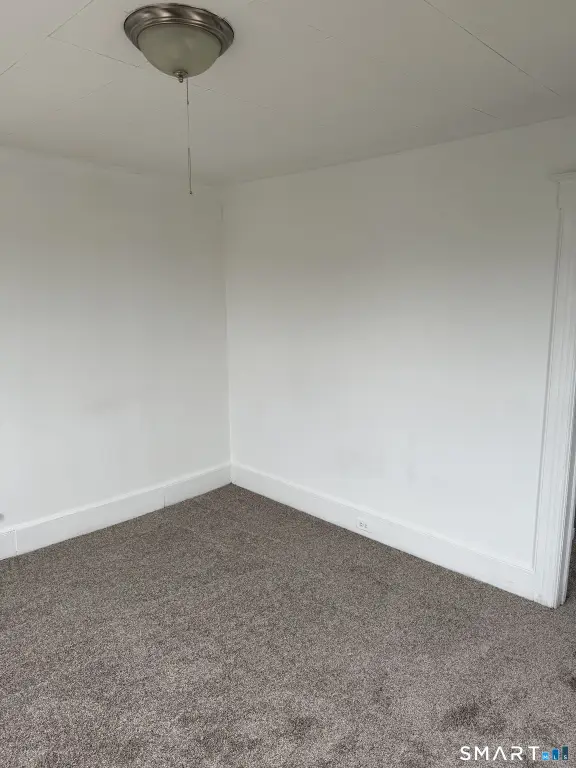
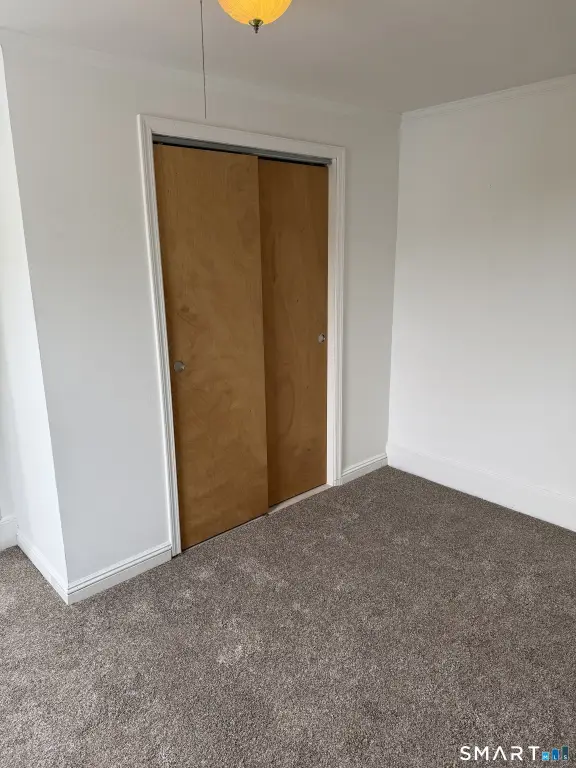
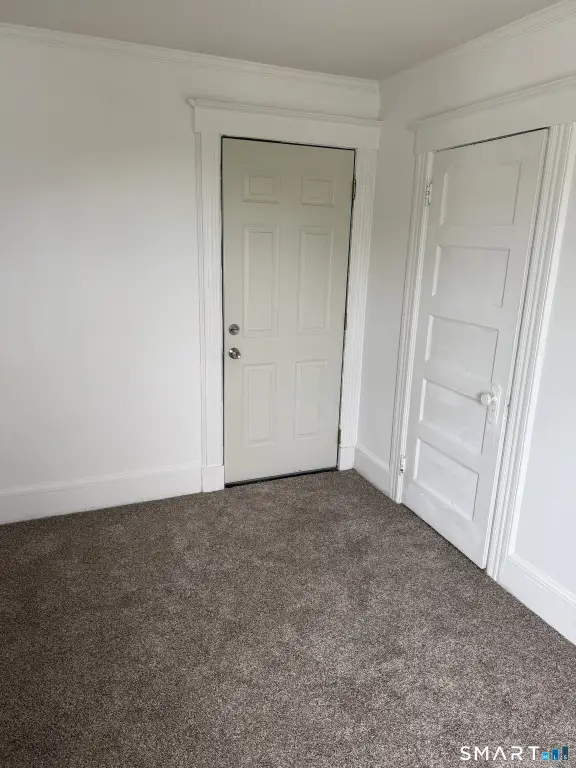
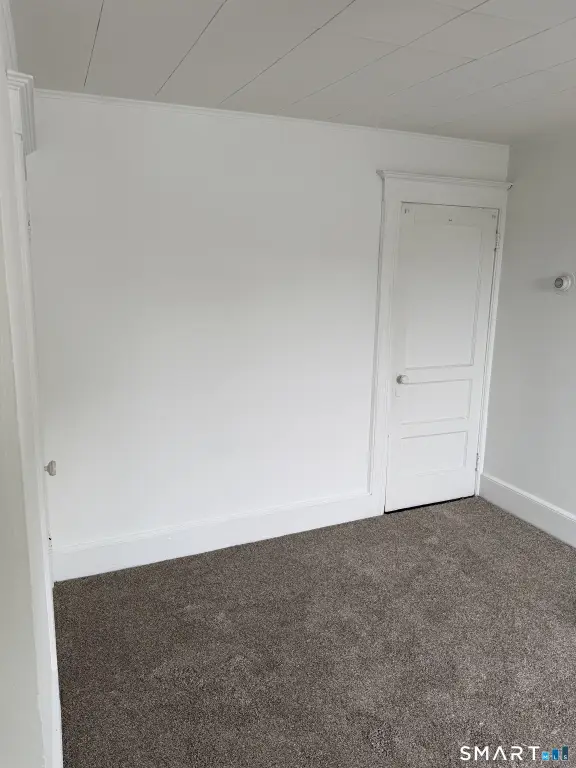
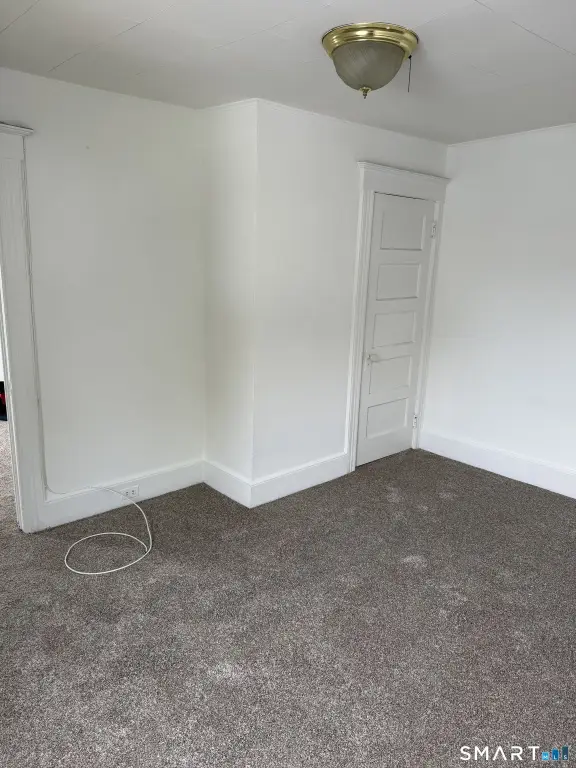
This 4,752-square-foot multifamily property contains six apartments across three floors, with two residences on each level. Each apartment has a four-room railroad layout, separate gas and electric meters, and dedicated basement storage. Tenants are responsible for heat, hot water, and electricity. The building uses natural-gas hot-water baseboard heat and window-unit cooling.
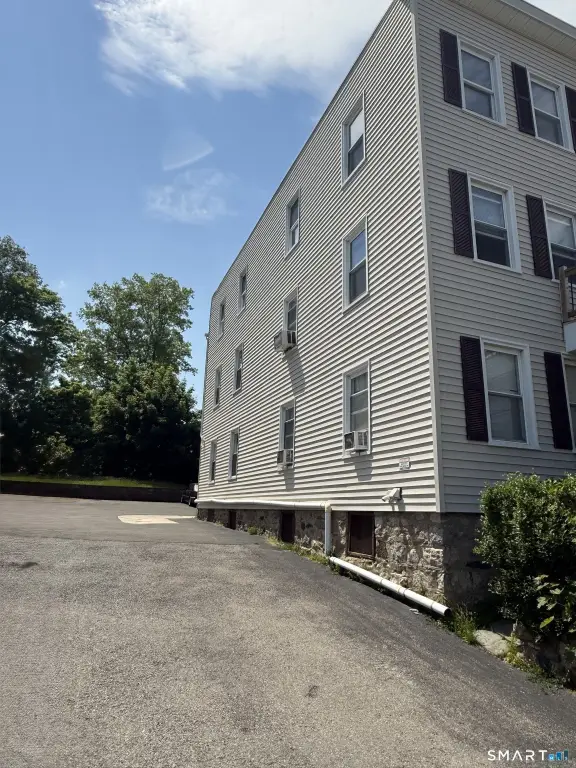
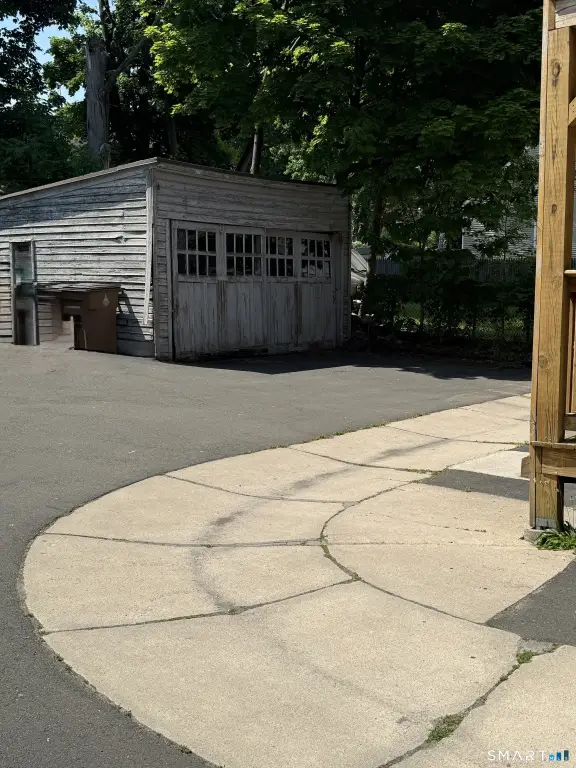
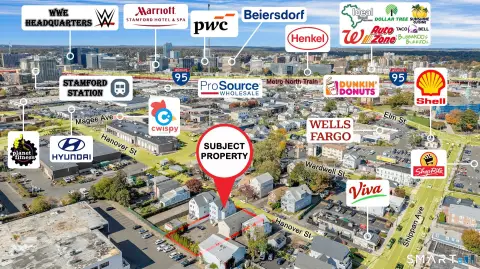
Constructed in 1930 and situated in Stamford’s Cove area, the property includes approximately 10 off-street parking spaces. Cove beach is within walking distance, and a bus stop is located across the street. Public water and public sewer serve the building.
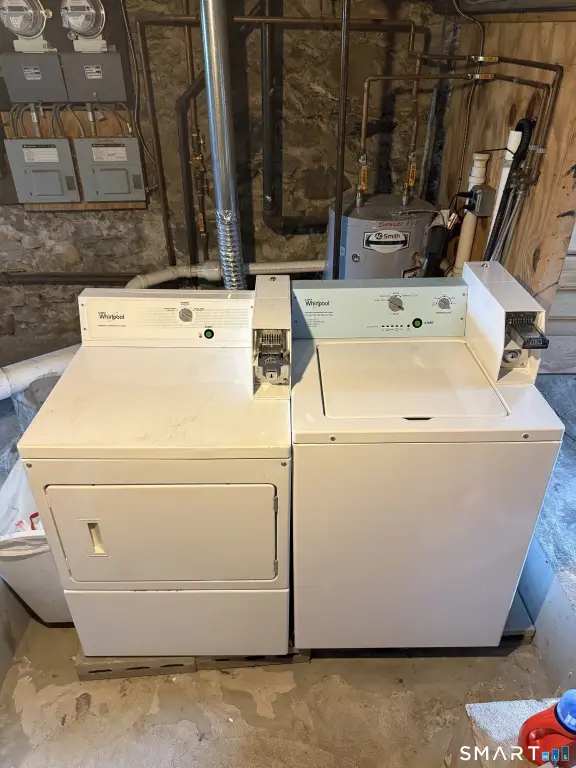
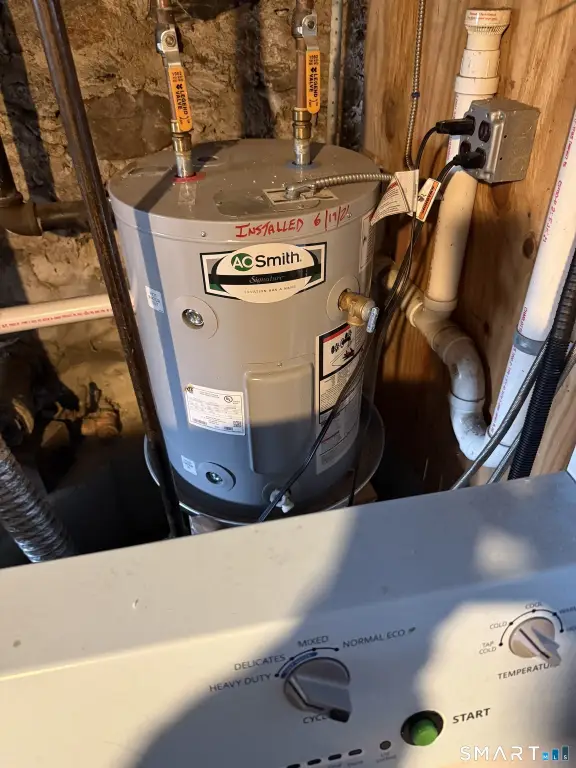
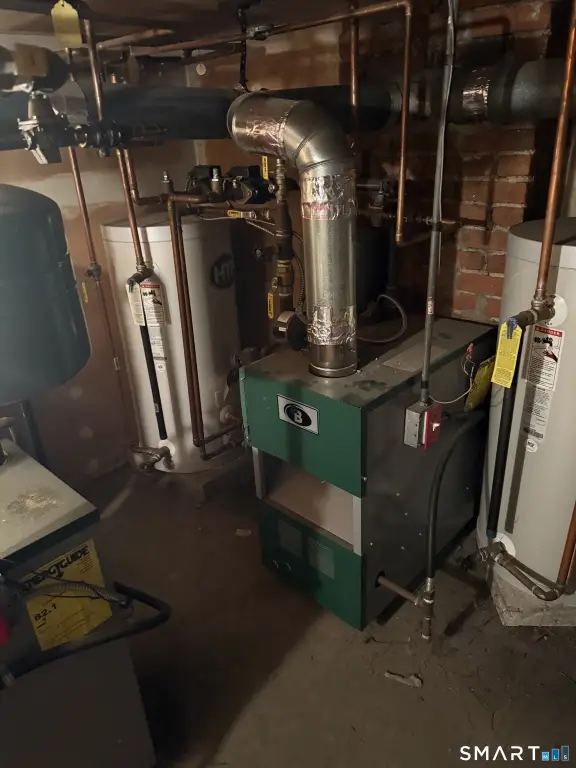
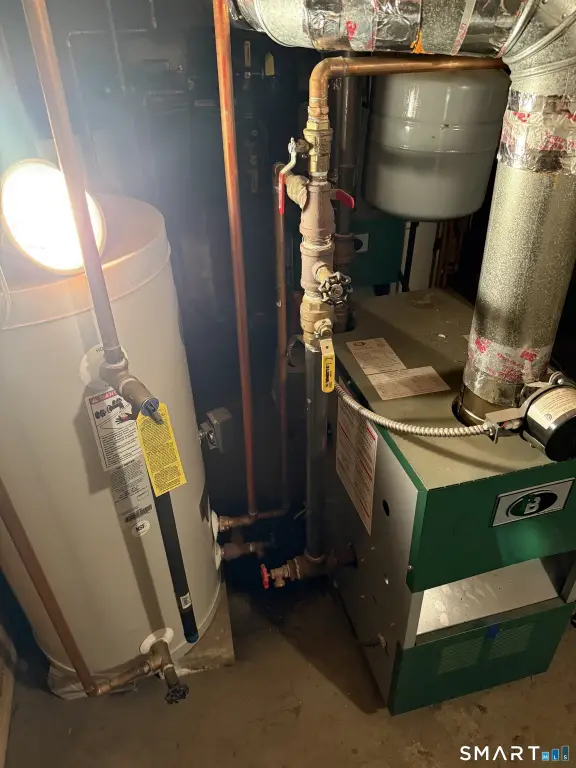
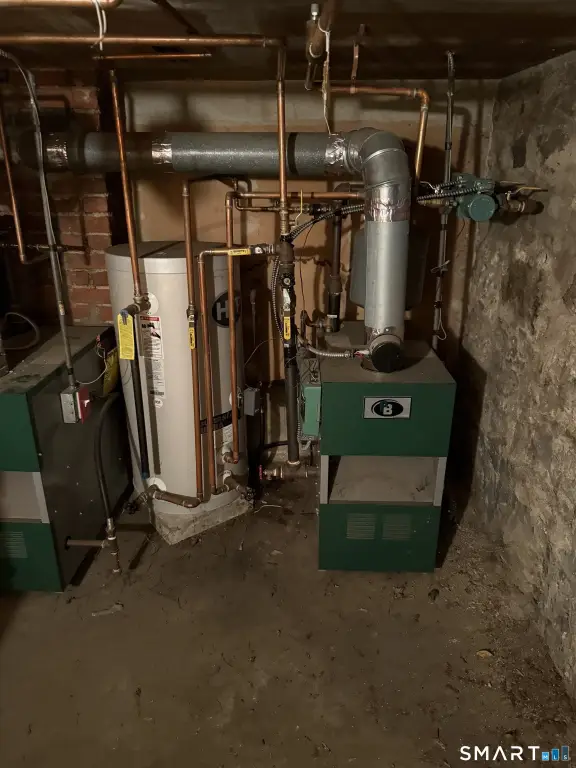
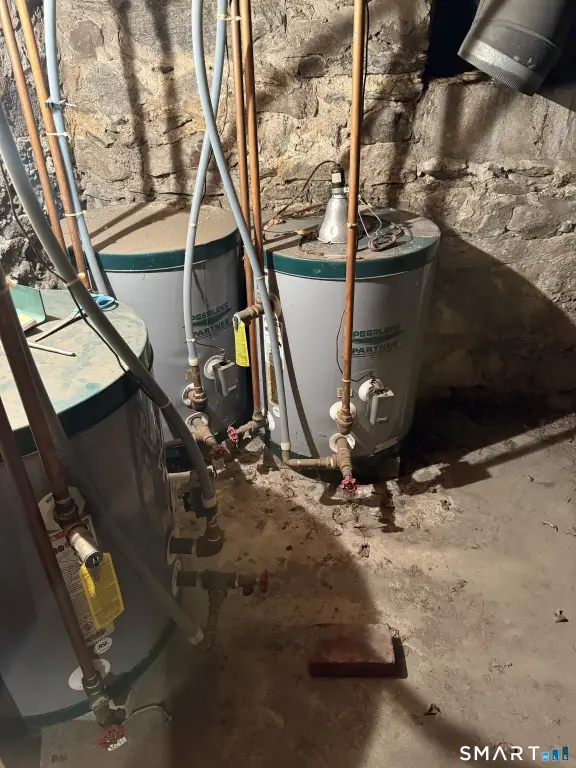
Six boilers and hot-water heaters were replaced within the last 7 years. Electrical meters and fuse panels have been updated, while the basement has a sprinkler system and the building is equipped with remotely controlled smoke and carbon monoxide detectors following fire department approval.
Constructed in 1930 and situated in Stamford’s Cove area, the property includes approximately 10 off-street parking spaces. Cove beach is within walking distance, and a bus stop is located across the street. Public water and public sewer serve the building.
Six boilers and hot-water heaters were replaced within the last 7 years. Electrical meters and fuse panels have been updated, while the basement has a sprinkler system and the building is equipped with remotely controlled smoke and carbon monoxide detectors following fire department approval.
Key Highlights
- Six apartments in a three‑story building, with two units per floor
- 4,752 square feet on a 0.21‑acre lot
- Separate gas and electric metering for all 6 apartments
Financial Insights
Estimated NOI and Cap Rate
NOI / Yr
$81,784
Cap Rate
4.42%
Suggested Prices Based on Cap Rates
Cap Rate 5%
$1,635,680
$1.6M
Cap Rate 7%
$1,168,343
$1.2M
Cap Rate 9%
$908,711
$908.7K
Market Conditions
NOI Build-Up for 4,752 SF
Gross rent
$158.5K $33.36/SF
− Vacancy
−$9.8K −$2.07/SF
EGI
$148.7K $31.29/SF
− OpEx
−$66.9K −$14.08/SF
NOI
$81.8K $17.21/SF
Area
Stamford, CT
Vacancy
6.20%
Lease Rate
$33.36 /SF/Yr
Expense Ratio
45.00%
Simulate Cap Rate and NOI
Suggested Prices Based on Cap Rates
Cap Rate 5%
$1,635,680
Cap Rate 7%
$1,168,343
Cap Rate 9%
$908,711
Alternative Uses
Best Use
Apartment 5plus
$1.17M
$1.02M – $1.36M
NOI $81,784 @ 7.0% cap · market cap 4.42%
Second Best
—
—
no second resolved use
Theoretical Best
Office A
$1.72M
$1.50M – $2.00M
NOI $120,274 @ 7.0% cap · market cap 6.50%
Zoning and permitted uses should be independently verified with authorities.
How Realmo checks its estimates
Property Analytics
Who owns this building?
See the owner, sales and loan history
Open Analytics
Lease Details
6
Residential units
Yes
Sprinkler system
Yes
Utilities to site
Location Intelligence
Trade Area within ½ mile
800
Businesses Nearby
Explore this area
Business Placement
Demographics for 06902, CT
69,192
Population
30,142
Households
2.3
Avg Household Size
36
Median Age
44%
College-Educated
85%
High-School Grad
10.0 sq mi
ZIP Area
6,919
Density / Sq Mi
$92,527
Median Household Income
$48,285
Median Earnings
$2,139
Median Rent
$515,000
Median Home Value
Check the figures for this property
Cap Rate, Value Estimation, Potential NOI and more
View Realmo Analytics
Market
Vacancy Rate% for Multifamily in Northeast region



Frequently Asked Questions
What type of property is this?
Apartment building - Separate gas and electric metering serves every apartment.
Where is this apartment building located?
The property is located at 113 Seaside Avenue Stamford, CT.
What is the asking price?
The asking price for this property is $1,850,000.
What are key features of this property?
This property features: Six apartments in a three‑story building, with two units per floor; 4,752 square feet on a 0.21‑acre lot; Separate gas and electric metering for all 6 apartments


