Meridian Class A Office
For Sale
Contact for pricing
Pending
1120 S Rackham Way, Meridian, ID 83642
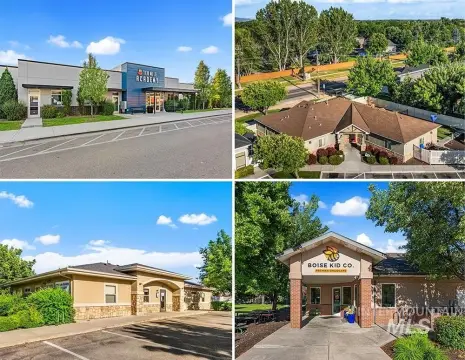
Class A office building in a rapidly growing economic market.
Property Size73,080 SF
Days on Market246
Property Features for 1120 S Rackham Way
General Information
Standard status
Pending
Size
73,080 SF
Class
A
Total Parking Spaces
201
Property subtype
Office
Zoning
General Commercial
Occupancy
100%
Building Details
Year Built
2021
Buildings
1
Stories
3
Tenancy
Multi
Listing Agency:
CBRE - Boise
Listed By:
Kurt Gregg · License #8261576
(208) 644-8000
Source:
Crexi
Added: Feb 2
Changed: Sep 21
Last Checked: Oct 5 at 7:10PM
Displayed information is deemed reliable but is not guaranteed and should be independently verified. All listing content including descriptions, pricing, images are the copyrighted material of CBRE - Boise
Investment Insights
Based on property information with market context.
This Class A office space is located in Meridian, one of Idaho’s fastest-growing cities. The city exhibits strong economic fundamentals that drive robust demand for this type of space. The population of Meridian was approximately 139,740 as of July 2024, reflecting an 18.6% increase since 2020, with an annual growth rate of approximately 3.3%. Ada County has experienced substantial growth, increasing by 85% from 2000 to 2024, with Meridian accounting for 25.6% of the county’s population. The median household income is approximately $142,982, with approximately 2.6 occupants per household. The property benefits from a strategic location and economic drivers in the technology and healthcare sectors. Boise is emerging as a tech hub, attracting startups and remote workers. Rapid population growth supports healthcare systems and professional firms, increasing office requirements. The property encompasses a total area of 73,080 square feet.
Key Highlights
- Located in Meridian, one of Idaho's fastest‑growing cities with a strong economic market.
- Strong population growth in Meridian (18.6% since 2020).
- High median household income in Meridian (±$142,982).
Financial Insights
Estimated NOI and Cap Rate
NOI / Yr
$1,070,768
Cap Rate
5.24%
Suggested Prices Based on Cap Rates
Cap Rate 5%
$21,415,360
$21.4M
Cap Rate 7%
$15,296,686
$15.3M
Cap Rate 9%
$11,897,422
$11.9M
Market Conditions
NOI Build-Up for 73,080 SF
Gross rent
$1.62M $22.20/SF
− Vacancy
−$194.7K −$2.66/SF
EGI
$1.43M $19.54/SF
− OpEx
−$356.9K −$4.88/SF
NOI
$1.07M $14.65/SF
Area
Meridian, ID
Vacancy
12.00%
Lease Rate
$22.20 /SF/Yr
Expense Ratio
25.00%
Simulate Cap Rate and NOI
Suggested Prices Based on Cap Rates
Cap Rate 5%
$21,415,360
Cap Rate 7%
$15,296,686
Cap Rate 9%
$11,897,422
Alternative Uses
Best Use
Office B
$15.30M
$13.38M – $17.85M
NOI $1,070,768 @ 7.0% cap · market cap 5.24%
Second Best
—
—
no second resolved use
Theoretical Best
Office A
$19.29M
$16.87M – $22.50M
NOI $1,349,992 @ 7.0% cap · market cap 6.60%
Zoning and permitted uses should be independently verified with authorities.
Property Analytics
Unlock full access to Insights
Subscribe to Realmo Intelligence
Open Analytics
Current Use
Location Intelligence
Trade Area within ½ mile
341
Businesses Nearby
Explore this area
Business Placement
Demographics for 83642, ID
55,465
Population
22,700
Households
2.4
Avg Household Size
35
Median Age
44%
College-Educated
95%
High-School Grad
41.5 sq mi
ZIP Area
1,337
Density / Sq Mi
$96,361
Median Household Income
$45,824
Median Earnings
$1,629
Median Rent
$492,300
Median Home Value
Check the figures for this property
Cap Rate, Value Estimation, Potential NOI and more
View Realmo Analytics
Market
Vacancy Rate% for Office in West region

Questions? Ask Rey
Realmo’s AI knows this listing — price, zoning, demand, history. Ask anything.




Frequently Asked Questions
What type of property is this?
Office building - Class A office building in a rapidly growing economic market.
Where is this office building located?
The property is located at 1120 S Rackham Way Meridian, ID.
What is the asking price?
The asking price for this property is $20,444,000.
What are key features of this property?
This property features: Located in Meridian, one of Idaho's fastest‑growing cities with a strong economic market.; Strong population growth in Meridian (18.6% since 2020).; High median household income in Meridian (±$142,982).



