Duplex with Detached Tenant
For Sale
Under Contract
$499,000
1115 Danby Road, Ithaca, NY 14850
Residential, Ithaca, NY
Property Size2,476 SF
Lot Size1.10 Acres
Price / SF$201.53
Days on Market92

Ask AI about this property
Review the available facts, identify missing information and prepare questions for the agent.
Property Features for 1115 Danby Road
General Information
Property type
Residential Multi Family
Property subtype
Other
Zoning description
Residential Multi Use
Bedrooms
6
Bathrooms
3
Full bathrooms
2
Half bathrooms
1
Rooms
Bedroom 1, Bedroom 3, Bedroom 2, Bathroom 1, Bathroom 3, Bedroom 4, Basement, Bedroom 6, Bathroom 2, Bedroom 5
Interior features
NaturalWoodwork
Exterior features
PlayStructure, PrivateYard
Fireplace
1
Appliances
ElectricWaterHeater
Lot features
Rectangular, Rectangular Lot, Wooded
Elementary school
South Hill
Middle school
Boynton Middle
High school
Ithaca Senior High
Elementary school district
Ithaca
Middle school district
Ithaca
High school district
Ithaca
Directions
Route 96 South, just past E King on the left
Subdivision
Ithaca-Town-503089
Standard status
Active Under Contract
APN
503089-043-000-0002-013-000-0000
Size
2,476 SF
Lot size
1.10 Acres
Taxes and HOA fees
Tax Annual Amount
9794
Utilities
Heating system
Hot Water(Heating), Natural Gas, Electric (Heating), Baseboard
Water source
Public
Amenities
fireplace
sunroom
hardwood floors
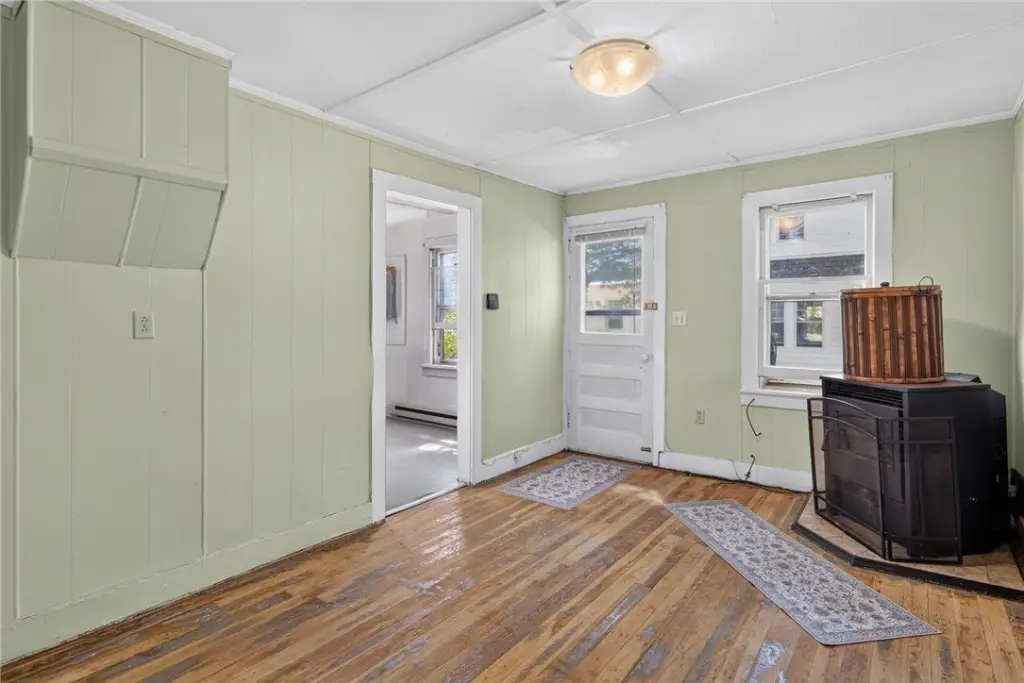
pellet stove
trail access
Building Details
Year built
1941
Floors in Building
2
Number of units
2
Flooring type
Hardwood, Vinyl, Varies
Building materials
Frame, WoodSiding
Roof type
Metal
Architectural style
Other
Listing Agency:
Warren Real Estate of Ithaca Inc. (Downtown)
(607) 257-0666
Listed By:
Rebecca Driscoll · License #30DR0907810
(607) 342-1073
Added: Jul 16
Changed: Oct 10
Last Checked: Oct 15 at 3:06PM
MLS# R1699086
Copyright © 2026 New York State Alliance of MLSs, LLC. All rights reserved. All information provided by the listing agent/broker is deemed reliable but is not guaranteed and should be independently verified.
Investment Insights
Based on property information with market context.
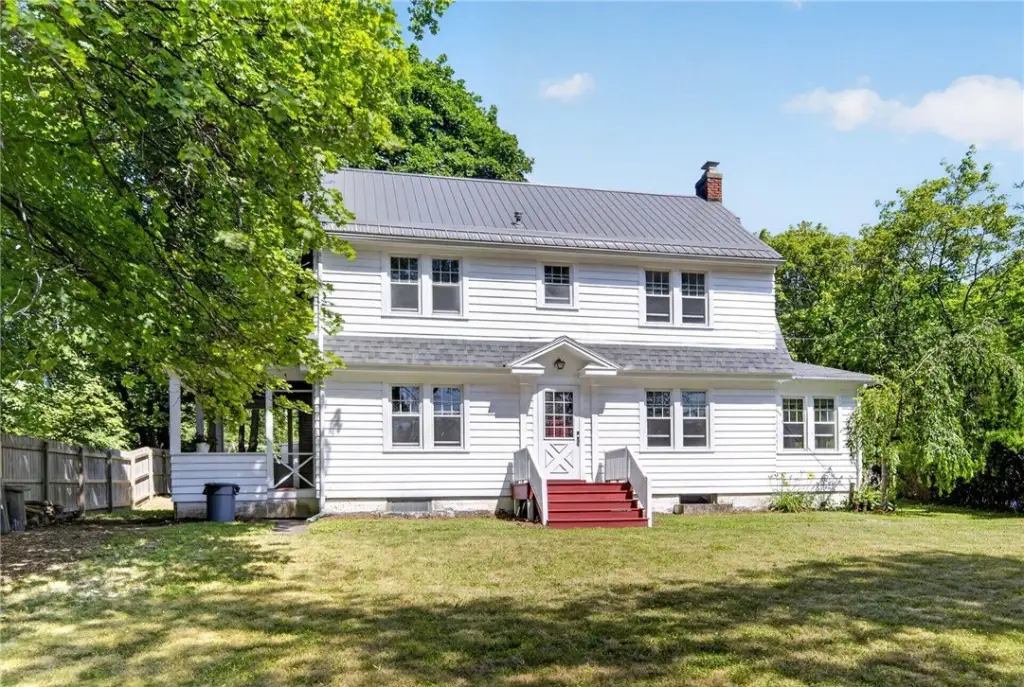
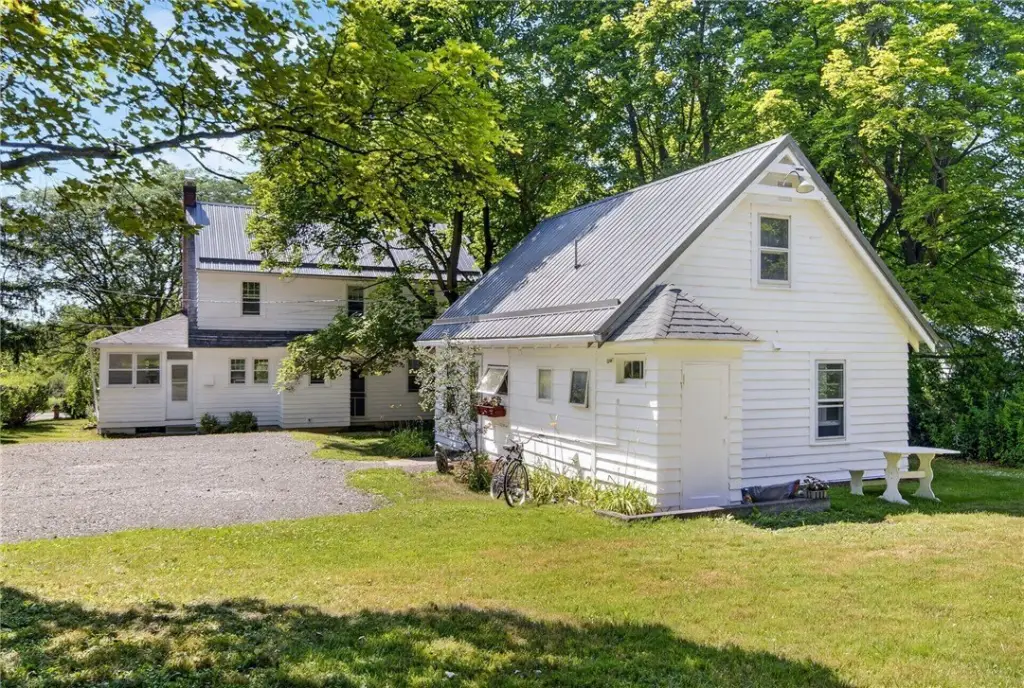
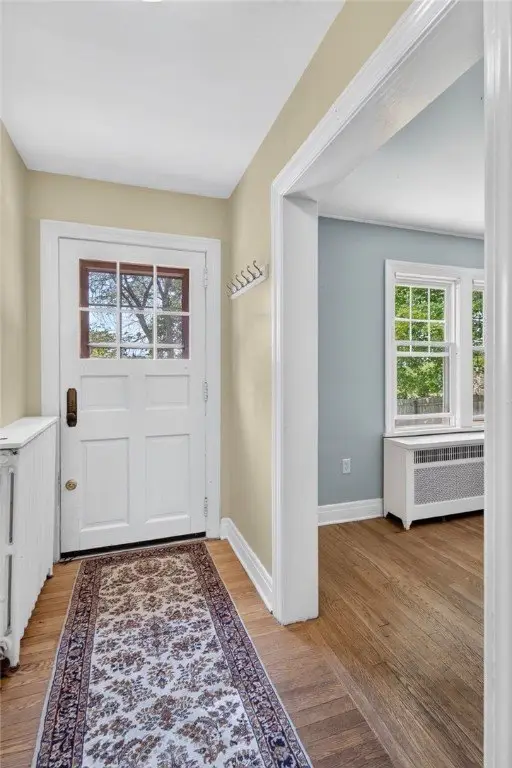
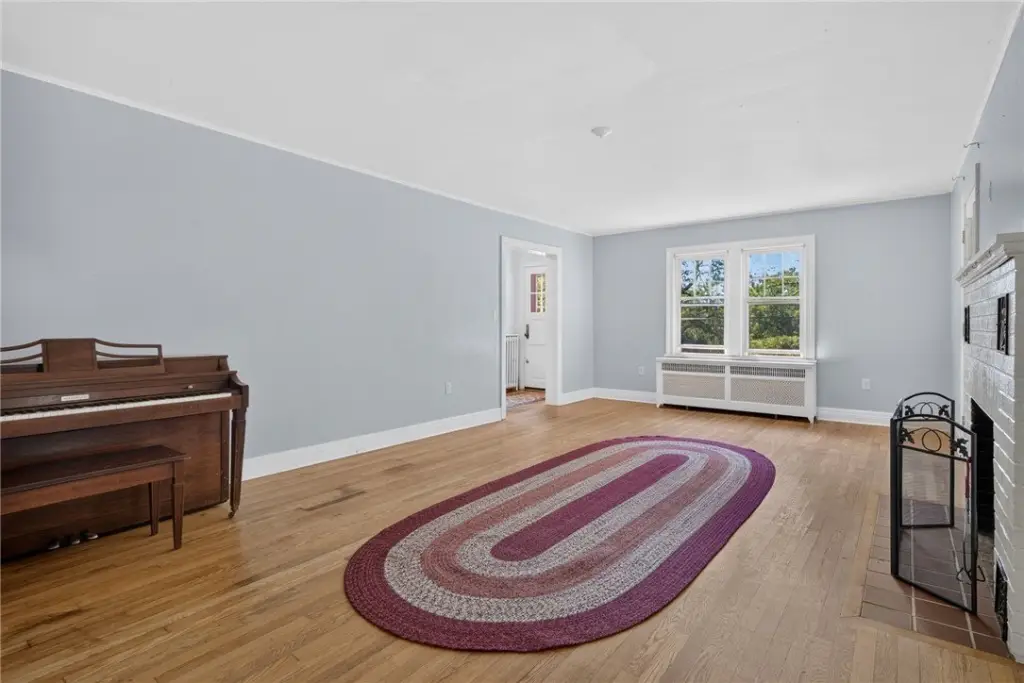
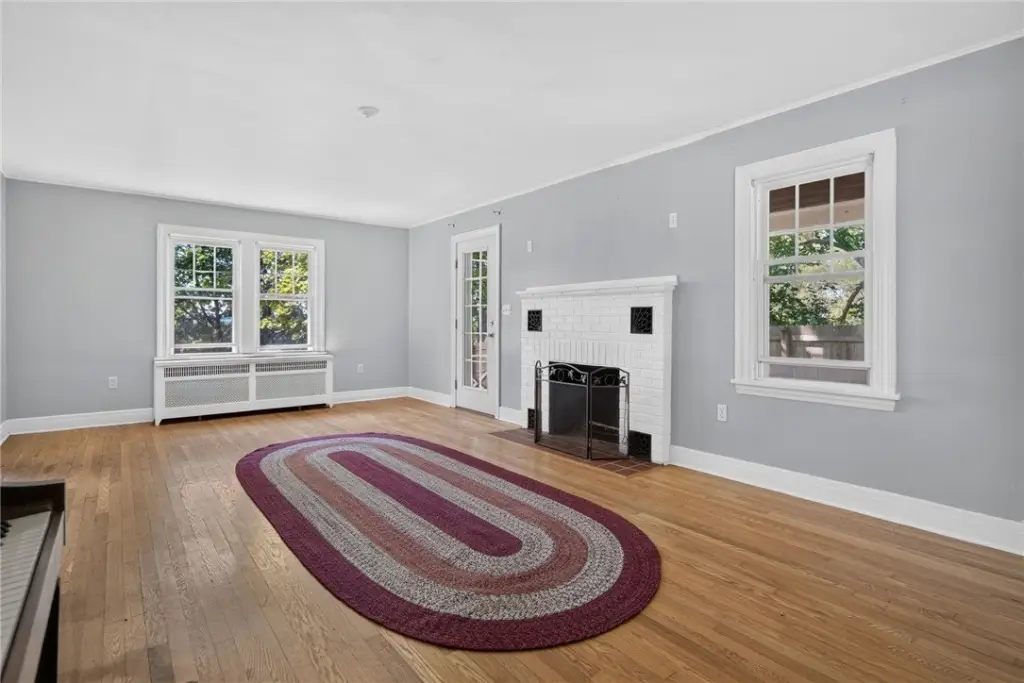
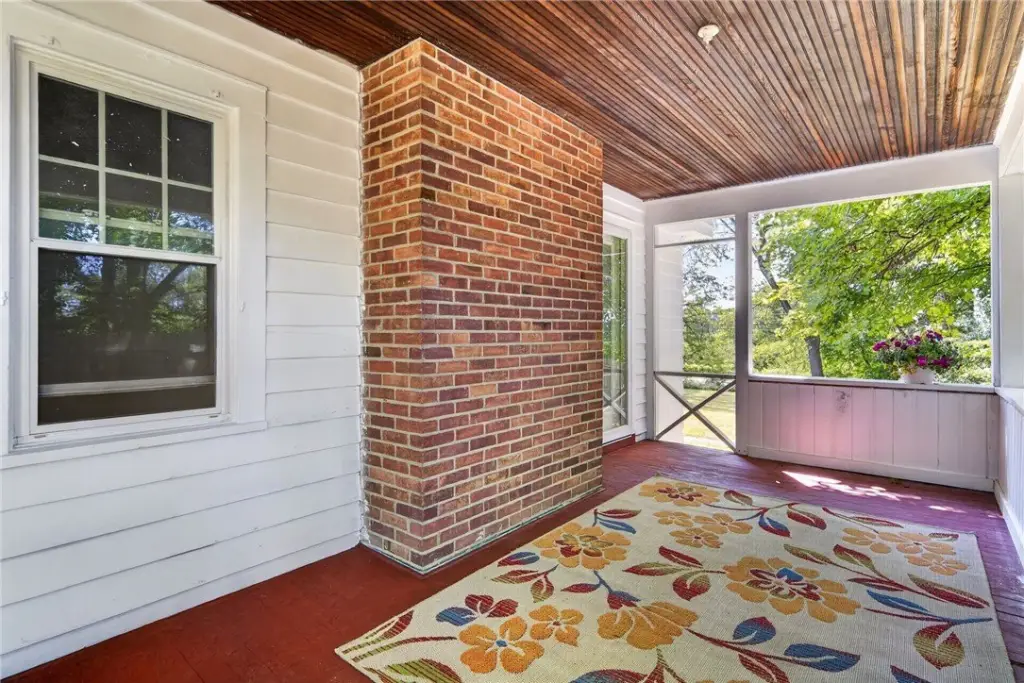
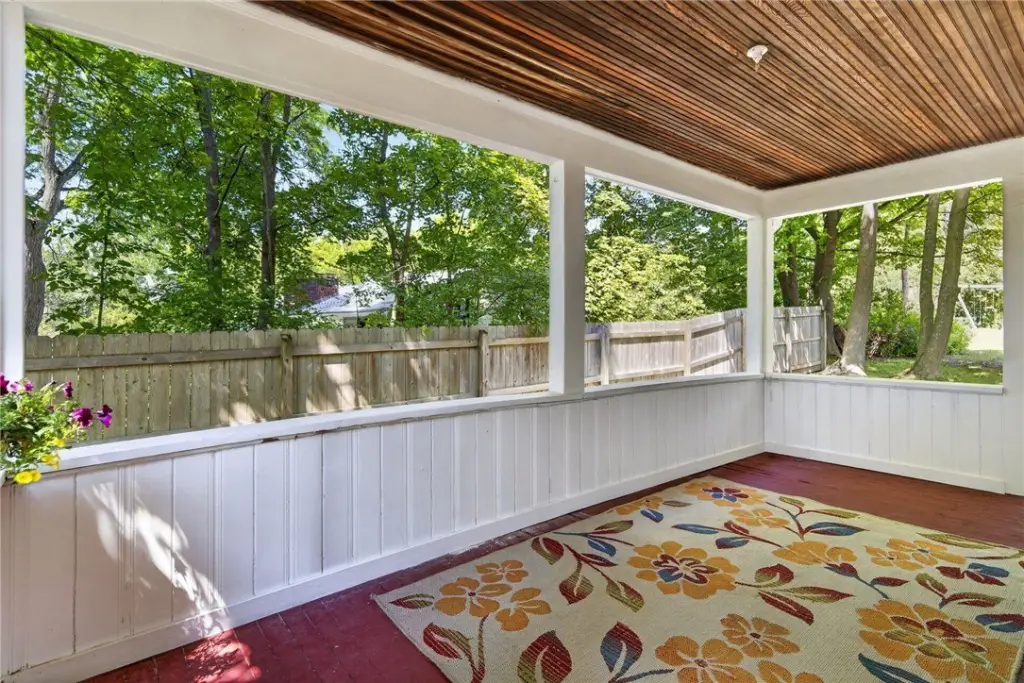
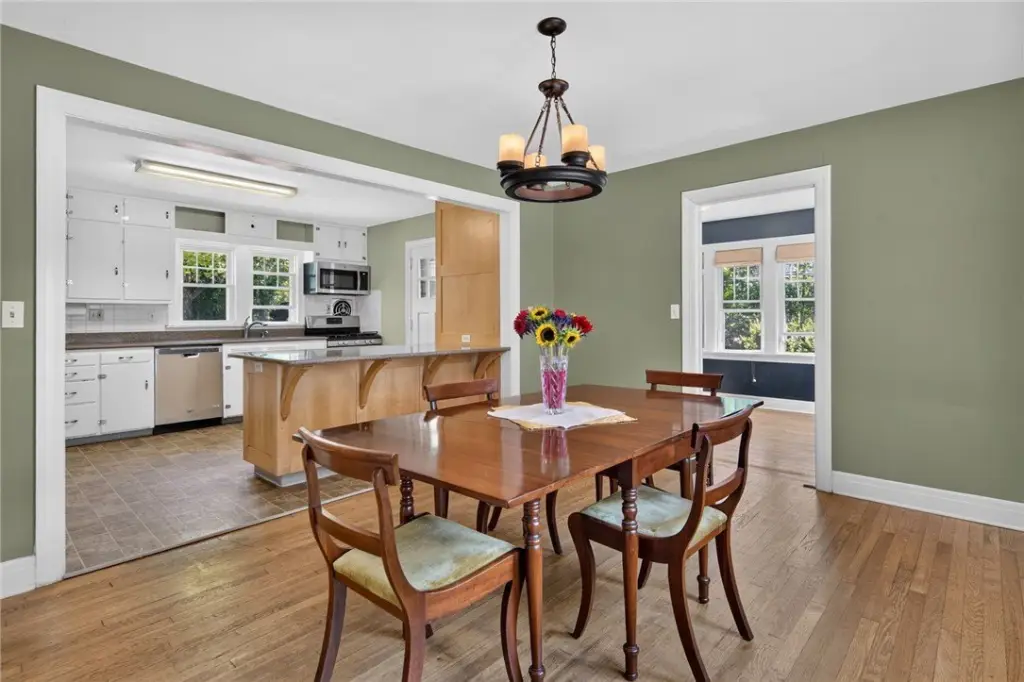
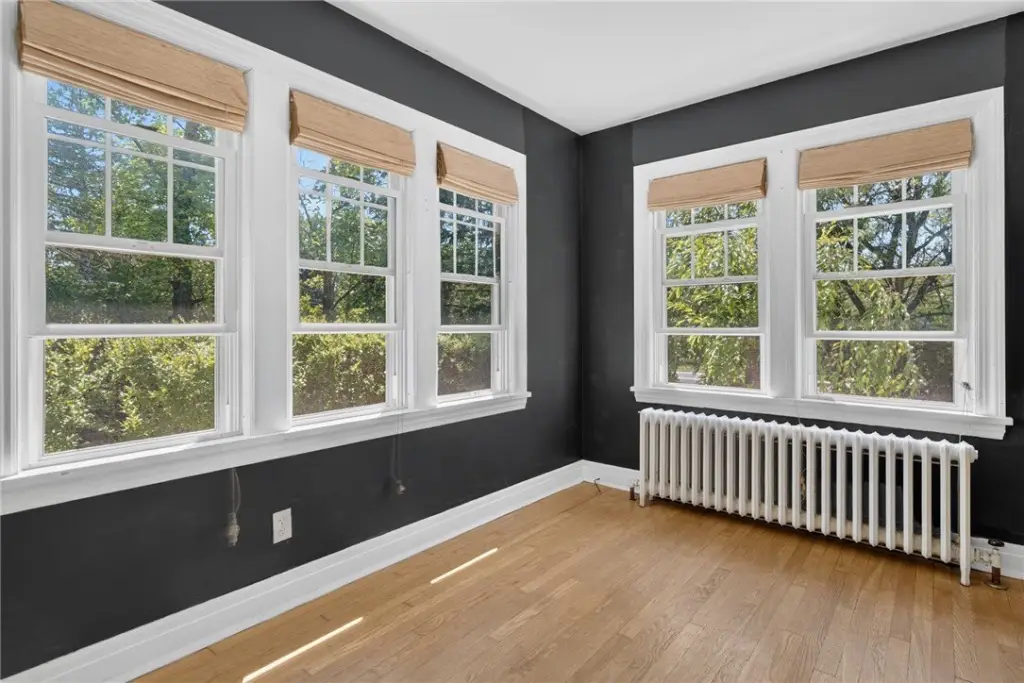
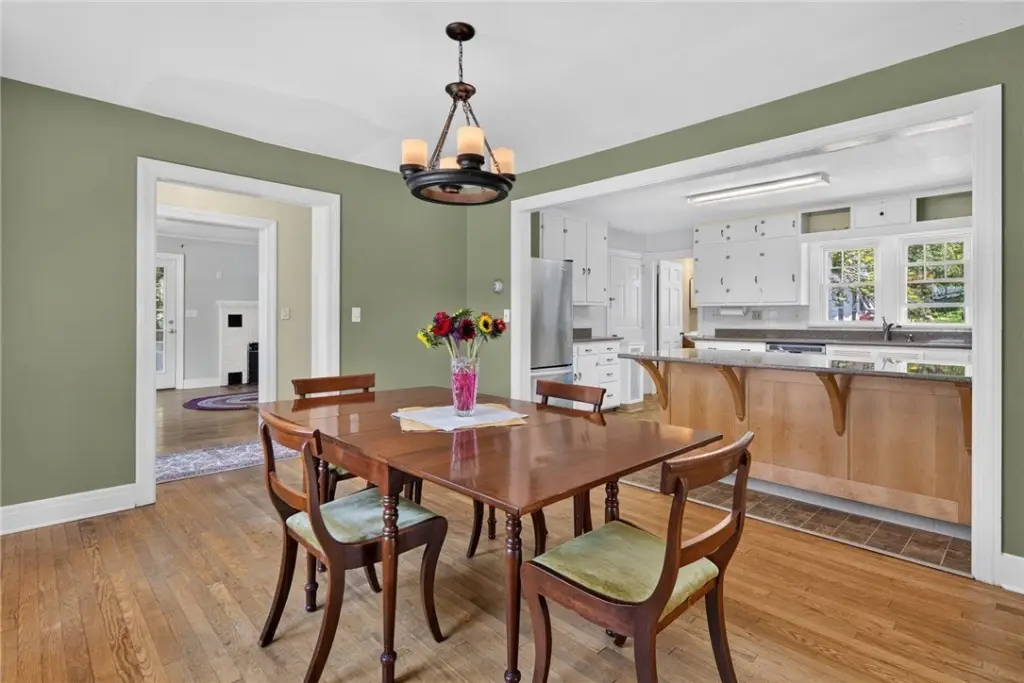
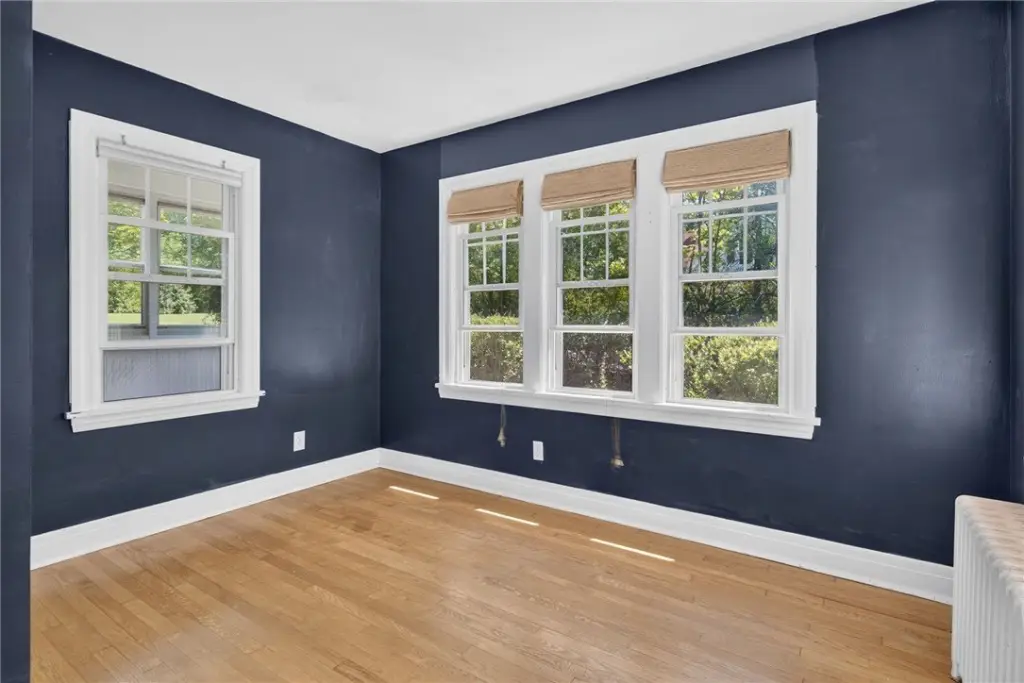
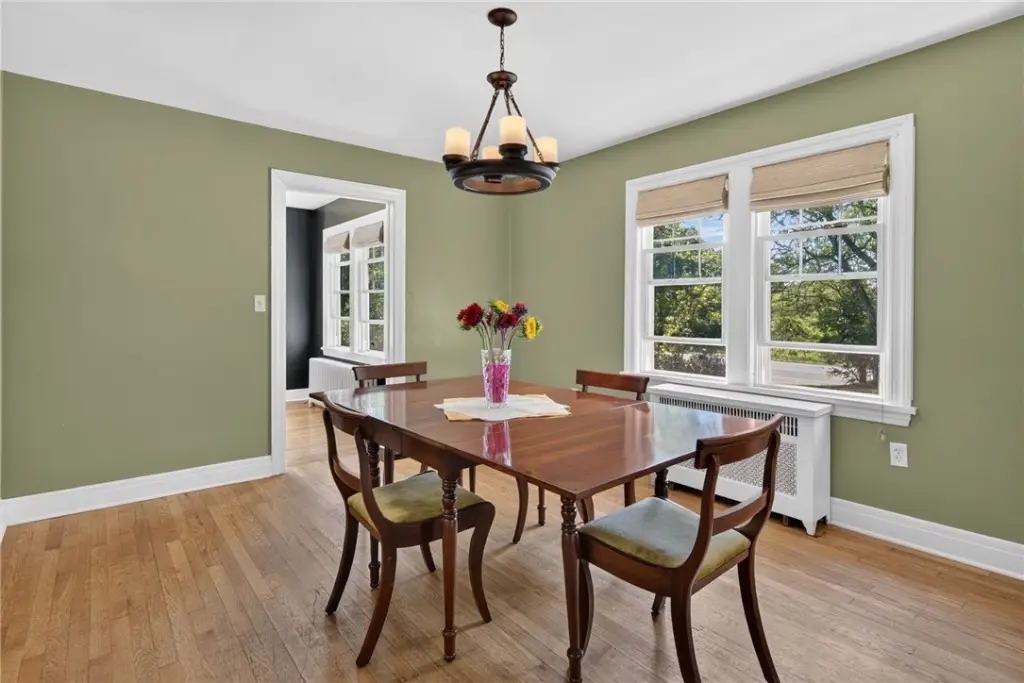
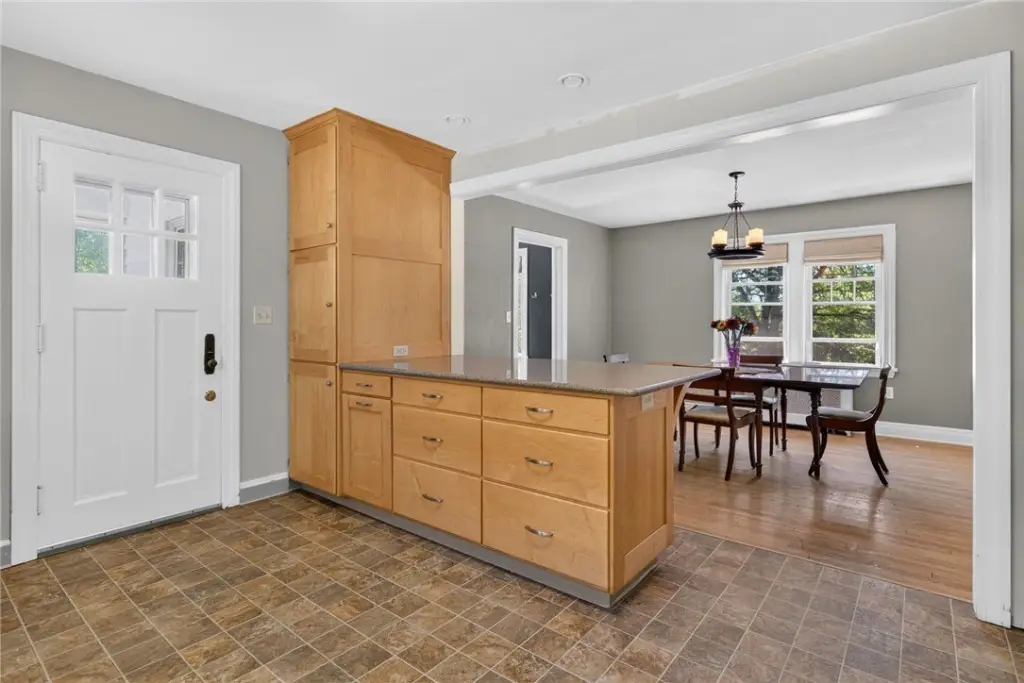
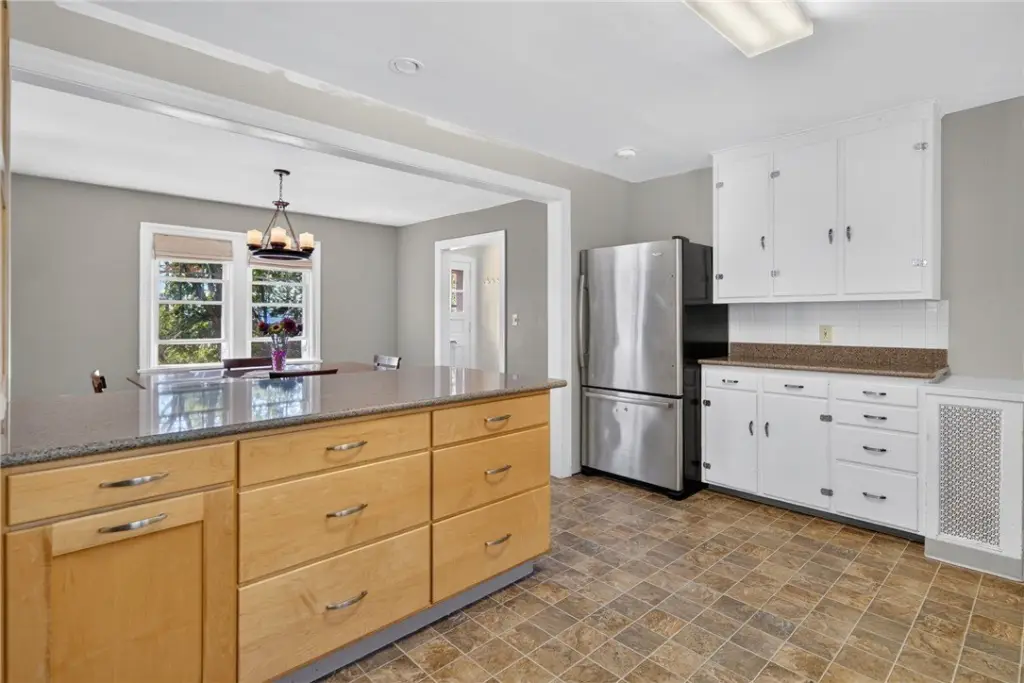
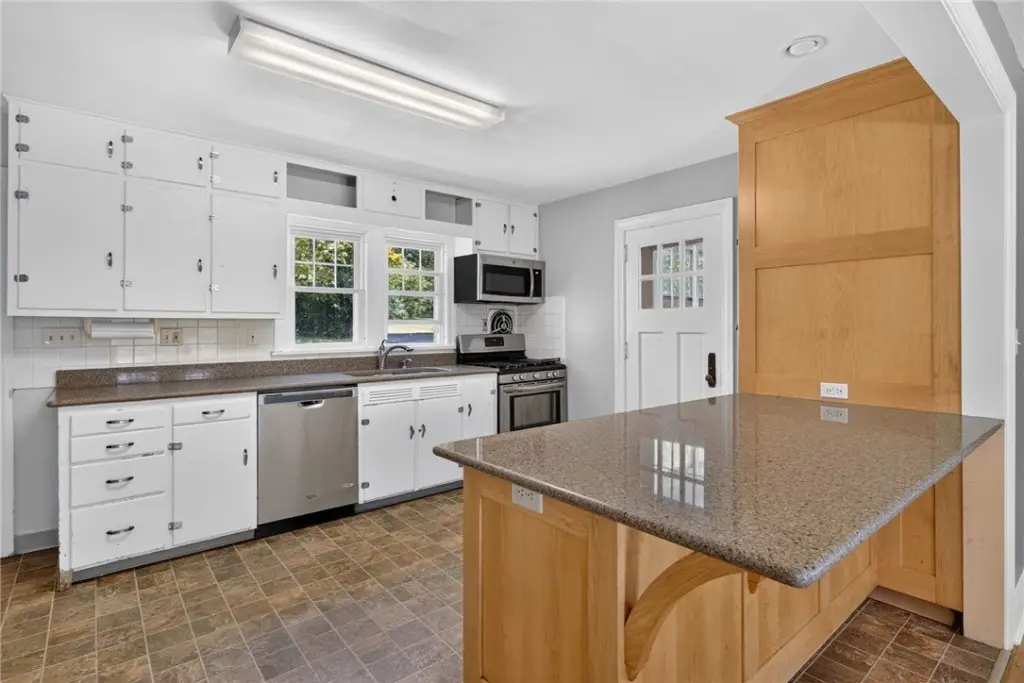
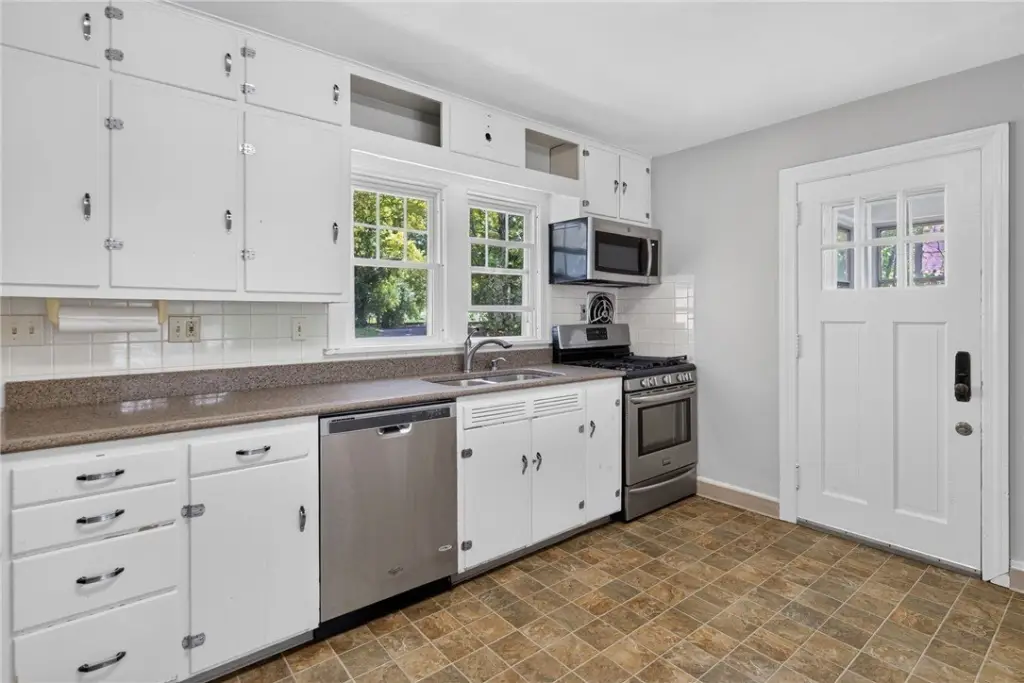
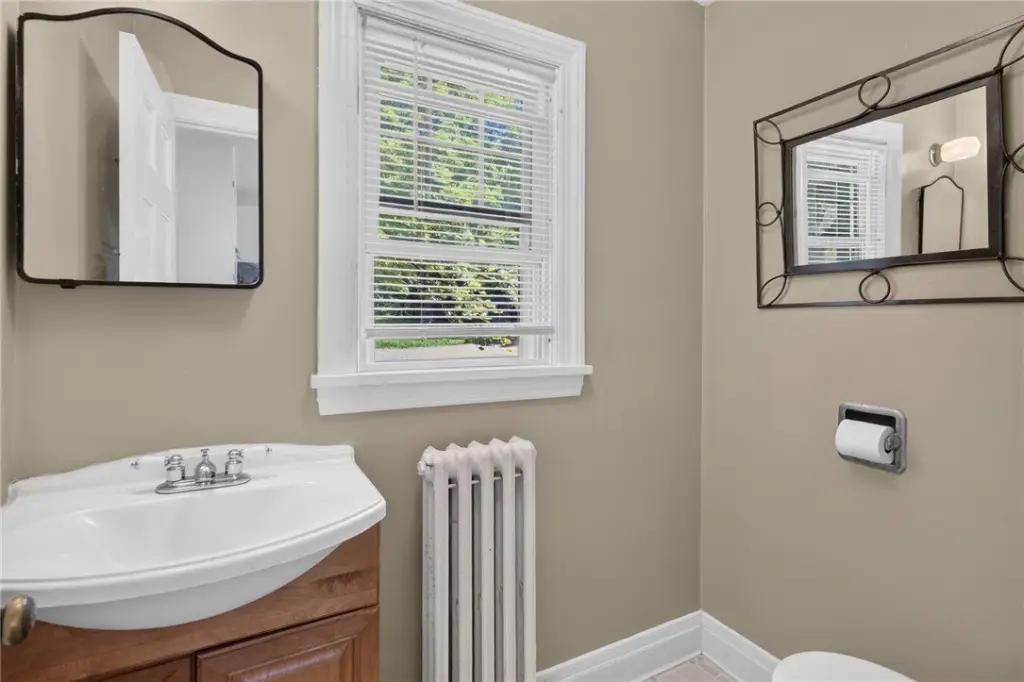
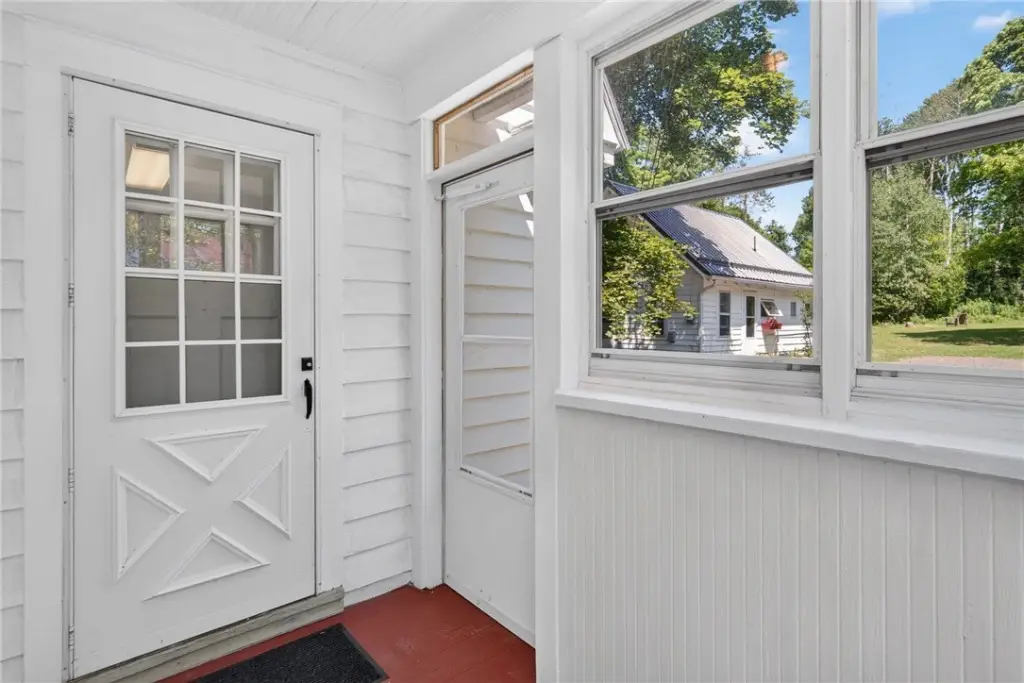
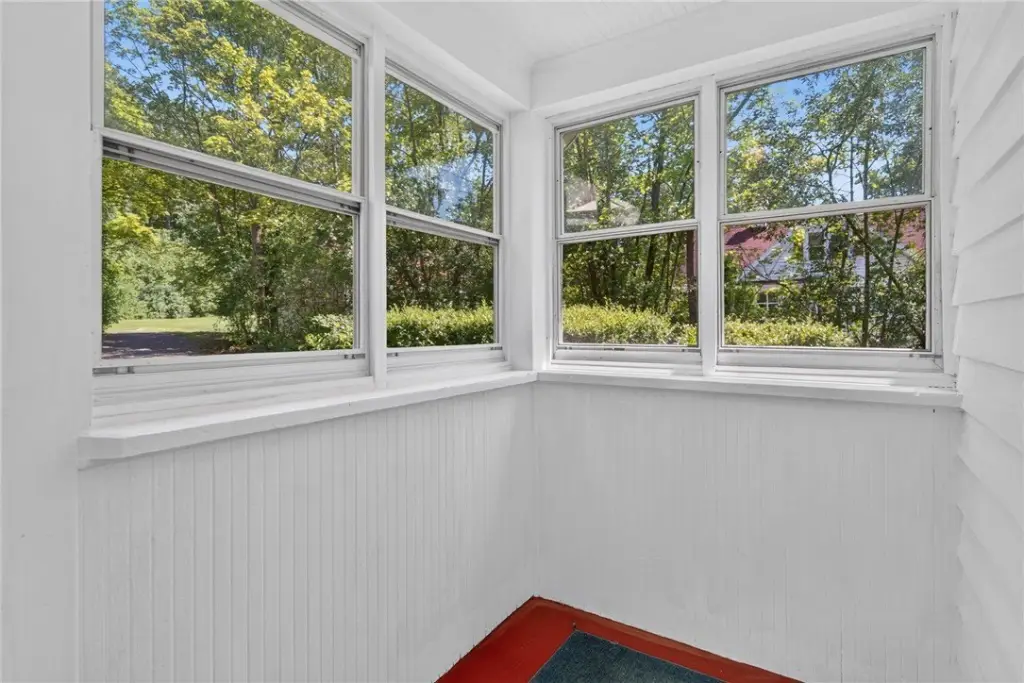
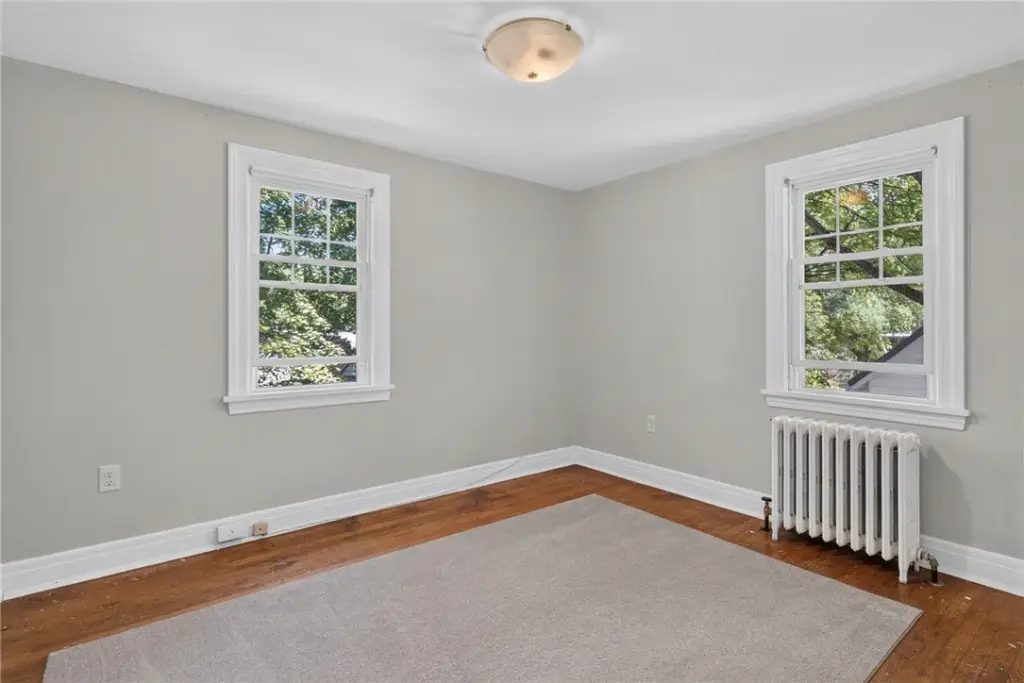
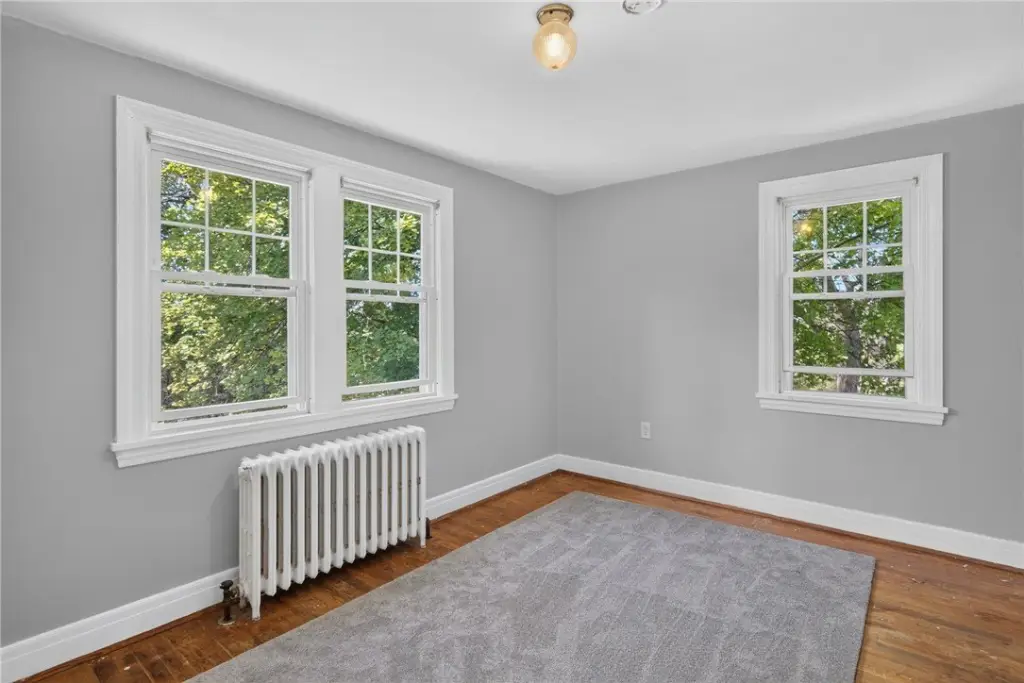
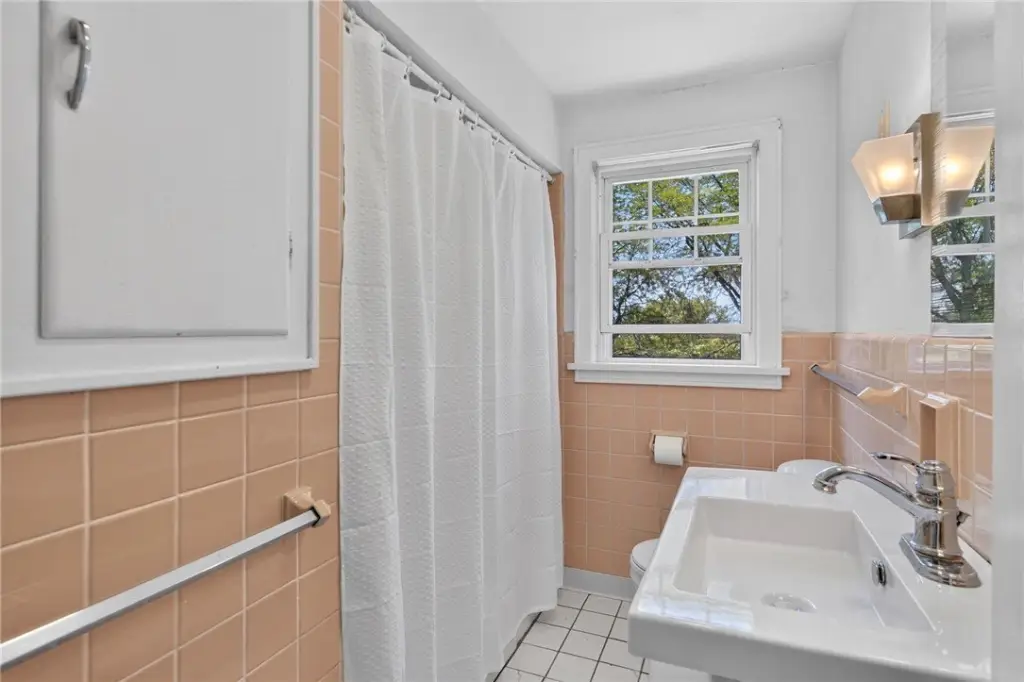
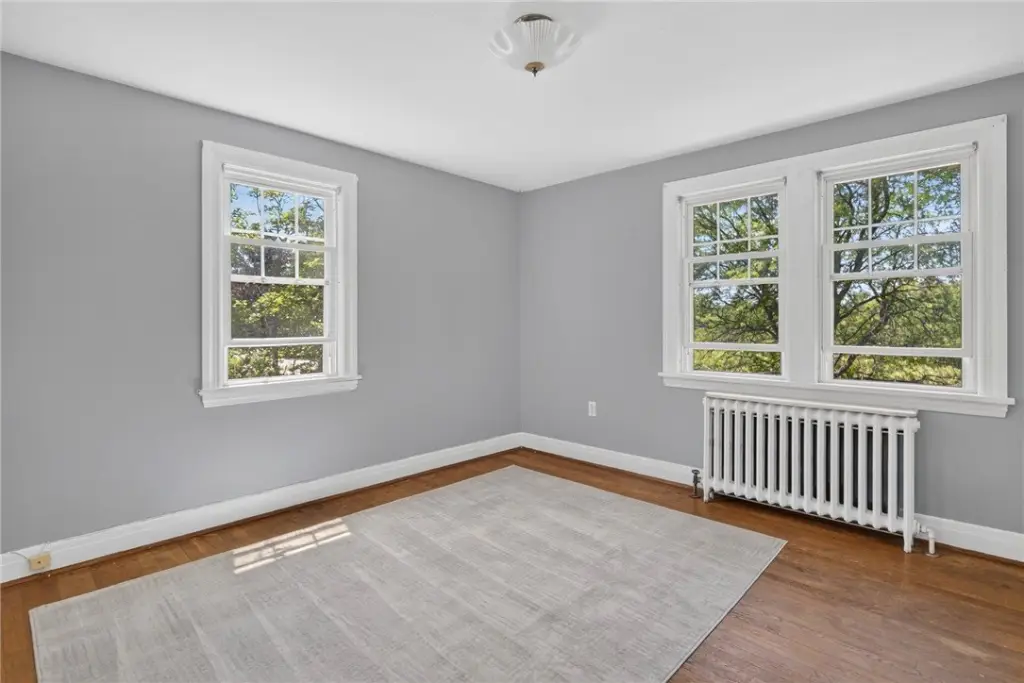
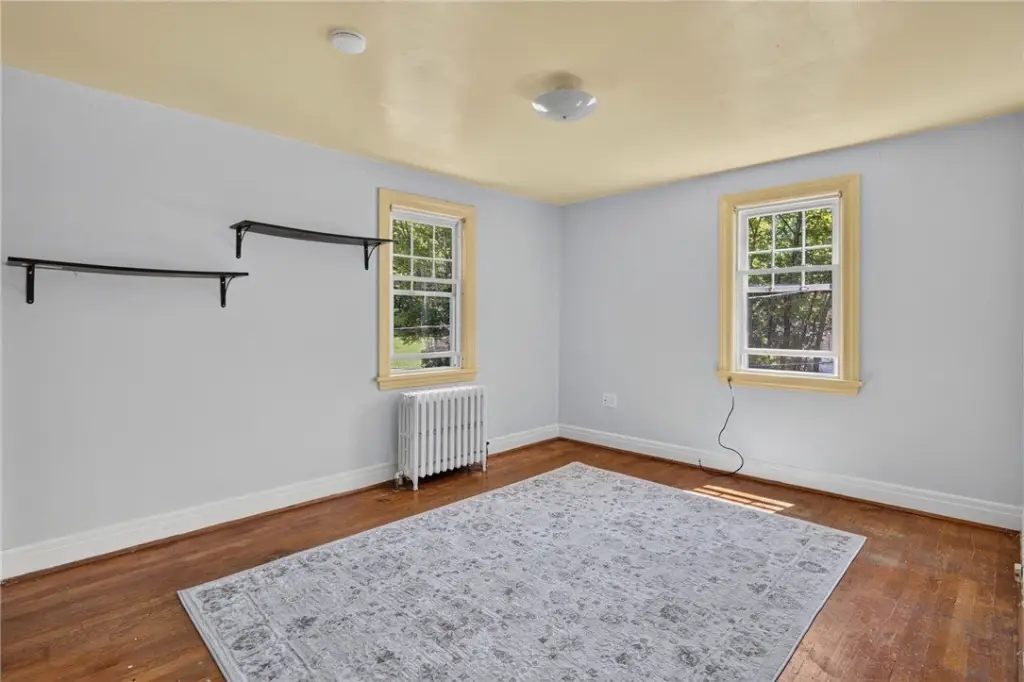
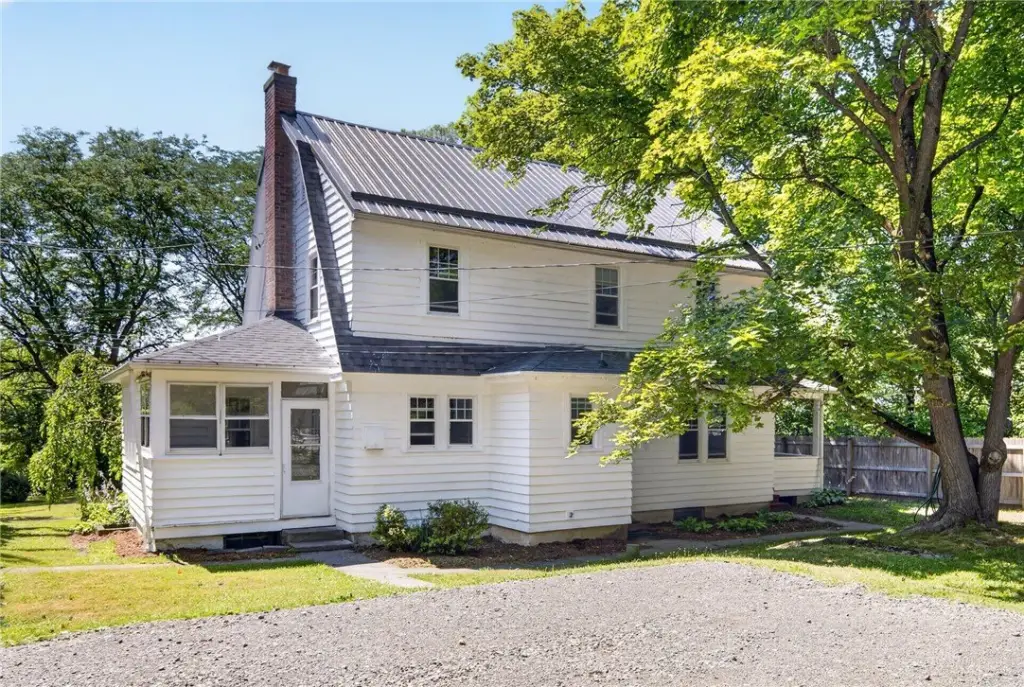
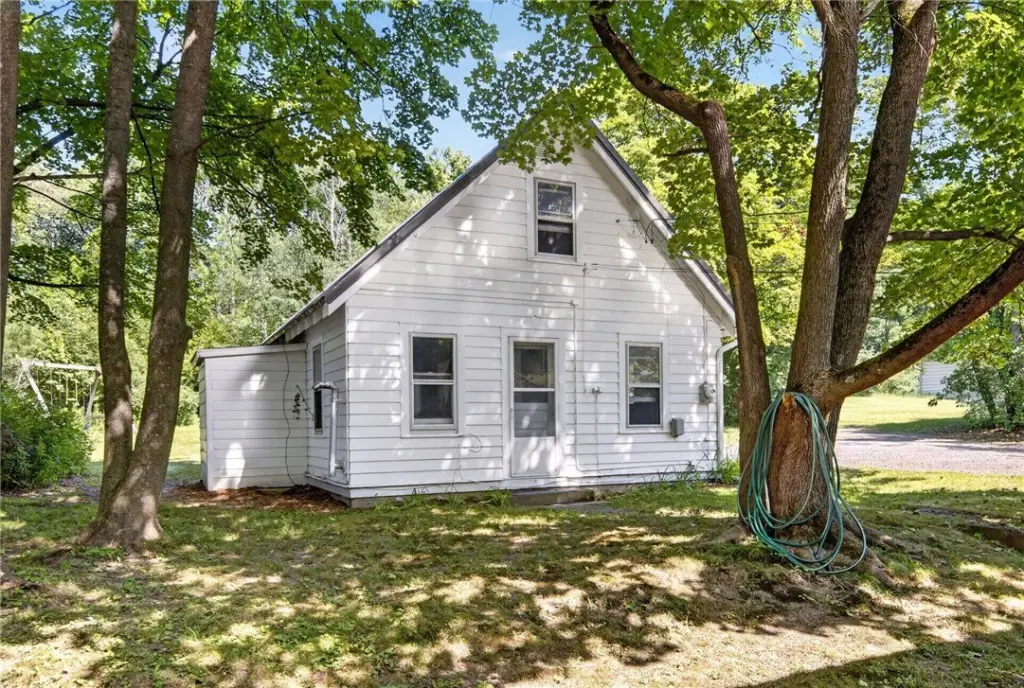
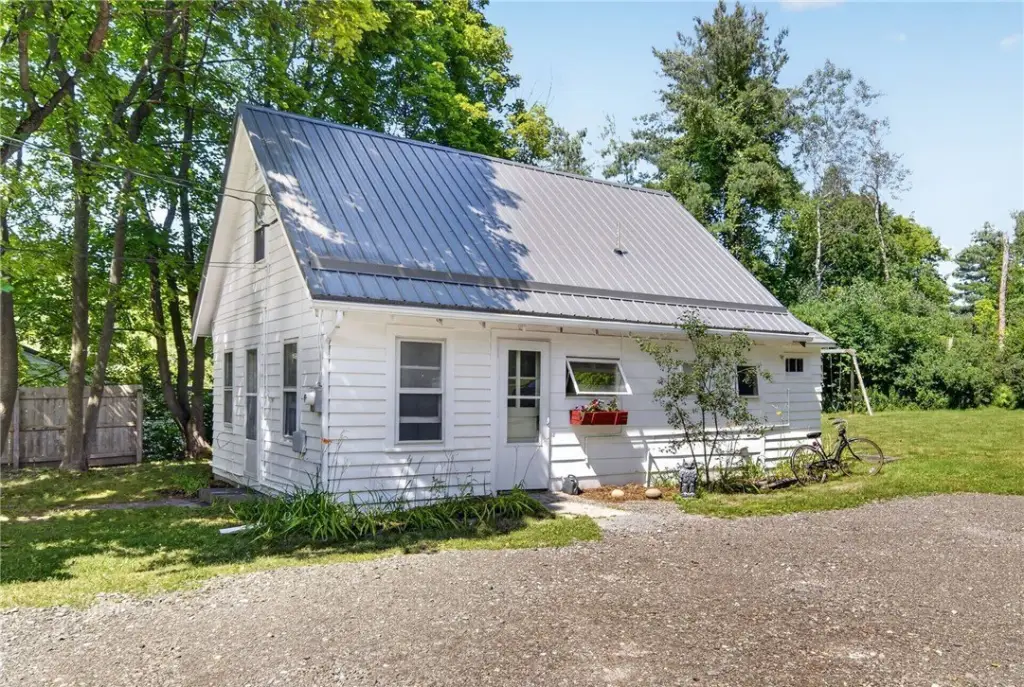
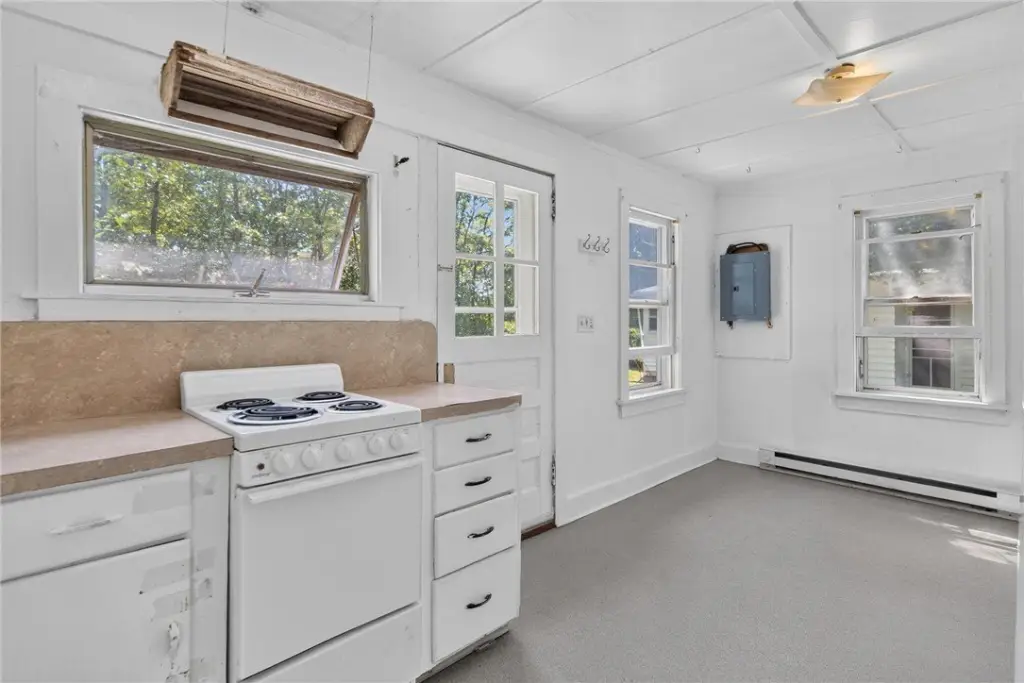
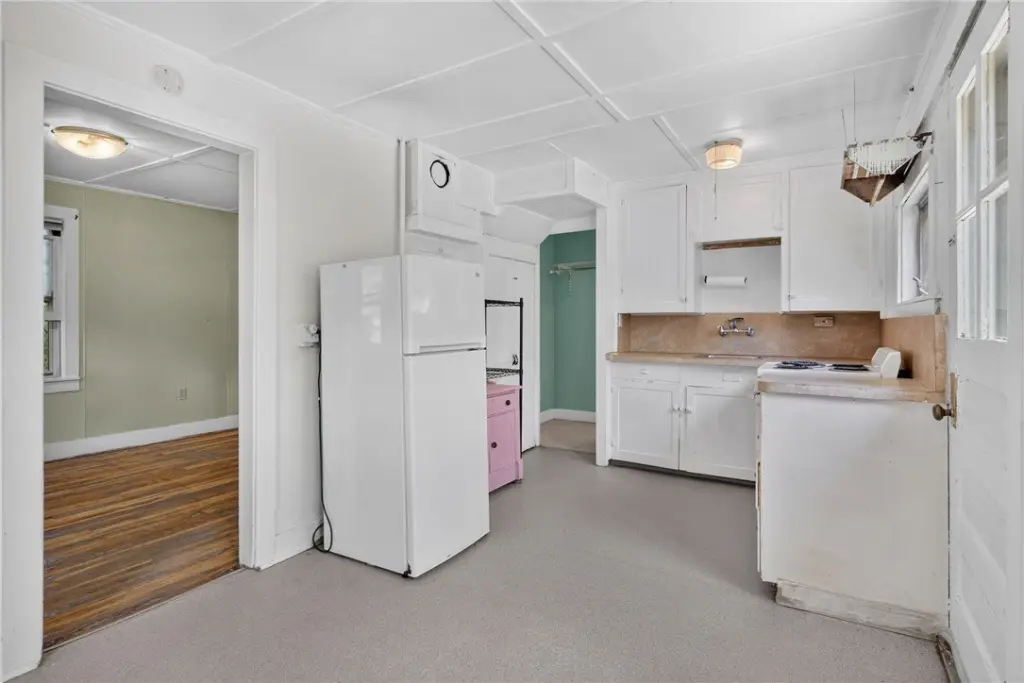
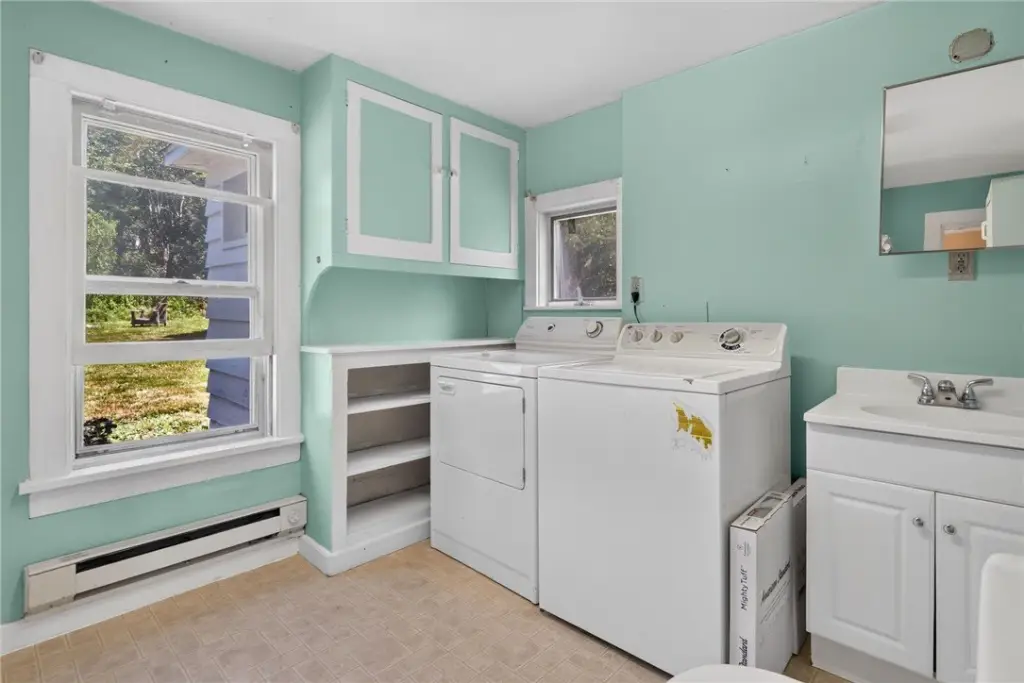
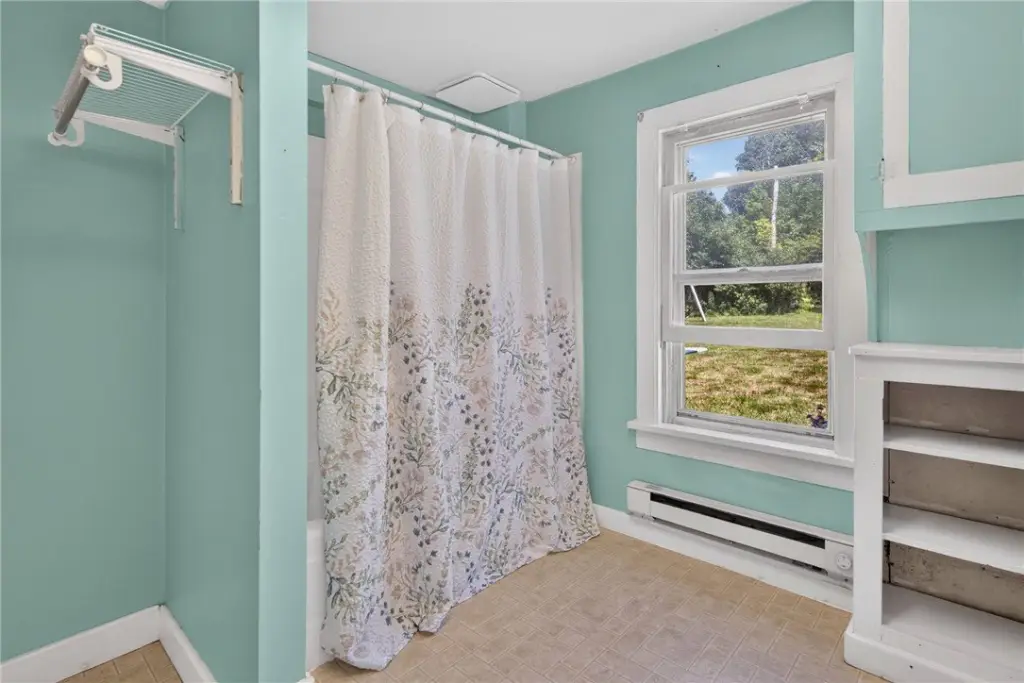
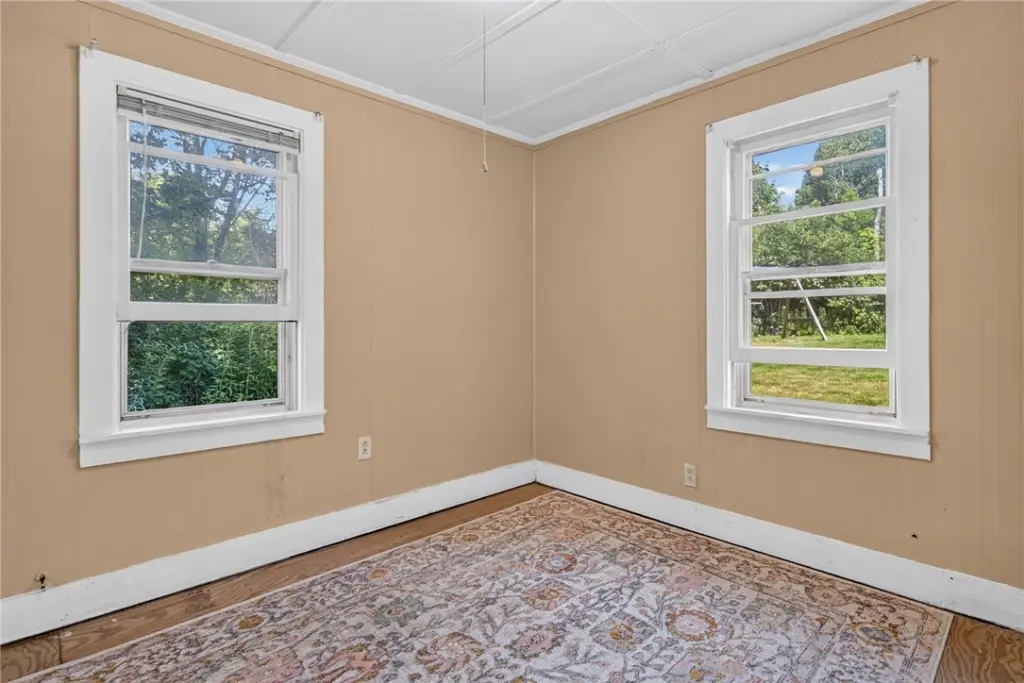
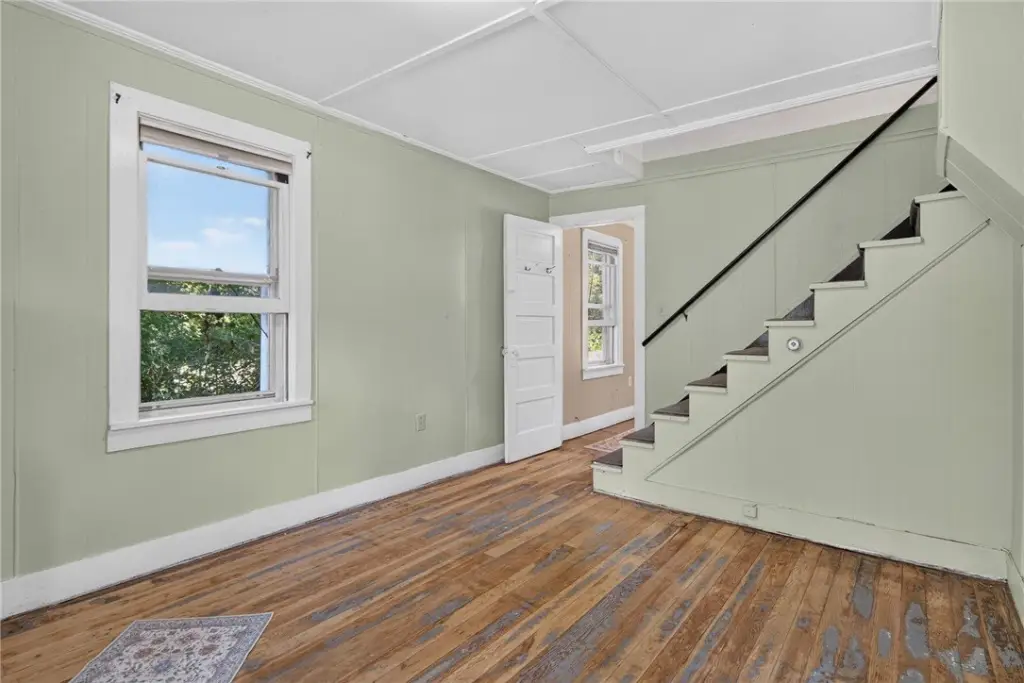
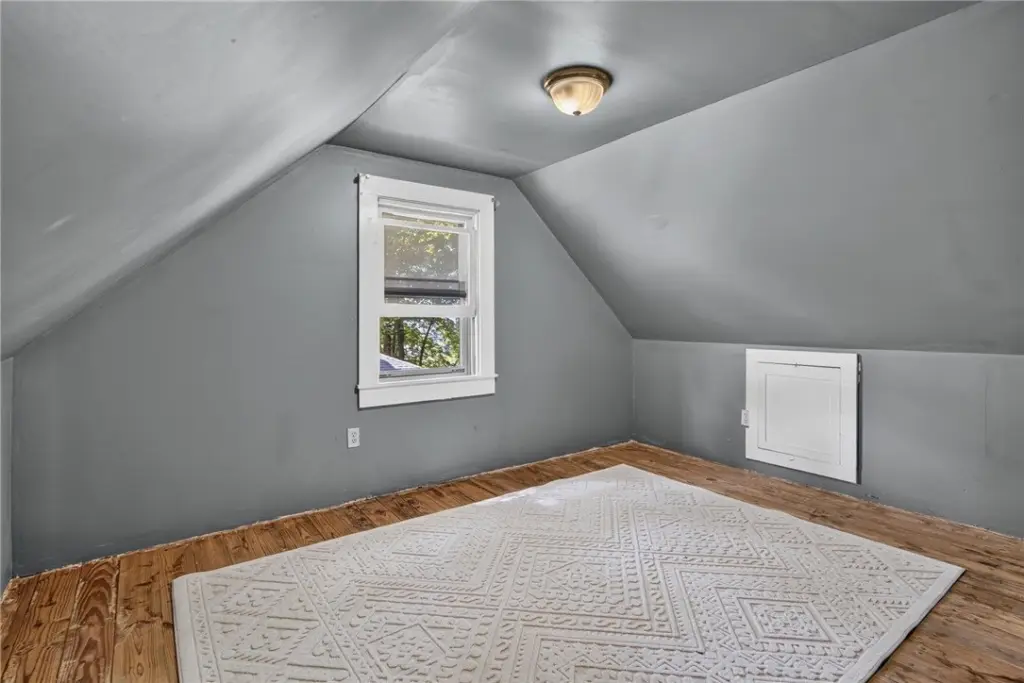
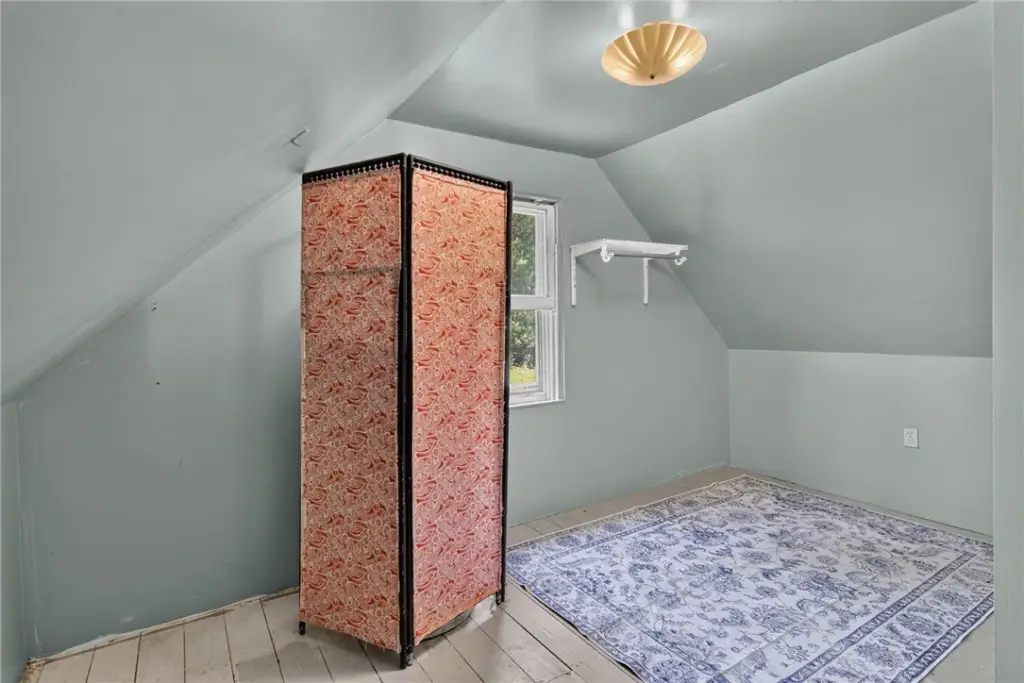
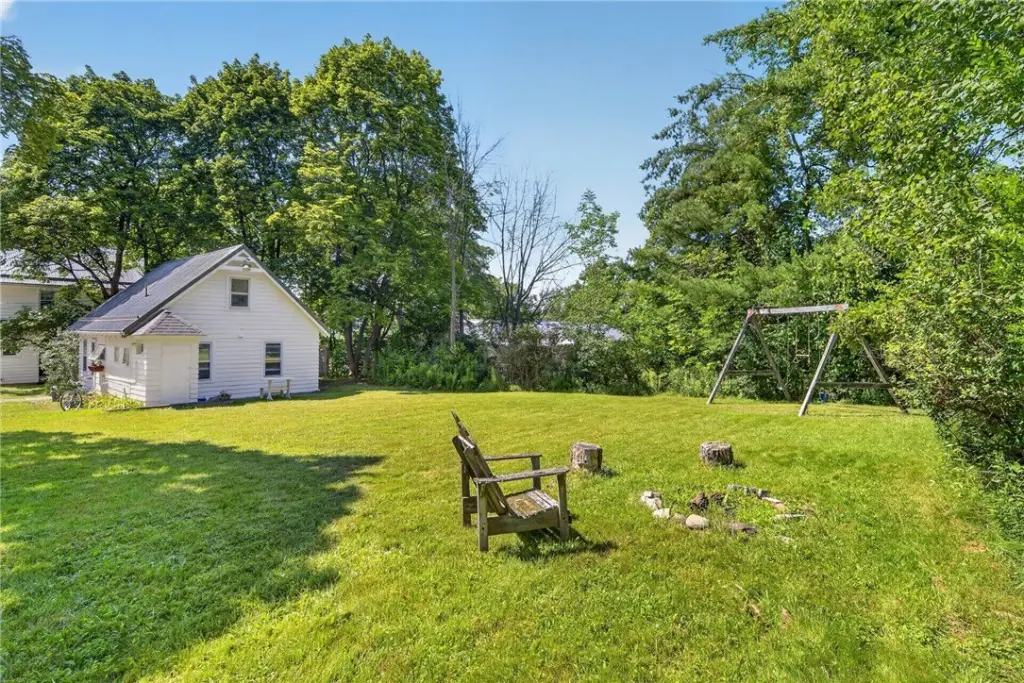
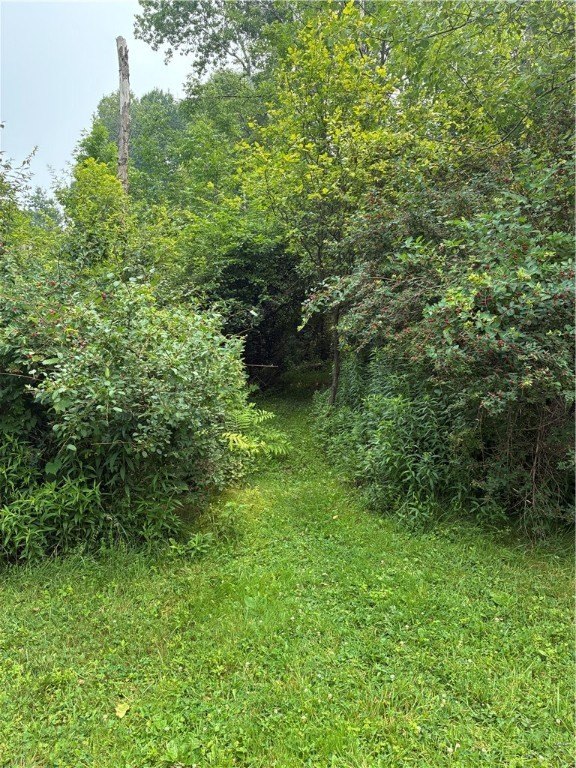
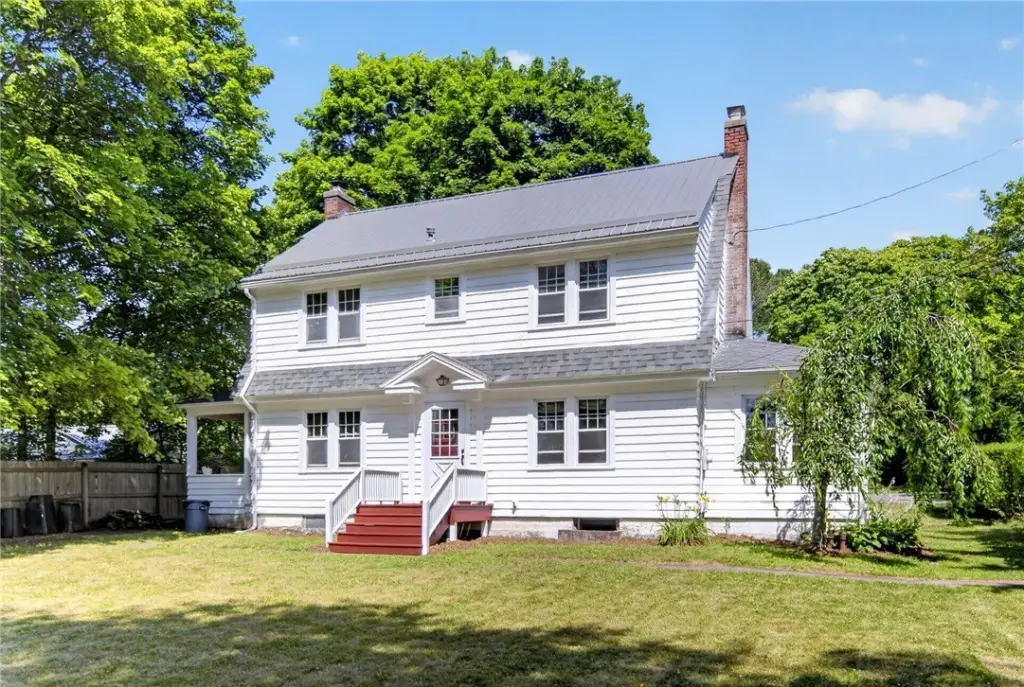
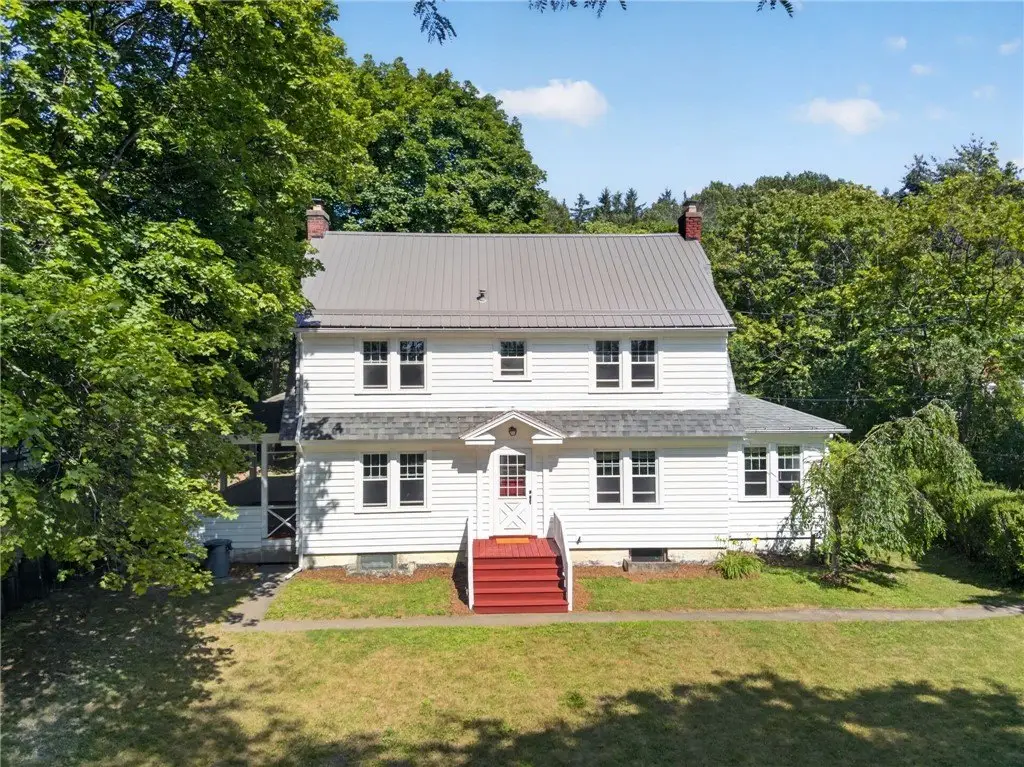
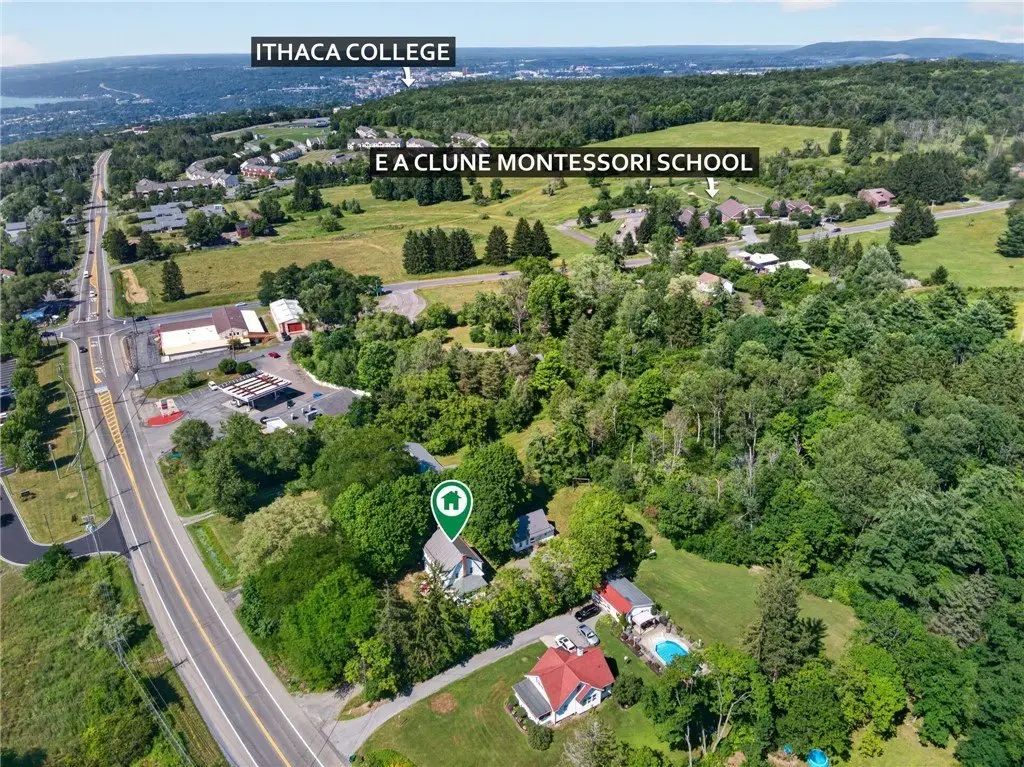
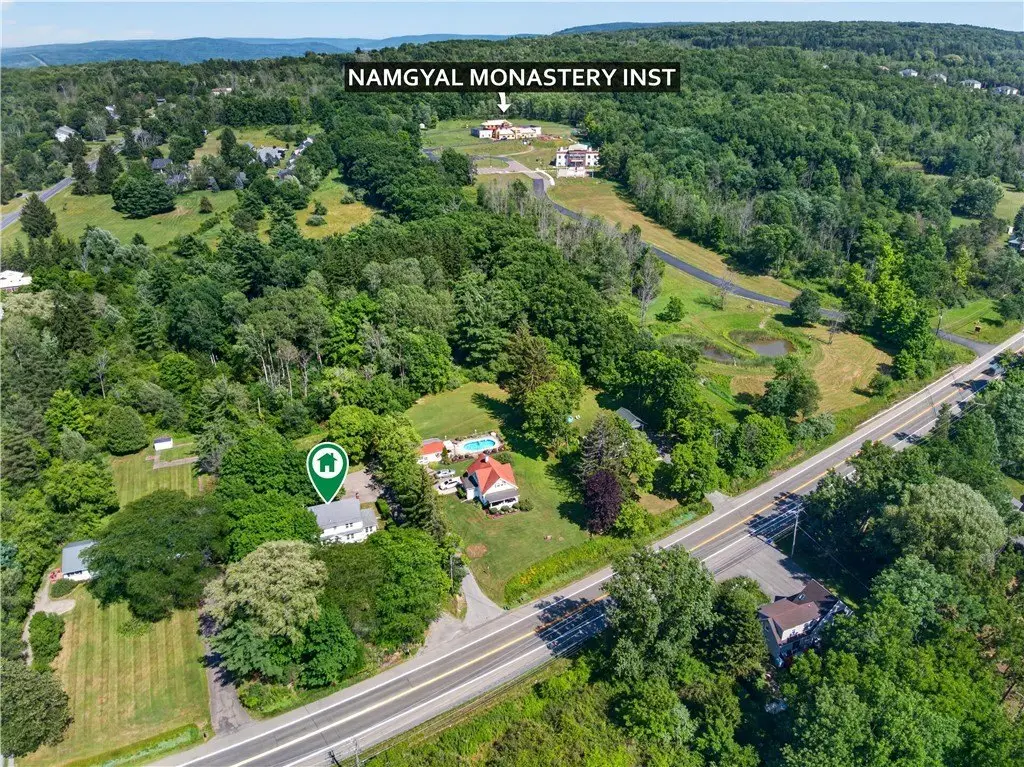
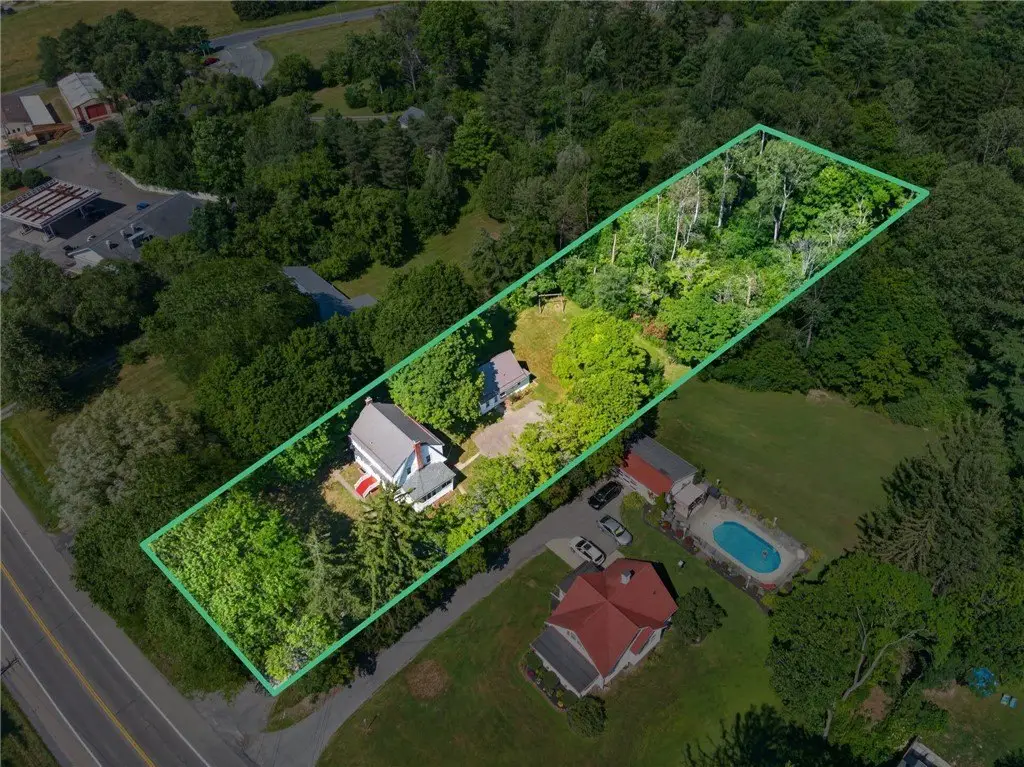
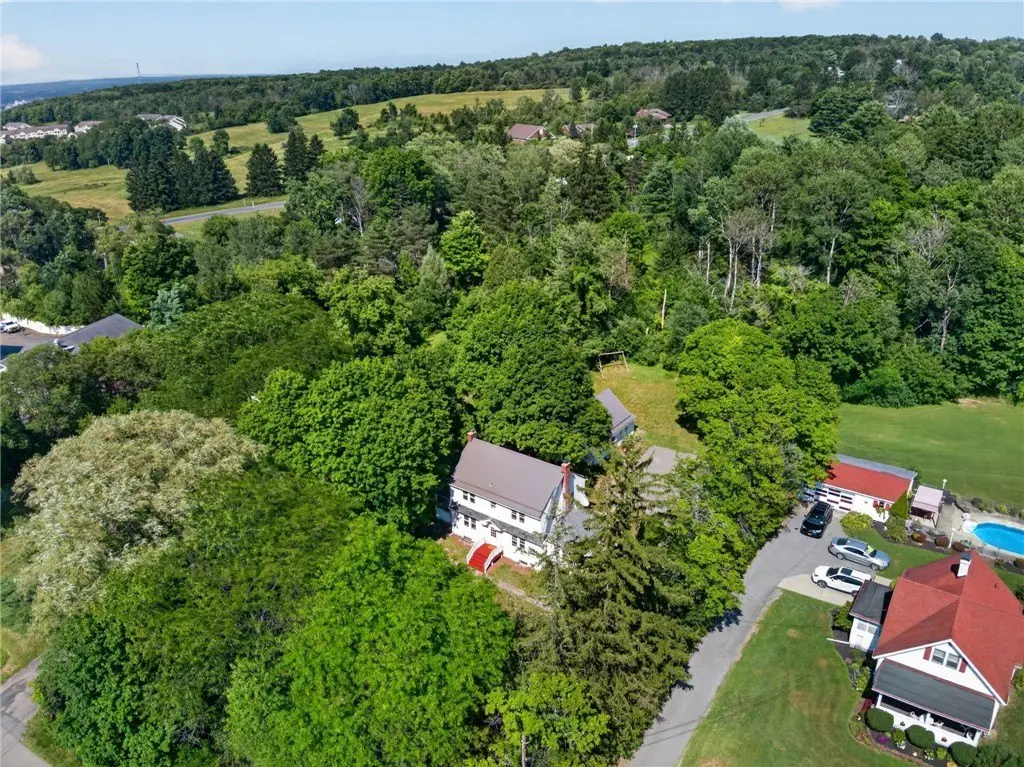
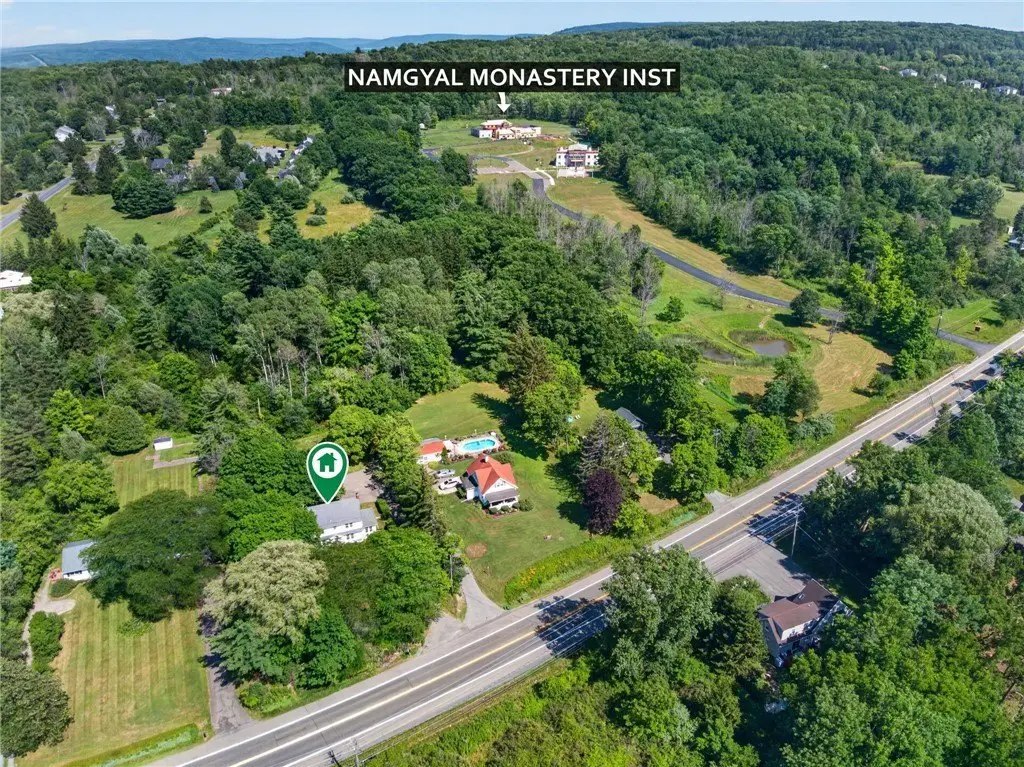
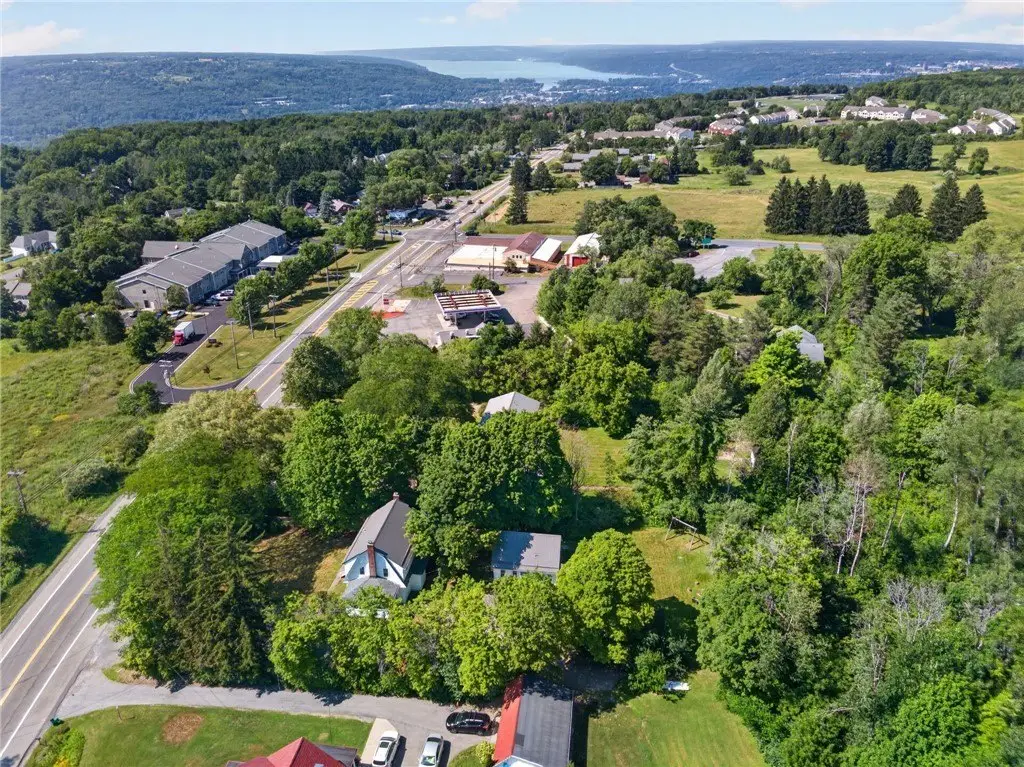
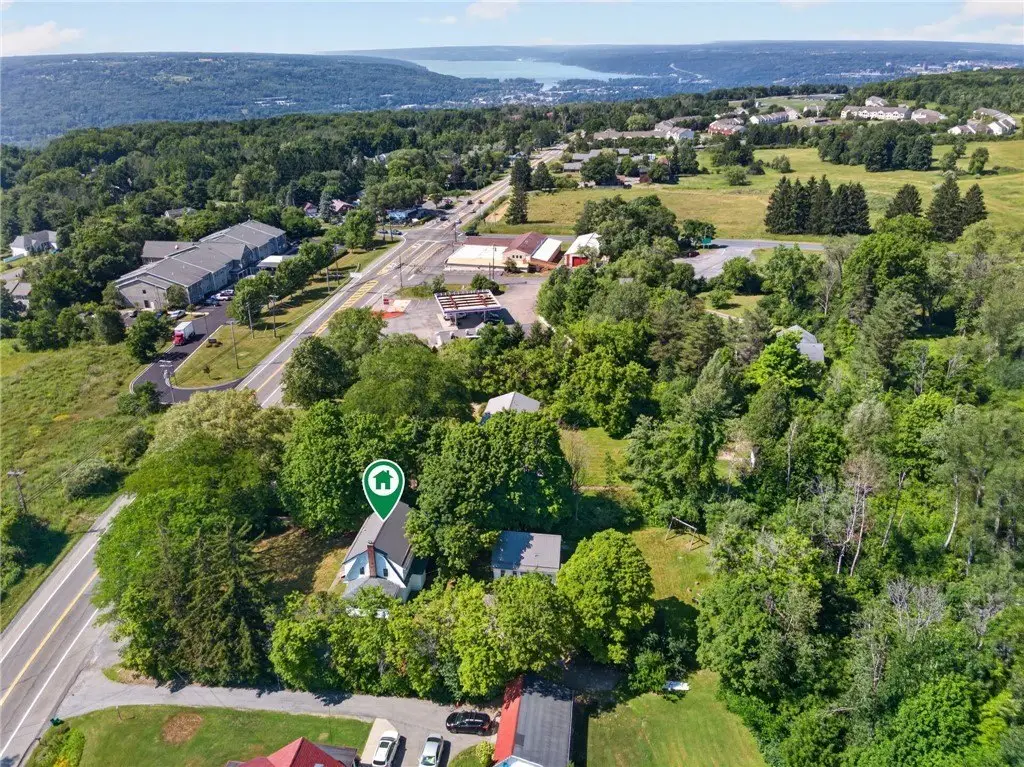
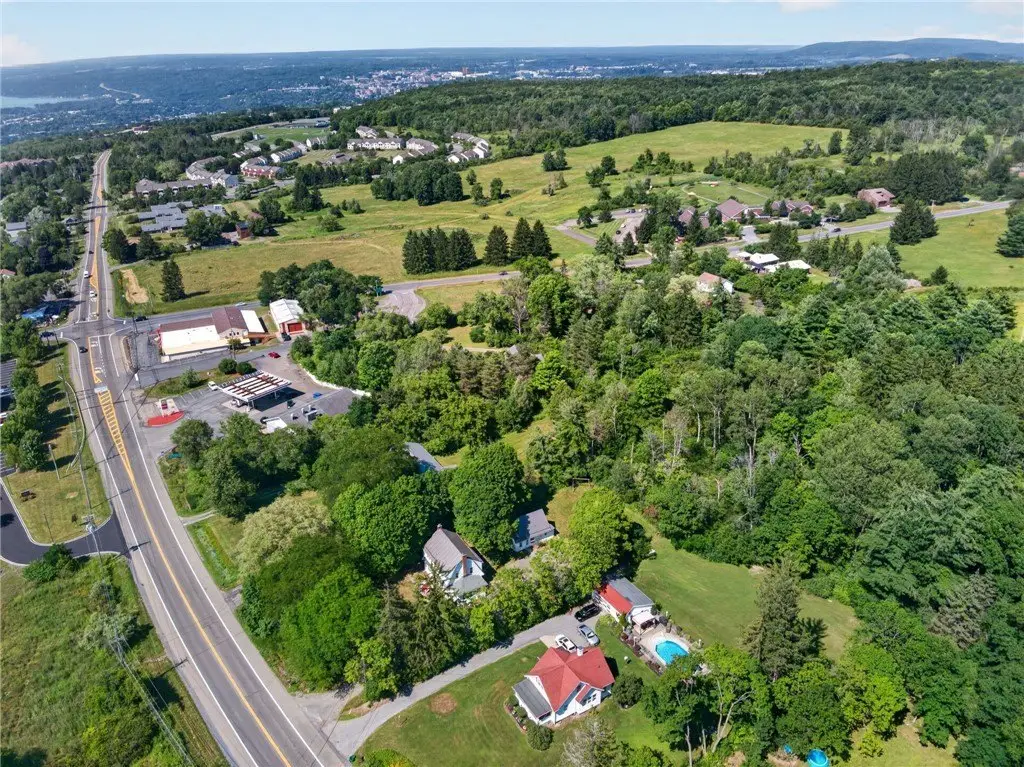
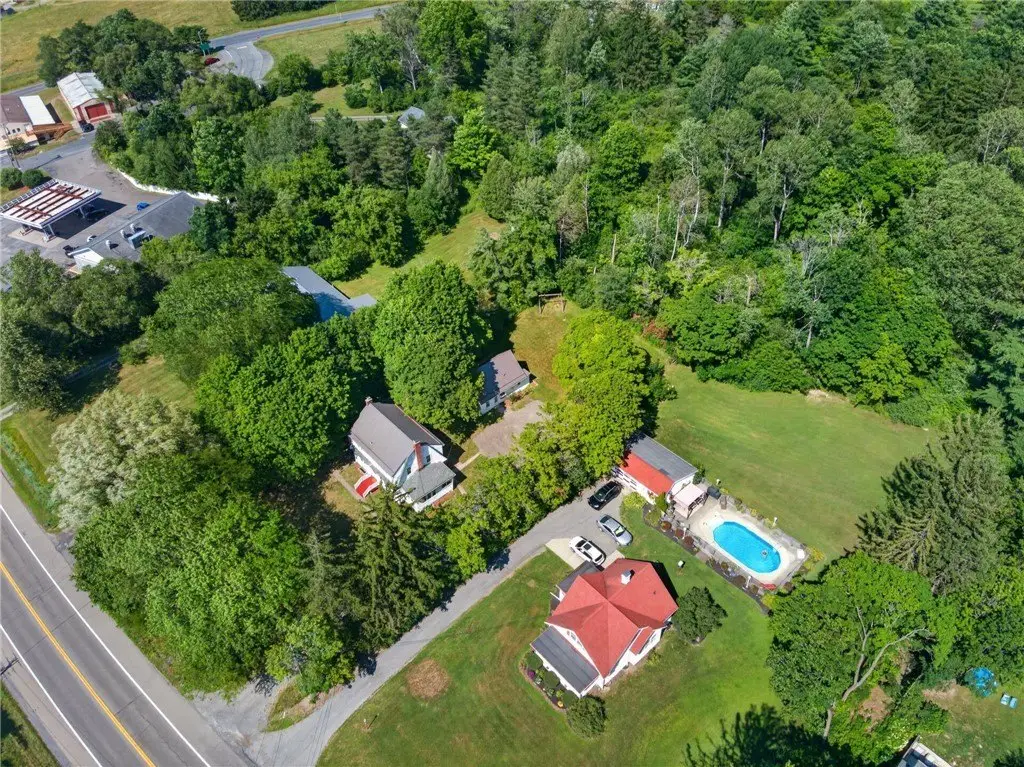
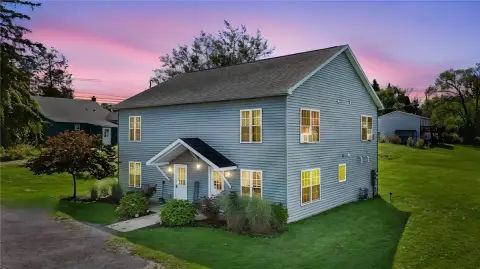
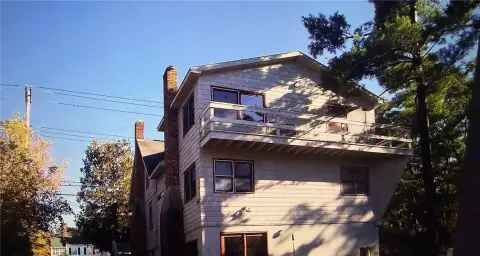
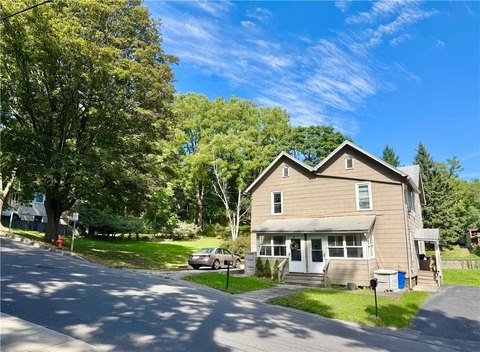
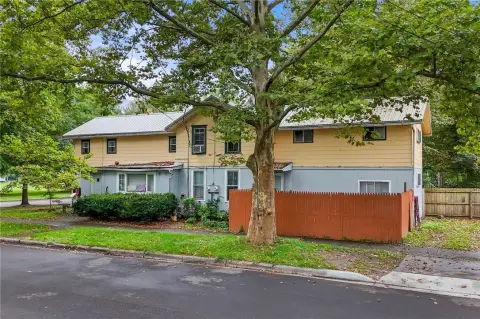
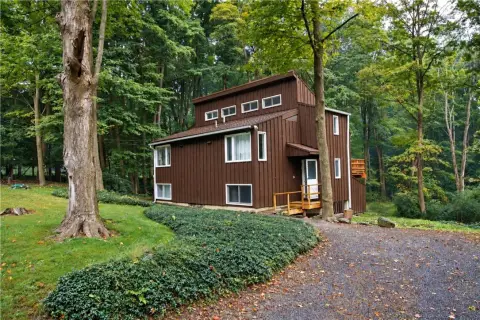
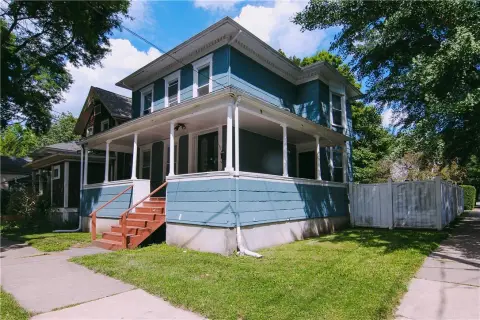
This duplex property includes a 4-bedroom, 1.5-bath main residence and a detached two-story tenant house measuring 1,000 square feet. The primary home, built in 1941, offers a living room with fireplace, formal dining room, adjoining sunroom, renovated kitchen, hardwood floors, newer windows, and natural woodwork. The second structure has a pellet stove and provides additional residential space for tenants or guests. The property measures 2,476 square feet and occupies 1.1 acres with a large front yard, private outdoor areas, extensive parking, and a partly wooded setting. Both structures have newer metal roofs, while the main house exterior has been painted with a lead-encapsulating coating. Public water serves the property. A Buttermilk Falls trailhead is across the road, and a private path connects toward the Montessori School on E. King Road. Ithaca College, Cornell University, downtown shopping, and restaurants are nearby.
Key Highlights
- 4‑bedroom, 1.5‑bath main residence with renovated kitchen, hardwood floors, fireplace, sunroom, and newer windows
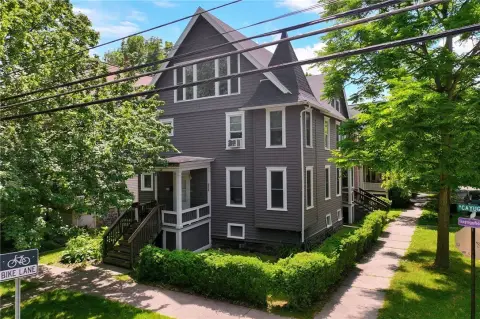
- Detached 2‑story tenant house with 1,000 sq ft and a pellet stove
- 2,476 square feet on a 1.1‑acre partly wooded parcel
Financial Insights
Estimated NOI and Cap Rate
NOI / Yr
$32,773
Cap Rate
6.57%
Suggested Prices Based on Cap Rates
Cap Rate 5%
$655,460
$655.5K
Cap Rate 7%
$468,186
$468.2K
Cap Rate 9%
$364,144
$364.1K
Market Conditions
NOI Build-Up for 2,476 SF
Gross rent
$49.0K $19.80/SF
− Vacancy
−$2.2K −$0.89/SF
EGI
$46.8K $18.91/SF
− OpEx
−$14.0K −$5.67/SF
NOI
$32.8K $13.24/SF
Area
Tompkins County, NY
Vacancy
4.50%
Lease Rate
$19.80 /SF/Yr
Expense Ratio
30.00%
Simulate Cap Rate and NOI
Suggested Prices Based on Cap Rates
Cap Rate 5%
$655,460
Cap Rate 7%
$468,186
Cap Rate 9%
$364,144
Alternative Uses
Best Use
Multifamily LT 5
$468.2K
$409.7K – $546.2K
NOI $32,773 @ 7.0% cap · market cap 6.57%
Second Best
Apartment 5plus
$433.9K
$379.6K – $506.2K
NOI $30,371 @ 7.0% cap · market cap 6.09%
Theoretical Best
Office A
$772.6K
$676.0K – $901.4K
NOI $54,083 @ 7.0% cap · market cap 10.84%
Zoning and permitted uses should be independently verified with authorities.
How Realmo checks its estimates
Property Analytics
Unlock full access to Insights
Subscribe to Realmo Intelligence
Open Analytics
Current Use
Lease Details
2
Residential units
Yes
Paved road access
Location Intelligence
Trade Area within ½ mile
66
Businesses Nearby
Explore this area
Business Placement
Demographics for 14850, NY
69,271
Population
31,772
Households
2.2
Avg Household Size
29
Median Age
72%
College-Educated
96%
High-School Grad
124.8 sq mi
ZIP Area
555
Density / Sq Mi
$69,689
Median Household Income
$36,115
Median Earnings
$1,446
Median Rent
$334,800
Median Home Value
Check the figures for this property
Cap Rate, Value Estimation, Potential NOI and more
View Realmo Analytics
Market
Vacancy Rate% for Multifamily in Northeast region
Frequently Asked Questions
What type of property is this?
Duplex - The property includes a primary residence and separate rental dwelling with updated roofs and public water.
Where is this duplex located?
The property is located at 1115 Danby Road Ithaca, NY.
What is the asking price?
The asking price for this property is $499,000.
What are key features of this property?
This property features: 4‑bedroom, 1.5‑bath main residence with renovated kitchen, hardwood floors, fireplace, sunroom, and newer windows; Detached 2‑story tenant house with 1,000 sq ft and a pellet stove; 2,476 square feet on a 1.1‑acre partly wooded parcel